
|
|||||
|
 | |
| |
| |
| |
| |
| |
|
Gene: DHRS13 |
Gene summary for DHRS13 |
| Gene information | Species | Human | Gene symbol | DHRS13 | Gene ID | 147015 |
| Gene name | dehydrogenase/reductase 13 | |
| Gene Alias | SDR7C5 | |
| Cytomap | 17q11.2 | |
| Gene Type | protein-coding | GO ID | GO:0001523 | UniProtAcc | Q6UX07 |
Top |
Malignant transformation analysis |
| Identification of the aberrant gene expression in precancerous and cancerous lesions by comparing the gene expression of stem-like cells in diseased tissues with normal stem cells |
| Entrez ID | Symbol | Replicates | Species | Organ | Tissue | Adj P-value | Log2FC | Malignancy |
| 147015 | DHRS13 | LZE5T | Human | Esophagus | ESCC | 3.45e-02 | 2.06e-01 | 0.0514 |
| 147015 | DHRS13 | LZE22T | Human | Esophagus | ESCC | 2.41e-02 | 2.06e-01 | 0.068 |
| 147015 | DHRS13 | LZE24T | Human | Esophagus | ESCC | 3.39e-08 | 2.56e-01 | 0.0596 |
| 147015 | DHRS13 | LZE21T | Human | Esophagus | ESCC | 1.80e-04 | 3.06e-01 | 0.0655 |
| 147015 | DHRS13 | P1T-E | Human | Esophagus | ESCC | 9.55e-03 | 3.99e-01 | 0.0875 |
| 147015 | DHRS13 | P2T-E | Human | Esophagus | ESCC | 1.77e-45 | 8.46e-01 | 0.1177 |
| 147015 | DHRS13 | P4T-E | Human | Esophagus | ESCC | 4.82e-17 | 4.10e-01 | 0.1323 |
| 147015 | DHRS13 | P5T-E | Human | Esophagus | ESCC | 1.45e-04 | 1.49e-01 | 0.1327 |
| 147015 | DHRS13 | P8T-E | Human | Esophagus | ESCC | 1.76e-08 | 2.07e-01 | 0.0889 |
| 147015 | DHRS13 | P9T-E | Human | Esophagus | ESCC | 6.57e-07 | 2.05e-01 | 0.1131 |
| 147015 | DHRS13 | P10T-E | Human | Esophagus | ESCC | 1.93e-11 | 2.32e-01 | 0.116 |
| 147015 | DHRS13 | P11T-E | Human | Esophagus | ESCC | 9.36e-06 | 2.21e-01 | 0.1426 |
| 147015 | DHRS13 | P12T-E | Human | Esophagus | ESCC | 6.29e-21 | 4.39e-01 | 0.1122 |
| 147015 | DHRS13 | P15T-E | Human | Esophagus | ESCC | 3.32e-19 | 4.55e-01 | 0.1149 |
| 147015 | DHRS13 | P16T-E | Human | Esophagus | ESCC | 5.54e-47 | 8.06e-01 | 0.1153 |
| 147015 | DHRS13 | P20T-E | Human | Esophagus | ESCC | 3.44e-18 | 3.08e-01 | 0.1124 |
| 147015 | DHRS13 | P21T-E | Human | Esophagus | ESCC | 6.23e-42 | 7.74e-01 | 0.1617 |
| 147015 | DHRS13 | P22T-E | Human | Esophagus | ESCC | 3.03e-08 | 2.05e-01 | 0.1236 |
| 147015 | DHRS13 | P23T-E | Human | Esophagus | ESCC | 5.28e-14 | 4.45e-01 | 0.108 |
| 147015 | DHRS13 | P24T-E | Human | Esophagus | ESCC | 2.07e-02 | 1.69e-01 | 0.1287 |
| Page: 1 2 3 4 |
| Tissue | Expression Dynamics | Abbreviation |
| Esophagus |  | ESCC: Esophageal squamous cell carcinoma |
| HGIN: High-grade intraepithelial neoplasias | ||
| LGIN: Low-grade intraepithelial neoplasias | ||
| Oral Cavity | 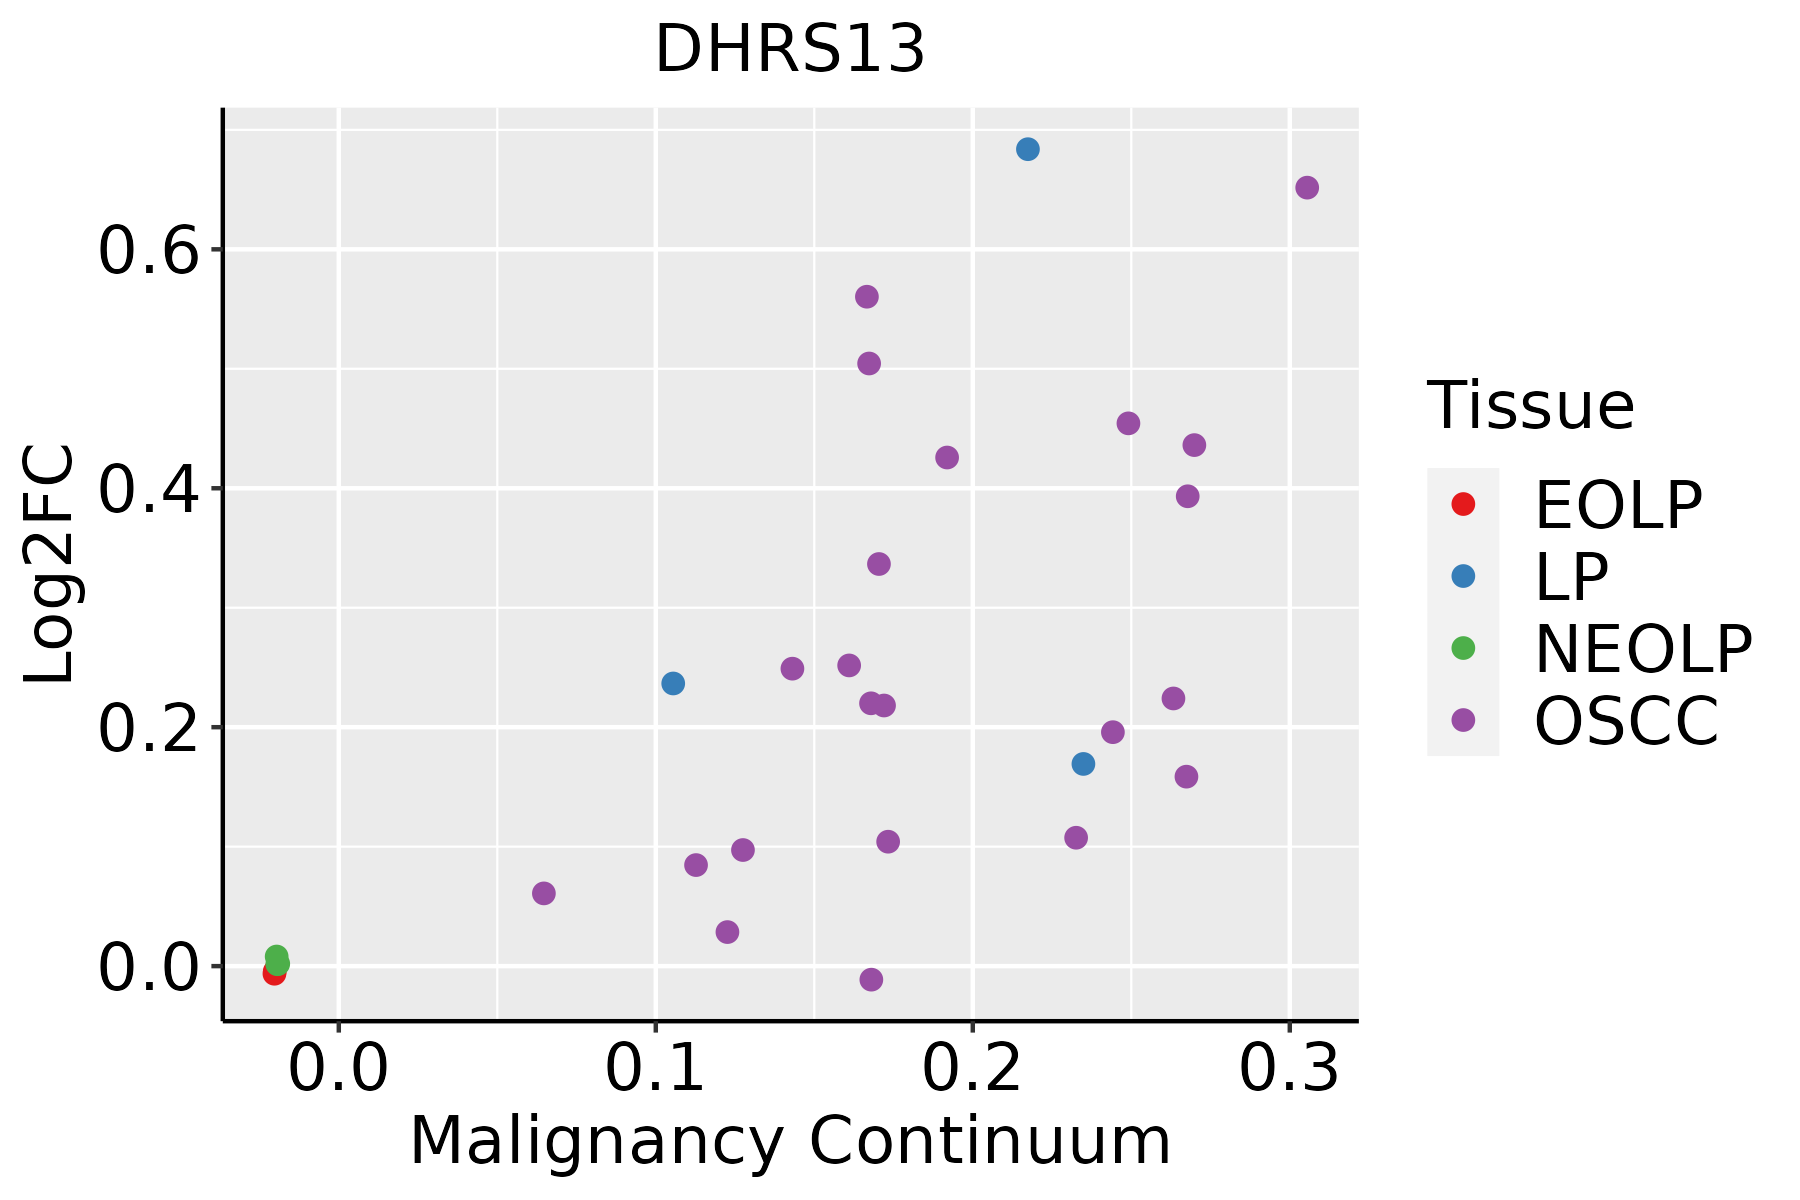 | EOLP: Erosive Oral lichen planus |
| LP: leukoplakia | ||
| NEOLP: Non-erosive oral lichen planus | ||
| OSCC: Oral squamous cell carcinoma |
| ∗log2FC in expression of this searched gene in stem-like cells from each diseased tissue sample relative to stem-like cells in normal samples in each tissue plotted against the malignancy continuum. Samples are colored based on if they are from different disease stage. |
Top |
Malignant transformation related pathway analysis |
| Find out the enriched GO biological processes and KEGG pathways involved in transition from healthy to precancer to cancer |
| Tissue | Disease Stage | Enriched GO biological Processes |
| Colorectum | AD |  |
| Colorectum | SER |  |
| Colorectum | MSS |  |
| Colorectum | MSI-H |  |
| Colorectum | FAP |  |
| ∗Top 15 enriched GO BP terms are showed in the bar plot of each disease state in each tissue. Each row represents a significant GO biological process which is colored according to the -log10(p.adjust). |
| Page: 1 2 3 4 5 6 7 8 9 |
| GO ID | Tissue | Disease Stage | Description | Gene Ratio | Bg Ratio | pvalue | p.adjust | Count |
| GO:00060668 | Esophagus | ESCC | alcohol metabolic process | 202/8552 | 353/18723 | 7.32e-06 | 7.26e-05 | 202 |
| GO:00060818 | Esophagus | ESCC | cellular aldehyde metabolic process | 40/8552 | 60/18723 | 8.30e-04 | 4.28e-03 | 40 |
| GO:00060667 | Oral cavity | OSCC | alcohol metabolic process | 179/7305 | 353/18723 | 4.54e-06 | 5.21e-05 | 179 |
| GO:00060817 | Oral cavity | OSCC | cellular aldehyde metabolic process | 36/7305 | 60/18723 | 7.94e-04 | 4.27e-03 | 36 |
| GO:00067203 | Oral cavity | OSCC | isoprenoid metabolic process | 59/7305 | 116/18723 | 6.18e-03 | 2.33e-02 | 59 |
| GO:000608114 | Oral cavity | LP | cellular aldehyde metabolic process | 26/4623 | 60/18723 | 1.19e-03 | 9.62e-03 | 26 |
| GO:000606613 | Oral cavity | LP | alcohol metabolic process | 111/4623 | 353/18723 | 2.24e-03 | 1.62e-02 | 111 |
| Page: 1 |
| Pathway ID | Tissue | Disease Stage | Description | Gene Ratio | Bg Ratio | pvalue | p.adjust | qvalue | Count |
| Page: 1 |
Top |
Cell-cell communication analysis |
| Identification of potential cell-cell interactions between two cell types and their ligand-receptor pairs for different disease states |
| Ligand | Receptor | LRpair | Pathway | Tissue | Disease Stage |
| Page: 1 |
Top |
Single-cell gene regulatory network inference analysis |
| Find out the significant the regulons (TFs) and the target genes of each regulon across cell types for different disease states |
| TF | Cell Type | Tissue | Disease Stage | Target Gene | RSS | Regulon Activity |
| ∗The dot plots of a searched regulon are shown for all cell subpopulations in each disease state of each tissue based on the regulon specific score inferred using pySCENIC and by calculating the average expression. |
| Page: 1 |
Top |
Somatic mutation of malignant transformation related genes |
| Annotation of somatic variants for genes involved in malignant transformation |
| Hugo Symbol | Variant Class | Variant Classification | dbSNP RS | HGVSc | HGVSp | HGVSp Short | SWISSPROT | BIOTYPE | SIFT | PolyPhen | Tumor Sample Barcode | Tissue | Histology | Sex | Age | Stage | Therapy Types | Drugs | Outcome |
| DHRS13 | SNV | Missense_Mutation | c.991G>C | p.Glu331Gln | p.E331Q | Q6UX07 | protein_coding | tolerated_low_confidence(0.53) | benign(0) | TCGA-A1-A0SH-01 | Breast | breast invasive carcinoma | Female | <65 | I/II | Chemotherapy | tc | SD | |
| DHRS13 | SNV | Missense_Mutation | c.673N>T | p.Ala225Ser | p.A225S | Q6UX07 | protein_coding | deleterious(0.01) | possibly_damaging(0.643) | TCGA-AN-A0FT-01 | Breast | breast invasive carcinoma | Female | <65 | I/II | Unknown | Unknown | SD | |
| DHRS13 | SNV | Missense_Mutation | c.623N>T | p.Ala208Val | p.A208V | Q6UX07 | protein_coding | tolerated(0.14) | benign(0.005) | TCGA-BH-A18G-01 | Breast | breast invasive carcinoma | Female | >=65 | I/II | Unknown | Unknown | SD | |
| DHRS13 | SNV | Missense_Mutation | c.308N>C | p.Arg103Pro | p.R103P | Q6UX07 | protein_coding | deleterious(0) | probably_damaging(0.918) | TCGA-E9-A1NA-01 | Breast | breast invasive carcinoma | Female | <65 | I/II | Chemotherapy | cyclophosphamide | SD | |
| DHRS13 | deletion | Frame_Shift_Del | c.1018delC | p.His340ThrfsTer23 | p.H340Tfs*23 | Q6UX07 | protein_coding | TCGA-MA-AA42-01 | Cervix | cervical & endocervical cancer | Female | >=65 | I/II | Unknown | Unknown | SD | |||
| DHRS13 | SNV | Missense_Mutation | rs766827886 | c.395N>A | p.Arg132His | p.R132H | Q6UX07 | protein_coding | deleterious(0.03) | benign(0.005) | TCGA-AD-6889-01 | Colorectum | colon adenocarcinoma | Male | >=65 | I/II | Chemotherapy | xeloda | PD |
| DHRS13 | SNV | Missense_Mutation | c.482C>T | p.Ala161Val | p.A161V | Q6UX07 | protein_coding | deleterious(0.04) | benign(0.018) | TCGA-G4-6588-01 | Colorectum | colon adenocarcinoma | Female | <65 | I/II | Unknown | Unknown | SD | |
| DHRS13 | SNV | Missense_Mutation | c.767N>A | p.Arg256Gln | p.R256Q | Q6UX07 | protein_coding | deleterious(0.04) | probably_damaging(0.92) | TCGA-NH-A5IV-01 | Colorectum | colon adenocarcinoma | Female | >=65 | I/II | Unknown | Unknown | SD | |
| DHRS13 | deletion | Frame_Shift_Del | c.1018delC | p.His340ThrfsTer23 | p.H340Tfs*23 | Q6UX07 | protein_coding | TCGA-G4-6588-01 | Colorectum | colon adenocarcinoma | Female | <65 | I/II | Unknown | Unknown | SD | |||
| DHRS13 | SNV | Missense_Mutation | rs201593315 | c.742N>T | p.Arg248Cys | p.R248C | Q6UX07 | protein_coding | tolerated(0.22) | benign(0) | TCGA-AJ-A3BH-01 | Endometrium | uterine corpus endometrioid carcinoma | Female | Unknown | I/II | Unknown | Unknown | SD |
| Page: 1 2 3 |
Top |
Related drugs of malignant transformation related genes |
| Identification of chemicals and drugs interact with genes involved in malignant transfromation |
| (DGIdb 4.0) |
| Entrez ID | Symbol | Category | Interaction Types | Drug Claim Name | Drug Name | PMIDs |
| Page: 1 |

Copyright 2023-Present -The University of Texas Health Science Center at Houston |