
|
|||||
|
 | |
| |
| |
| |
| |
| |
|
Gene: DHRS1 |
Gene summary for DHRS1 |
| Gene information | Species | Human | Gene symbol | DHRS1 | Gene ID | 115817 |
| Gene name | dehydrogenase/reductase 1 | |
| Gene Alias | SDR19C1 | |
| Cytomap | 14q12 | |
| Gene Type | protein-coding | GO ID | GO:0005575 | UniProtAcc | Q96LJ7 |
Top |
Malignant transformation analysis |
| Identification of the aberrant gene expression in precancerous and cancerous lesions by comparing the gene expression of stem-like cells in diseased tissues with normal stem cells |
| Entrez ID | Symbol | Replicates | Species | Organ | Tissue | Adj P-value | Log2FC | Malignancy |
| 115817 | DHRS1 | HTA11_2487_2000001011 | Human | Colorectum | SER | 7.17e-08 | 3.97e-01 | -0.1808 |
| 115817 | DHRS1 | HTA11_1938_2000001011 | Human | Colorectum | AD | 5.73e-05 | 4.43e-01 | -0.0811 |
| 115817 | DHRS1 | HTA11_78_2000001011 | Human | Colorectum | AD | 2.48e-05 | 3.65e-01 | -0.1088 |
| 115817 | DHRS1 | HTA11_347_2000001011 | Human | Colorectum | AD | 1.54e-19 | 5.53e-01 | -0.1954 |
| 115817 | DHRS1 | HTA11_411_2000001011 | Human | Colorectum | SER | 2.79e-04 | 6.53e-01 | -0.2602 |
| 115817 | DHRS1 | HTA11_83_2000001011 | Human | Colorectum | SER | 2.75e-04 | 4.22e-01 | -0.1526 |
| 115817 | DHRS1 | HTA11_696_2000001011 | Human | Colorectum | AD | 7.36e-11 | 4.67e-01 | -0.1464 |
| 115817 | DHRS1 | HTA11_866_2000001011 | Human | Colorectum | AD | 1.13e-04 | 2.28e-01 | -0.1001 |
| 115817 | DHRS1 | HTA11_1391_2000001011 | Human | Colorectum | AD | 2.15e-13 | 5.22e-01 | -0.059 |
| 115817 | DHRS1 | HTA11_2992_2000001011 | Human | Colorectum | SER | 3.93e-04 | 4.61e-01 | -0.1706 |
| 115817 | DHRS1 | HTA11_5212_2000001011 | Human | Colorectum | AD | 1.18e-08 | 6.19e-01 | -0.2061 |
| 115817 | DHRS1 | HTA11_10623_2000001011 | Human | Colorectum | AD | 6.67e-04 | 3.39e-01 | -0.0177 |
| 115817 | DHRS1 | HTA11_7696_3000711011 | Human | Colorectum | AD | 6.72e-04 | 2.03e-01 | 0.0674 |
| 115817 | DHRS1 | HTA11_99999970781_79442 | Human | Colorectum | MSS | 1.43e-02 | 2.56e-01 | 0.294 |
| 115817 | DHRS1 | HTA11_99999971662_82457 | Human | Colorectum | MSS | 2.20e-10 | 3.70e-01 | 0.3859 |
| 115817 | DHRS1 | HTA11_99999974143_84620 | Human | Colorectum | MSS | 3.42e-03 | 2.42e-01 | 0.3005 |
| 115817 | DHRS1 | LZE5T | Human | Esophagus | ESCC | 6.39e-04 | 2.19e-01 | 0.0514 |
| 115817 | DHRS1 | LZE7T | Human | Esophagus | ESCC | 5.45e-04 | 7.88e-02 | 0.0667 |
| 115817 | DHRS1 | LZE24T | Human | Esophagus | ESCC | 1.74e-11 | 2.68e-01 | 0.0596 |
| 115817 | DHRS1 | LZE21T | Human | Esophagus | ESCC | 4.08e-05 | 1.95e-01 | 0.0655 |
| Page: 1 2 3 4 5 6 |
| Tissue | Expression Dynamics | Abbreviation |
| Colorectum (GSE201348) | 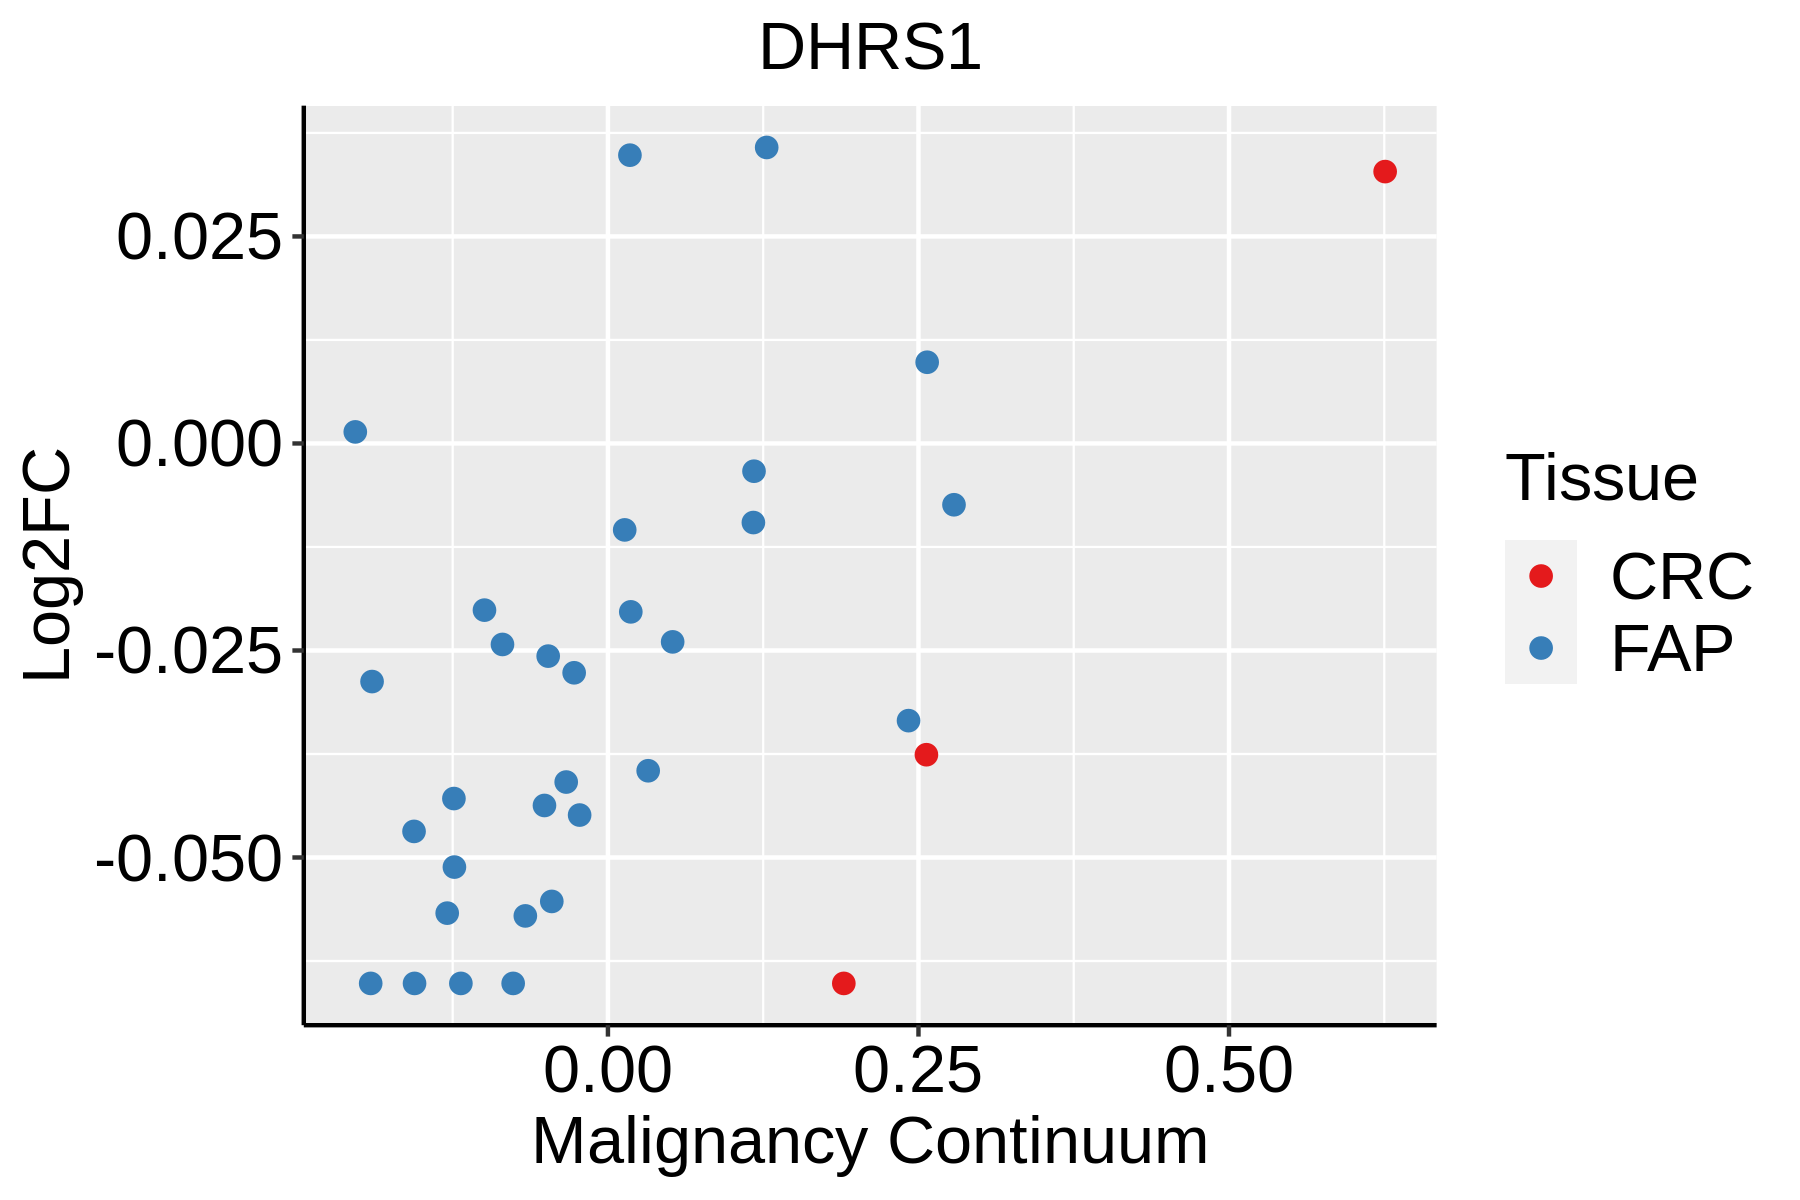 | FAP: Familial adenomatous polyposis |
| CRC: Colorectal cancer | ||
| Colorectum (HTA11) |  | AD: Adenomas |
| SER: Sessile serrated lesions | ||
| MSI-H: Microsatellite-high colorectal cancer | ||
| MSS: Microsatellite stable colorectal cancer | ||
| Esophagus | 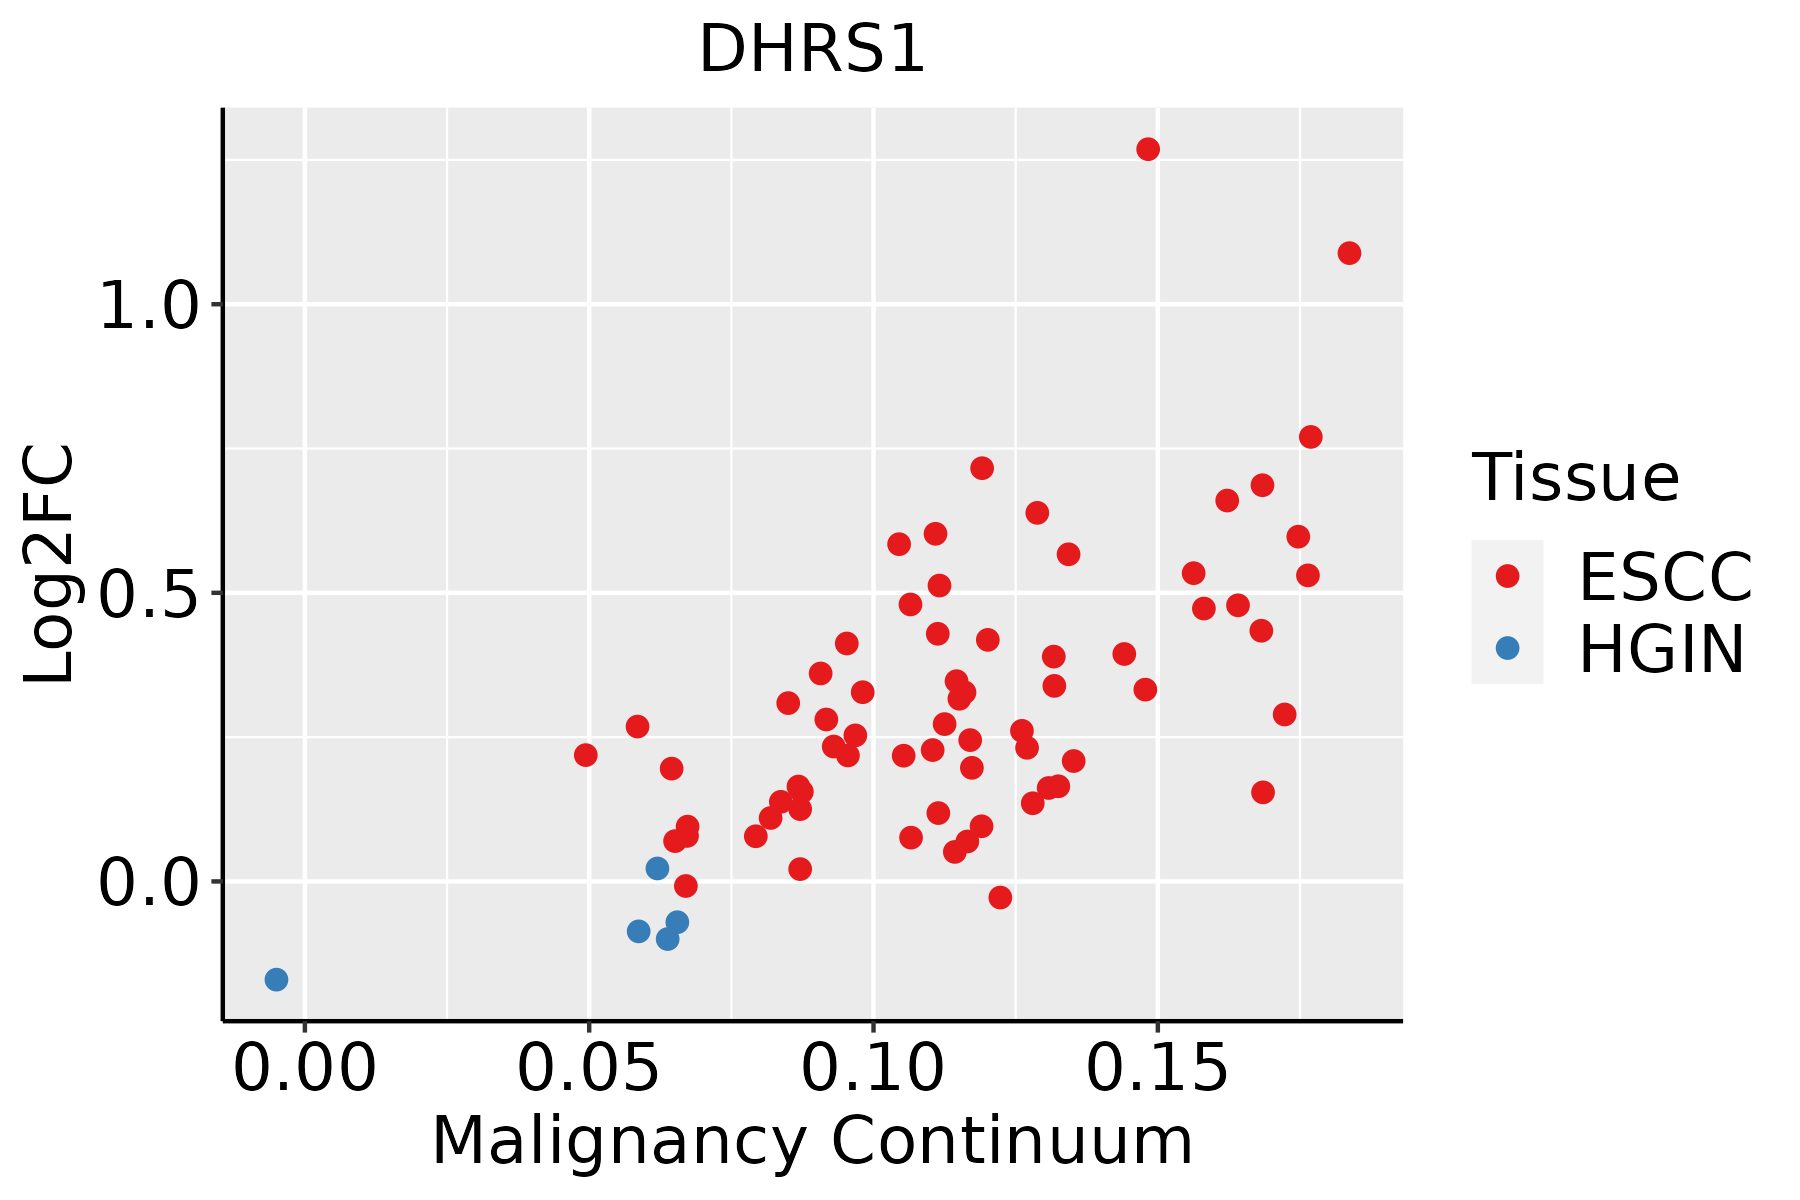 | ESCC: Esophageal squamous cell carcinoma |
| HGIN: High-grade intraepithelial neoplasias | ||
| LGIN: Low-grade intraepithelial neoplasias | ||
| Oral Cavity | 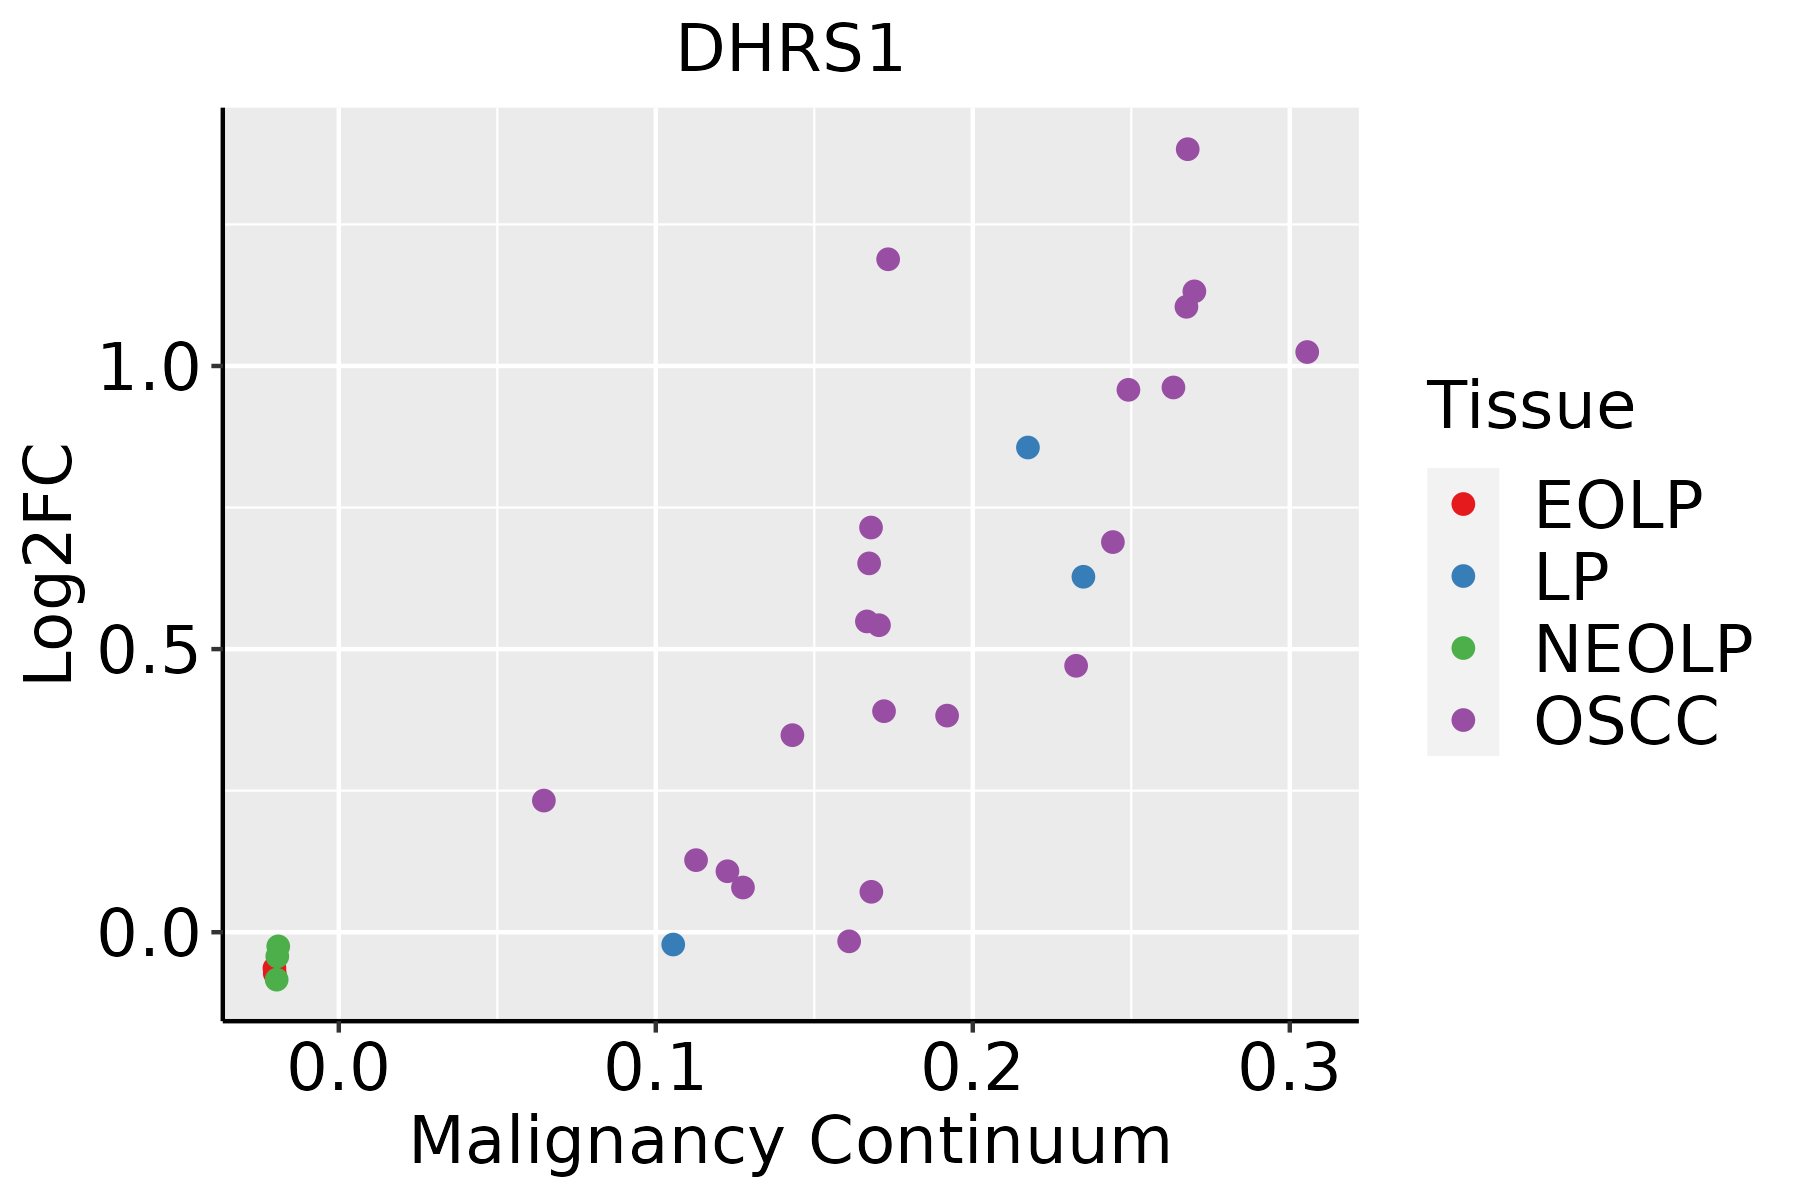 | EOLP: Erosive Oral lichen planus |
| LP: leukoplakia | ||
| NEOLP: Non-erosive oral lichen planus | ||
| OSCC: Oral squamous cell carcinoma | ||
| Skin | 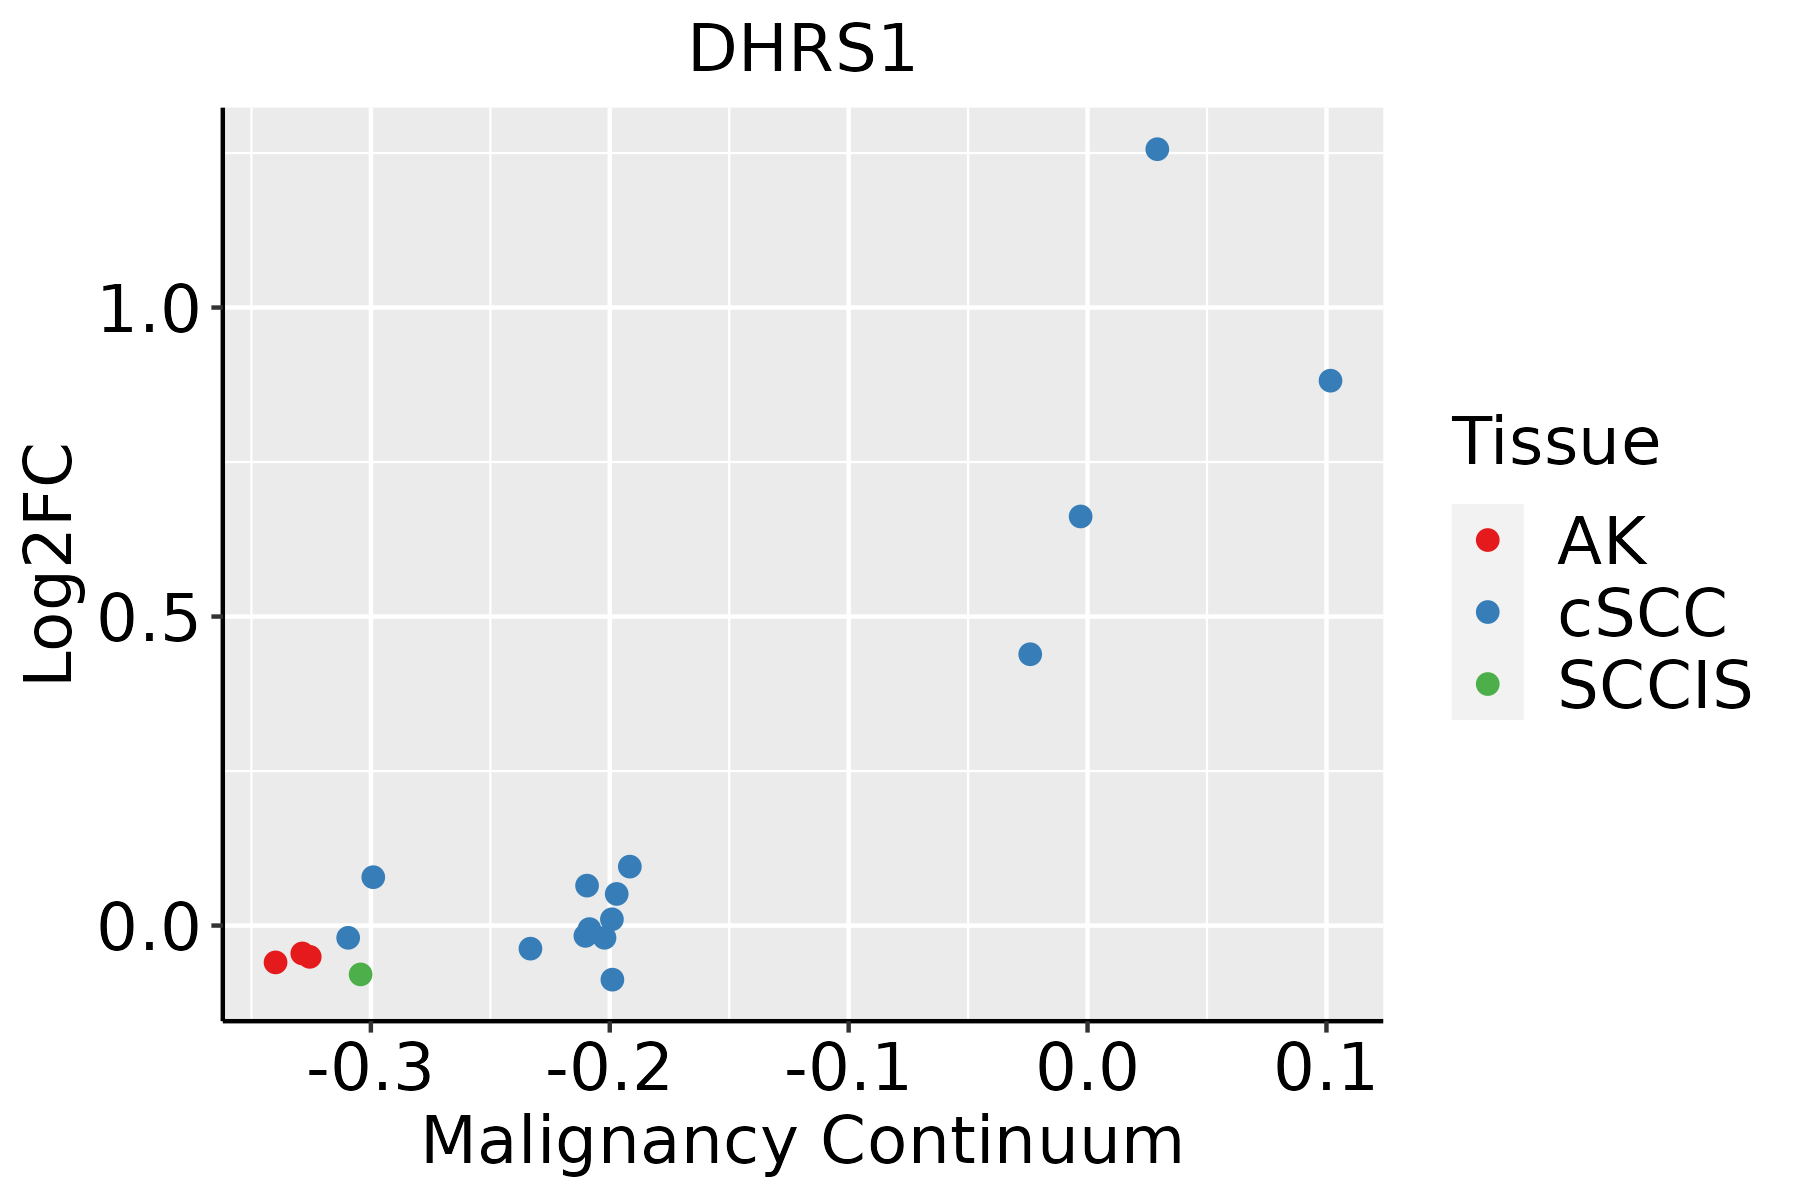 | AK: Actinic keratosis |
| cSCC: Cutaneous squamous cell carcinoma | ||
| SCCIS:squamous cell carcinoma in situ | ||
| Thyroid |  | ATC: Anaplastic thyroid cancer |
| HT: Hashimoto's thyroiditis | ||
| PTC: Papillary thyroid cancer |
| ∗log2FC in expression of this searched gene in stem-like cells from each diseased tissue sample relative to stem-like cells in normal samples in each tissue plotted against the malignancy continuum. Samples are colored based on if they are from different disease stage. |
Top |
Malignant transformation related pathway analysis |
| Find out the enriched GO biological processes and KEGG pathways involved in transition from healthy to precancer to cancer |
| Tissue | Disease Stage | Enriched GO biological Processes |
| Colorectum | AD |  |
| Colorectum | SER |  |
| Colorectum | MSS |  |
| Colorectum | MSI-H |  |
| Colorectum | FAP |  |
| ∗Top 15 enriched GO BP terms are showed in the bar plot of each disease state in each tissue. Each row represents a significant GO biological process which is colored according to the -log10(p.adjust). |
| Page: 1 2 3 4 5 6 7 8 9 |
| GO ID | Tissue | Disease Stage | Description | Gene Ratio | Bg Ratio | pvalue | p.adjust | Count |
| GO:0008202 | Colorectum | AD | steroid metabolic process | 85/3918 | 319/18723 | 8.07e-03 | 4.75e-02 | 85 |
| GO:00060668 | Esophagus | ESCC | alcohol metabolic process | 202/8552 | 353/18723 | 7.32e-06 | 7.26e-05 | 202 |
| GO:00060818 | Esophagus | ESCC | cellular aldehyde metabolic process | 40/8552 | 60/18723 | 8.30e-04 | 4.28e-03 | 40 |
| GO:00060667 | Oral cavity | OSCC | alcohol metabolic process | 179/7305 | 353/18723 | 4.54e-06 | 5.21e-05 | 179 |
| GO:00060817 | Oral cavity | OSCC | cellular aldehyde metabolic process | 36/7305 | 60/18723 | 7.94e-04 | 4.27e-03 | 36 |
| GO:00067203 | Oral cavity | OSCC | isoprenoid metabolic process | 59/7305 | 116/18723 | 6.18e-03 | 2.33e-02 | 59 |
| GO:000608114 | Oral cavity | LP | cellular aldehyde metabolic process | 26/4623 | 60/18723 | 1.19e-03 | 9.62e-03 | 26 |
| GO:000606613 | Oral cavity | LP | alcohol metabolic process | 111/4623 | 353/18723 | 2.24e-03 | 1.62e-02 | 111 |
| GO:0042445 | Stomach | GC | hormone metabolic process | 29/1159 | 218/18723 | 8.22e-05 | 1.75e-03 | 29 |
| GO:0034754 | Stomach | GC | cellular hormone metabolic process | 19/1159 | 137/18723 | 7.88e-04 | 1.01e-02 | 19 |
| GO:00347541 | Stomach | SIM | cellular hormone metabolic process | 14/708 | 137/18723 | 6.96e-04 | 1.00e-02 | 14 |
| GO:00082021 | Stomach | SIM | steroid metabolic process | 22/708 | 319/18723 | 5.09e-03 | 4.32e-02 | 22 |
| GO:0120178 | Stomach | SIM | steroid hormone biosynthetic process | 6/708 | 43/18723 | 5.29e-03 | 4.41e-02 | 6 |
| GO:0006694 | Stomach | SIM | steroid biosynthetic process | 14/708 | 173/18723 | 6.13e-03 | 4.87e-02 | 14 |
| Page: 1 |
| Pathway ID | Tissue | Disease Stage | Description | Gene Ratio | Bg Ratio | pvalue | p.adjust | qvalue | Count |
| Page: 1 |
Top |
Cell-cell communication analysis |
| Identification of potential cell-cell interactions between two cell types and their ligand-receptor pairs for different disease states |
| Ligand | Receptor | LRpair | Pathway | Tissue | Disease Stage |
| Page: 1 |
Top |
Single-cell gene regulatory network inference analysis |
| Find out the significant the regulons (TFs) and the target genes of each regulon across cell types for different disease states |
| TF | Cell Type | Tissue | Disease Stage | Target Gene | RSS | Regulon Activity |
| ∗The dot plots of a searched regulon are shown for all cell subpopulations in each disease state of each tissue based on the regulon specific score inferred using pySCENIC and by calculating the average expression. |
| Page: 1 |
Top |
Somatic mutation of malignant transformation related genes |
| Annotation of somatic variants for genes involved in malignant transformation |
| Hugo Symbol | Variant Class | Variant Classification | dbSNP RS | HGVSc | HGVSp | HGVSp Short | SWISSPROT | BIOTYPE | SIFT | PolyPhen | Tumor Sample Barcode | Tissue | Histology | Sex | Age | Stage | Therapy Types | Drugs | Outcome |
| DHRS1 | SNV | Missense_Mutation | rs766291638 | c.352N>A | p.Asp118Asn | p.D118N | Q96LJ7 | protein_coding | tolerated(0.08) | benign(0.105) | TCGA-DR-A0ZM-01 | Cervix | cervical & endocervical cancer | Female | <65 | III/IV | Unspecific | Cisplatin | SD |
| DHRS1 | SNV | Missense_Mutation | rs559917499 | c.781N>T | p.Arg261Cys | p.R261C | Q96LJ7 | protein_coding | deleterious(0) | benign(0.085) | TCGA-AA-A02R-01 | Colorectum | colon adenocarcinoma | Female | >=65 | I/II | Unknown | Unknown | PD |
| DHRS1 | SNV | Missense_Mutation | rs372828362 | c.824N>G | p.Tyr275Cys | p.Y275C | Q96LJ7 | protein_coding | deleterious(0.02) | probably_damaging(0.94) | TCGA-D5-6928-01 | Colorectum | colon adenocarcinoma | Male | >=65 | I/II | Unknown | Unknown | SD |
| DHRS1 | SNV | Missense_Mutation | c.430G>T | p.Gly144Trp | p.G144W | Q96LJ7 | protein_coding | deleterious(0) | probably_damaging(1) | TCGA-DM-A1DA-01 | Colorectum | colon adenocarcinoma | Female | >=65 | III/IV | Unknown | Unknown | SD | |
| DHRS1 | SNV | Missense_Mutation | c.664N>C | p.Ala222Pro | p.A222P | Q96LJ7 | protein_coding | tolerated(0.24) | benign(0) | TCGA-G4-6304-01 | Colorectum | colon adenocarcinoma | Female | >=65 | I/II | Chemotherapy | fluorouracil | PD | |
| DHRS1 | SNV | Missense_Mutation | rs773895645 | c.853G>A | p.Val285Met | p.V285M | Q96LJ7 | protein_coding | tolerated(0.33) | benign(0.015) | TCGA-A5-A0G2-01 | Endometrium | uterine corpus endometrioid carcinoma | Female | <65 | III/IV | Unknown | Unknown | SD |
| DHRS1 | SNV | Missense_Mutation | novel | c.259G>T | p.Asp87Tyr | p.D87Y | Q96LJ7 | protein_coding | deleterious(0) | probably_damaging(0.999) | TCGA-AP-A051-01 | Endometrium | uterine corpus endometrioid carcinoma | Female | >=65 | I/II | Unknown | Unknown | SD |
| DHRS1 | SNV | Missense_Mutation | novel | c.284C>T | p.Ala95Val | p.A95V | Q96LJ7 | protein_coding | deleterious(0.01) | benign(0.042) | TCGA-AX-A1CE-01 | Endometrium | uterine corpus endometrioid carcinoma | Female | <65 | I/II | Unspecific | Paclitaxel | SD |
| DHRS1 | SNV | Missense_Mutation | rs776201819 | c.463N>A | p.Leu155Met | p.L155M | Q96LJ7 | protein_coding | tolerated(0.05) | benign(0.316) | TCGA-B5-A3FA-01 | Endometrium | uterine corpus endometrioid carcinoma | Female | >=65 | I/II | Unknown | Unknown | SD |
| DHRS1 | SNV | Missense_Mutation | rs779104077 | c.898N>T | p.Arg300Cys | p.R300C | Q96LJ7 | protein_coding | deleterious(0.02) | possibly_damaging(0.871) | TCGA-BS-A0UV-01 | Endometrium | uterine corpus endometrioid carcinoma | Female | <65 | III/IV | Unknown | Unknown | SD |
| Page: 1 2 |
Top |
Related drugs of malignant transformation related genes |
| Identification of chemicals and drugs interact with genes involved in malignant transfromation |
| (DGIdb 4.0) |
| Entrez ID | Symbol | Category | Interaction Types | Drug Claim Name | Drug Name | PMIDs |
| Page: 1 |

Copyright 2023-Present -The University of Texas Health Science Center at Houston |