Schematic overview of the cellular and molecular mechanisms involved in the cancer progression, including the proposed cellular and molecular mechanisms in cancer cells trajectory. AT1: alveolar type 1 cells; AT2: alveolar type 2 cells; AAH: atypical adenomatous hyperplasia; AIS: adenocarcinoma in situ; MIA: minimally invasive adenocarcinoma; IA: invasive adenocarcinoma; EMT: epithelial-mesenchymal transition

Home

Download

Statistics

Help

Contact

Center for Computational Systems Medicine
leaf

Gene summary

leaf

Malignant transformation analysis

leaf

Malignant transformation related pathway analysis

leaf

Cell-cell communication analysis

leaf

Single-cell gene regulatory network inference analysis

leaf

Somatic mutation of malignant transformation related genes

leaf

Related drugs of malignant transformation related genes

Gene: DHPS

Gene summary for DHPS

check button Gene summary.

Gene informationSpeciesHuman
Gene symbol

DHPS

Gene ID

1725

Gene namedeoxyhypusine synthase
Gene AliasDHS
Cytomap19p13.13
Gene Typeprotein-coding
GO ID

GO:0006412

UniProtAcc

P49366


Top

Malignant transformation analysis

check button Identification of the aberrant gene expression in precancerous and cancerous lesions by comparing the gene expression of stem-like cells in diseased tissues with normal stem cells
check button Malignant transformation involving gene list.
Entrez IDSymbolReplicatesSpeciesOrganTissueAdj P-valueLog2FCMalignancy
1725DHPSLZE4THumanEsophagusESCC1.35e-143.25e-010.0811
1725DHPSLZE7THumanEsophagusESCC5.10e-176.30e-010.0667
1725DHPSLZE8THumanEsophagusESCC1.84e-031.65e-010.067
1725DHPSLZE20THumanEsophagusESCC6.08e-053.41e-010.0662
1725DHPSLZE22THumanEsophagusESCC1.46e-063.58e-010.068
1725DHPSLZE24THumanEsophagusESCC4.71e-257.70e-010.0596
1725DHPSLZE6THumanEsophagusESCC2.98e-116.73e-010.0845
1725DHPSP1T-EHumanEsophagusESCC7.36e-158.12e-010.0875
1725DHPSP2T-EHumanEsophagusESCC6.46e-264.85e-010.1177
1725DHPSP4T-EHumanEsophagusESCC3.49e-339.13e-010.1323
1725DHPSP5T-EHumanEsophagusESCC5.13e-276.21e-010.1327
1725DHPSP8T-EHumanEsophagusESCC1.58e-255.18e-010.0889
1725DHPSP9T-EHumanEsophagusESCC3.11e-287.76e-010.1131
1725DHPSP10T-EHumanEsophagusESCC1.44e-571.05e+000.116
1725DHPSP11T-EHumanEsophagusESCC6.92e-157.33e-010.1426
1725DHPSP12T-EHumanEsophagusESCC5.25e-469.27e-010.1122
1725DHPSP15T-EHumanEsophagusESCC4.11e-305.62e-010.1149
1725DHPSP16T-EHumanEsophagusESCC5.59e-367.52e-010.1153
1725DHPSP17T-EHumanEsophagusESCC2.90e-207.82e-010.1278
1725DHPSP19T-EHumanEsophagusESCC1.14e-141.13e+000.1662
Page: 1 2 3 4 5 6 

check button Transcriptomic changes along malignancy continuum.
TissueExpression DynamicsAbbreviation
EsophagusThe image shows the transcriptomic changes along malignancy continuum.log2FC in expression of this searched gene in stem-like cells from each diseased tissue sample relative to stem-like cells in normal samples in each tissue plotted against the malignancy continuum. Samples are colored based on if they are from different disease stage.
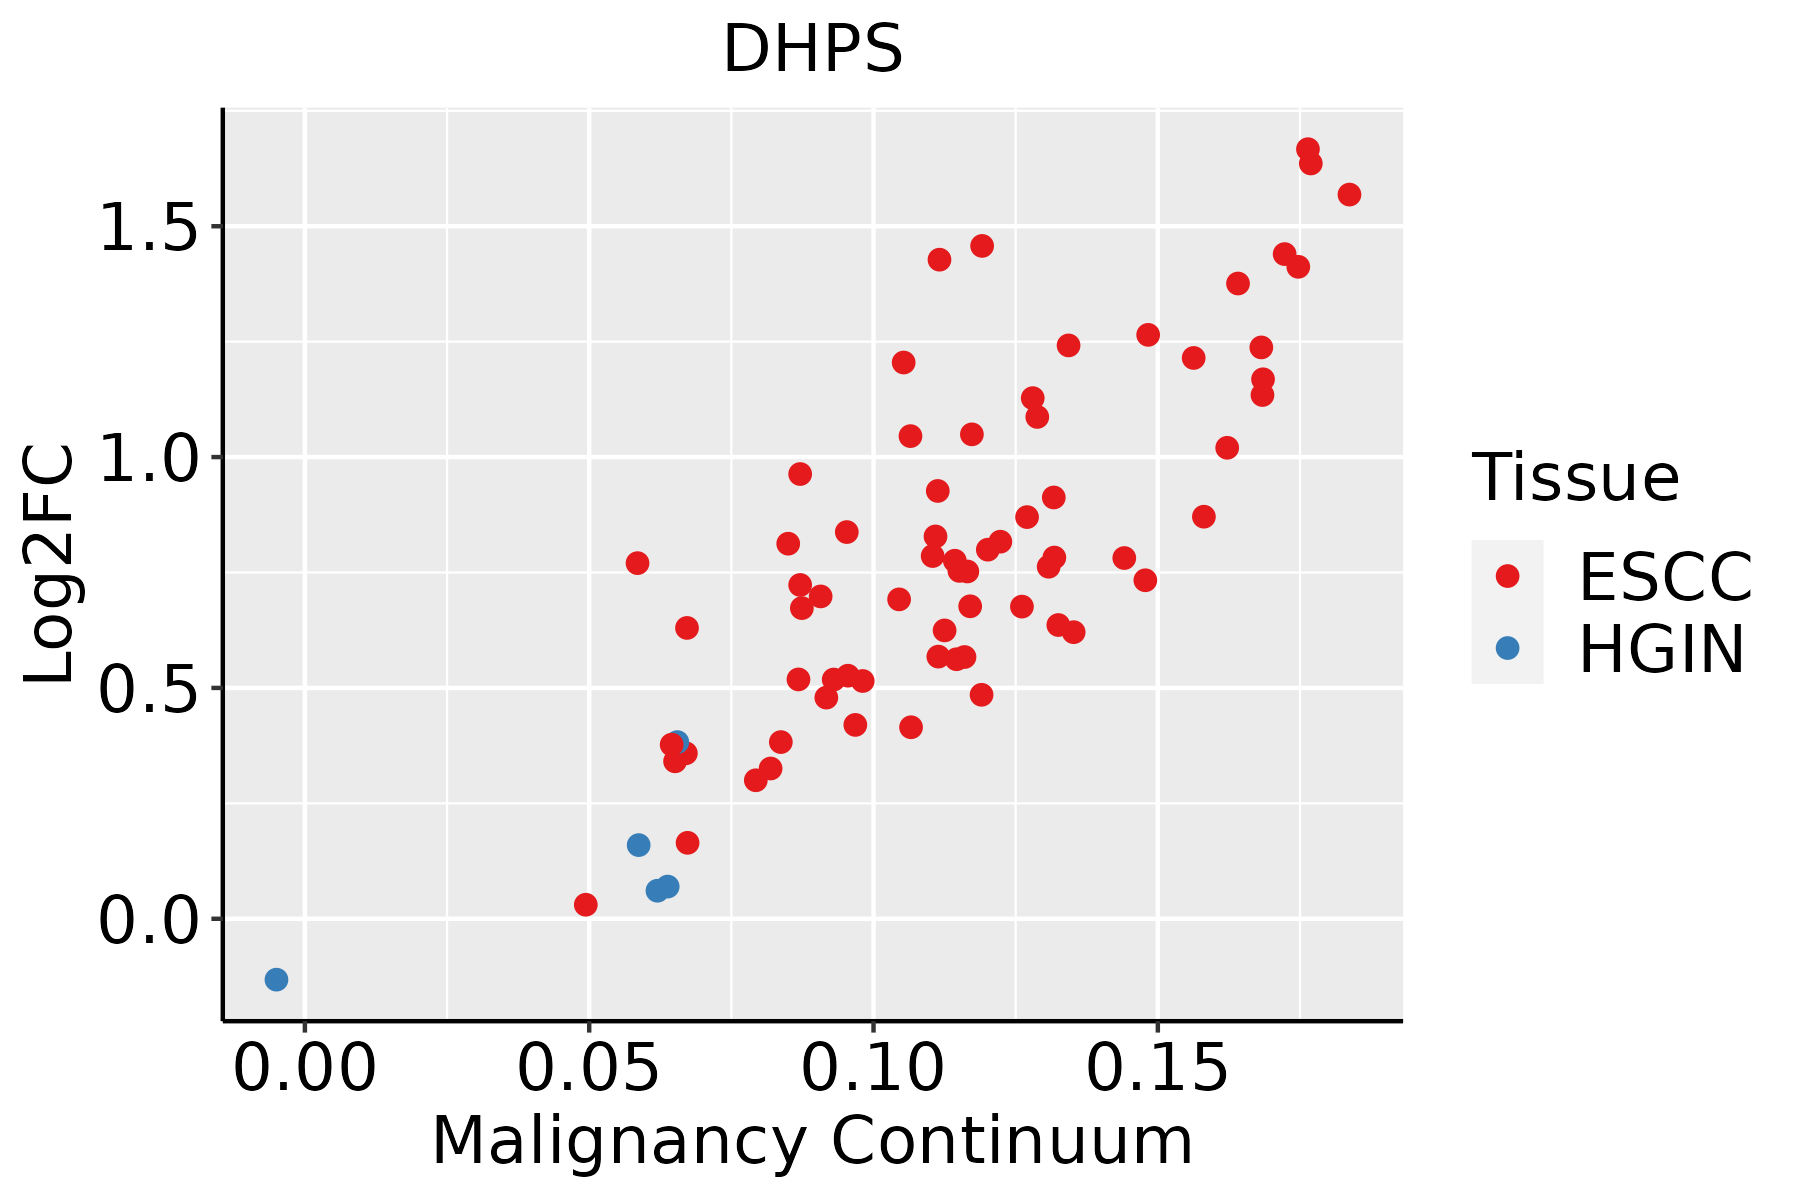
ESCC: Esophageal squamous cell carcinoma
HGIN: High-grade intraepithelial neoplasias
LGIN: Low-grade intraepithelial neoplasias
LiverThe image shows the transcriptomic changes along malignancy continuum.log2FC in expression of this searched gene in stem-like cells from each diseased tissue sample relative to stem-like cells in normal samples in each tissue plotted against the malignancy continuum. Samples are colored based on if they are from different disease stage.
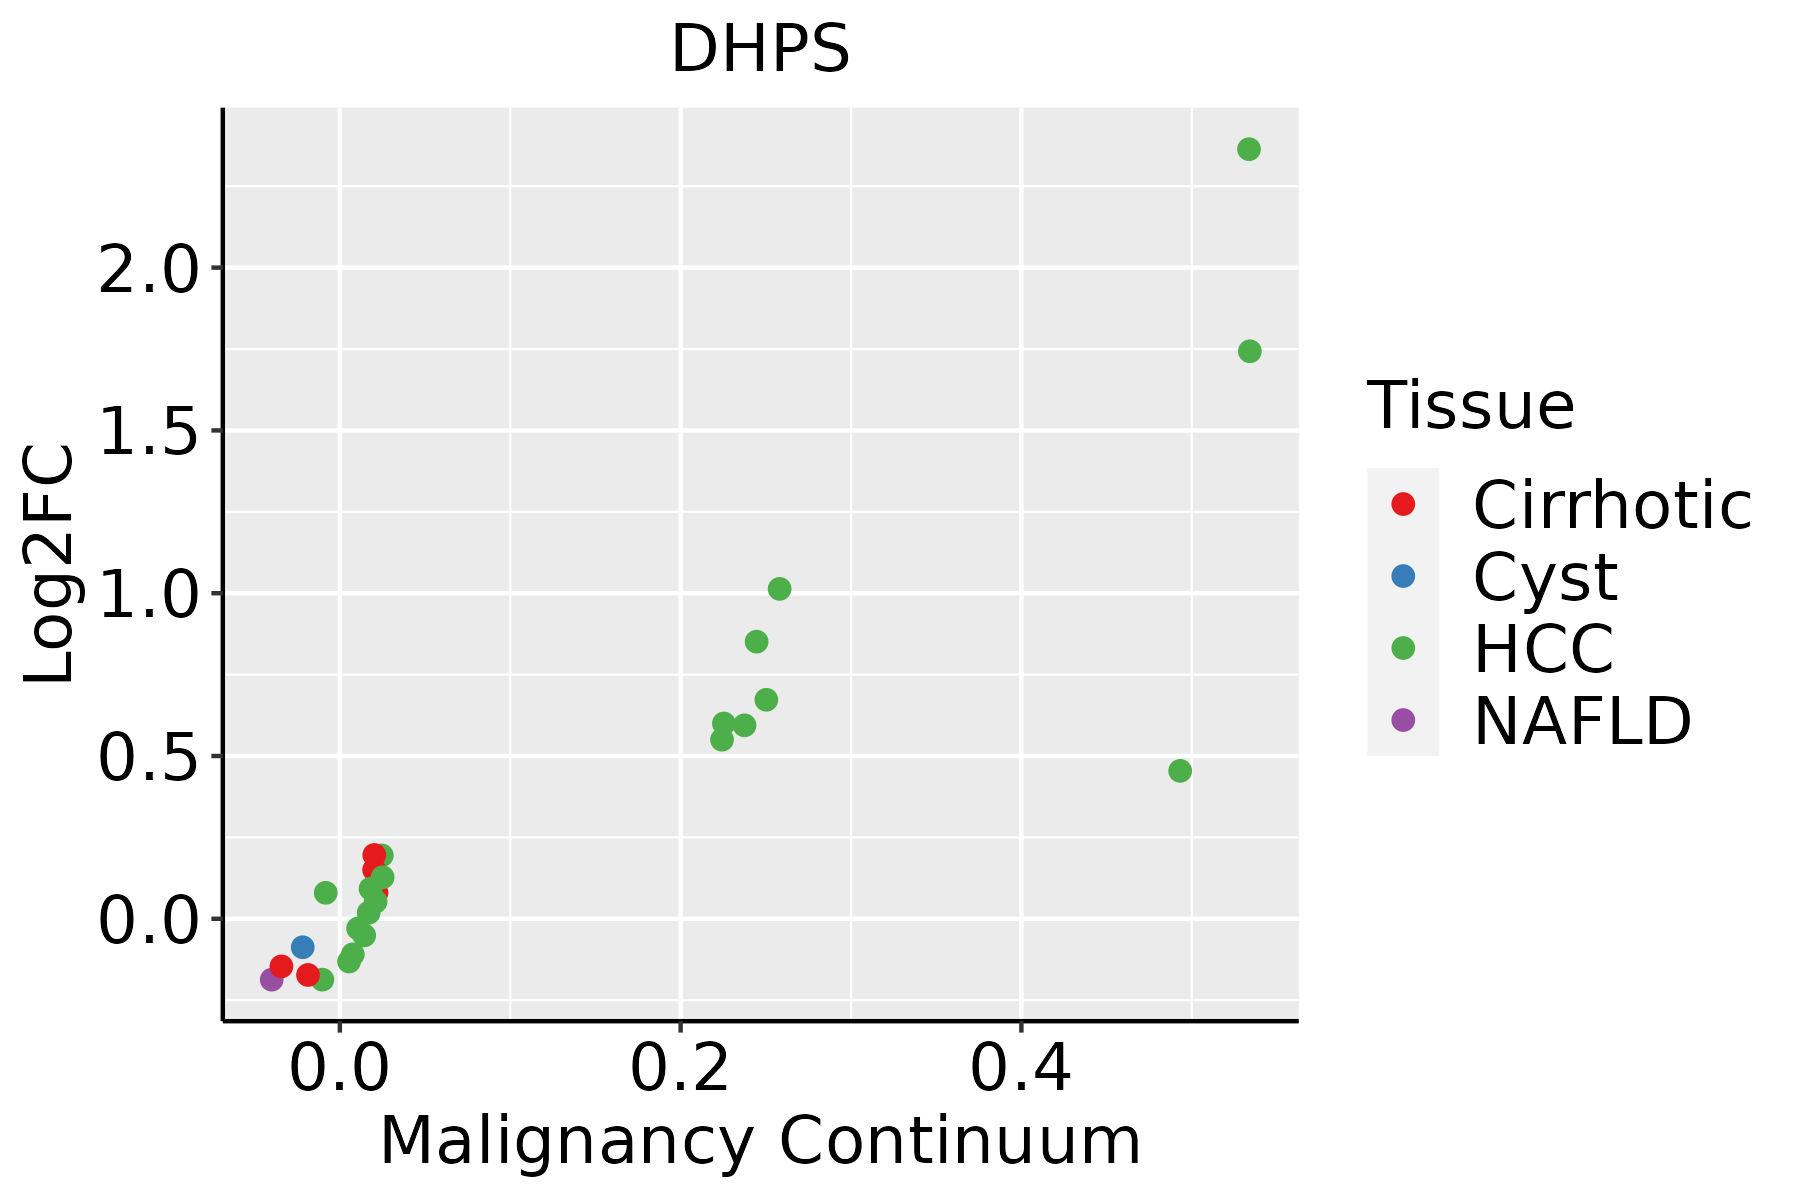
HCC: Hepatocellular carcinoma
NAFLD: Non-alcoholic fatty liver disease
Oral CavityThe image shows the transcriptomic changes along malignancy continuum.log2FC in expression of this searched gene in stem-like cells from each diseased tissue sample relative to stem-like cells in normal samples in each tissue plotted against the malignancy continuum. Samples are colored based on if they are from different disease stage.
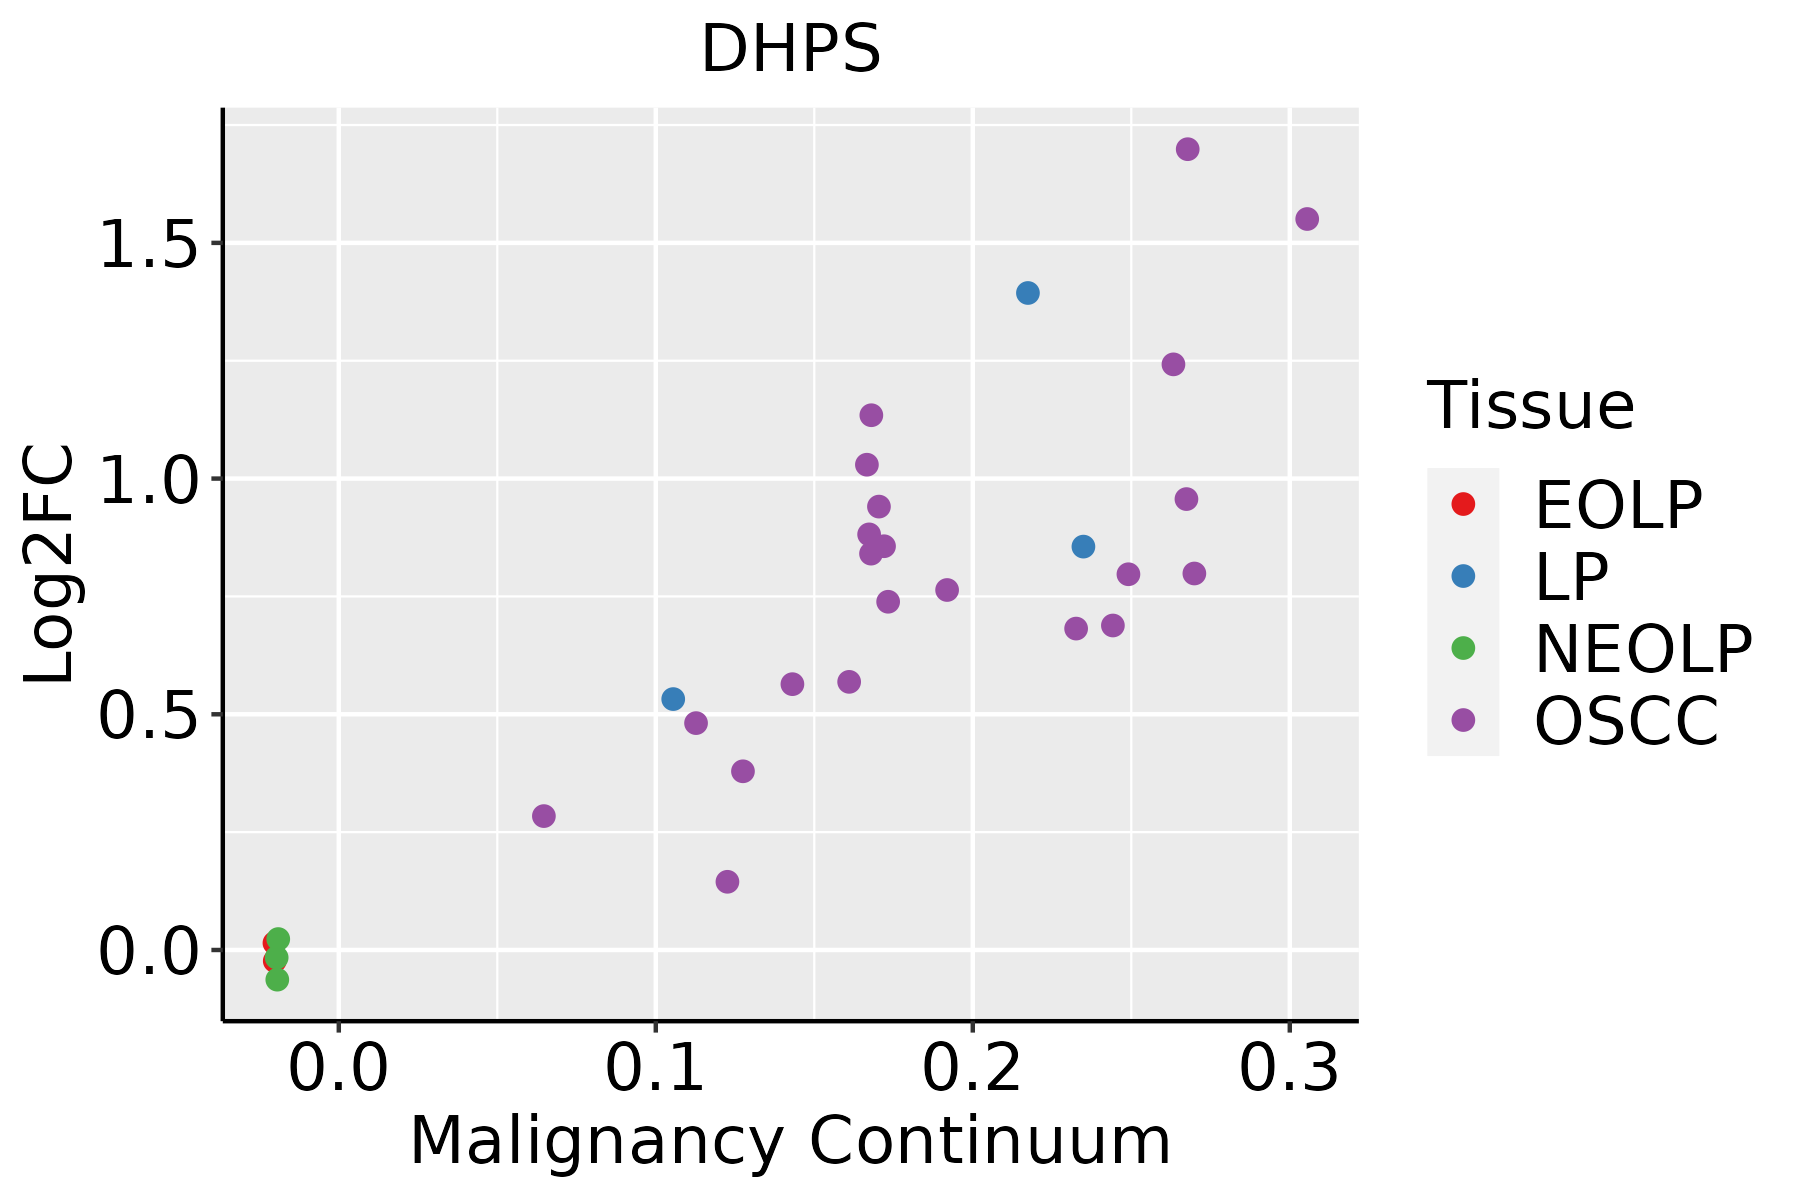
EOLP: Erosive Oral lichen planus
LP: leukoplakia
NEOLP: Non-erosive oral lichen planus
OSCC: Oral squamous cell carcinoma
SkinThe image shows the transcriptomic changes along malignancy continuum.log2FC in expression of this searched gene in stem-like cells from each diseased tissue sample relative to stem-like cells in normal samples in each tissue plotted against the malignancy continuum. Samples are colored based on if they are from different disease stage.
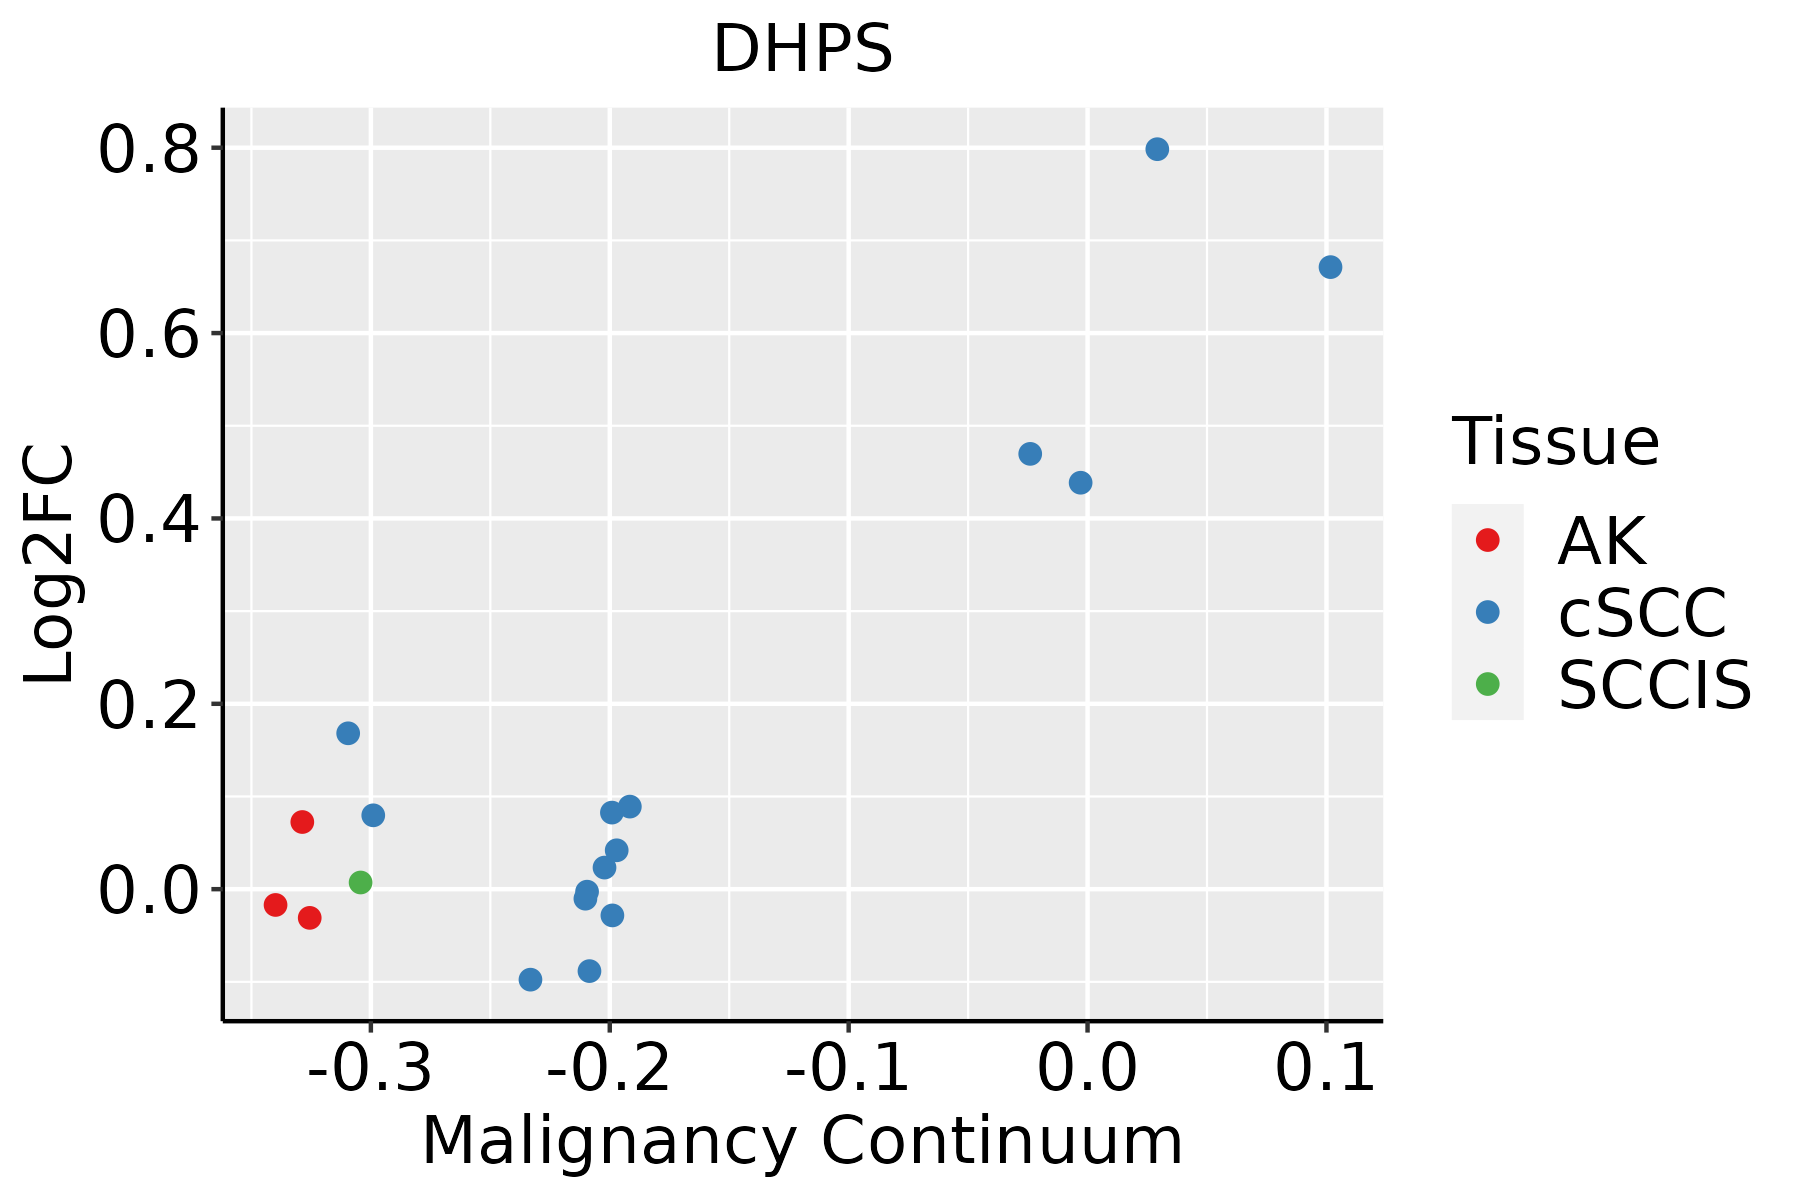
AK: Actinic keratosis
cSCC: Cutaneous squamous cell carcinoma
SCCIS:squamous cell carcinoma in situ
ThyroidThe image shows the transcriptomic changes along malignancy continuum.log2FC in expression of this searched gene in stem-like cells from each diseased tissue sample relative to stem-like cells in normal samples in each tissue plotted against the malignancy continuum. Samples are colored based on if they are from different disease stage.
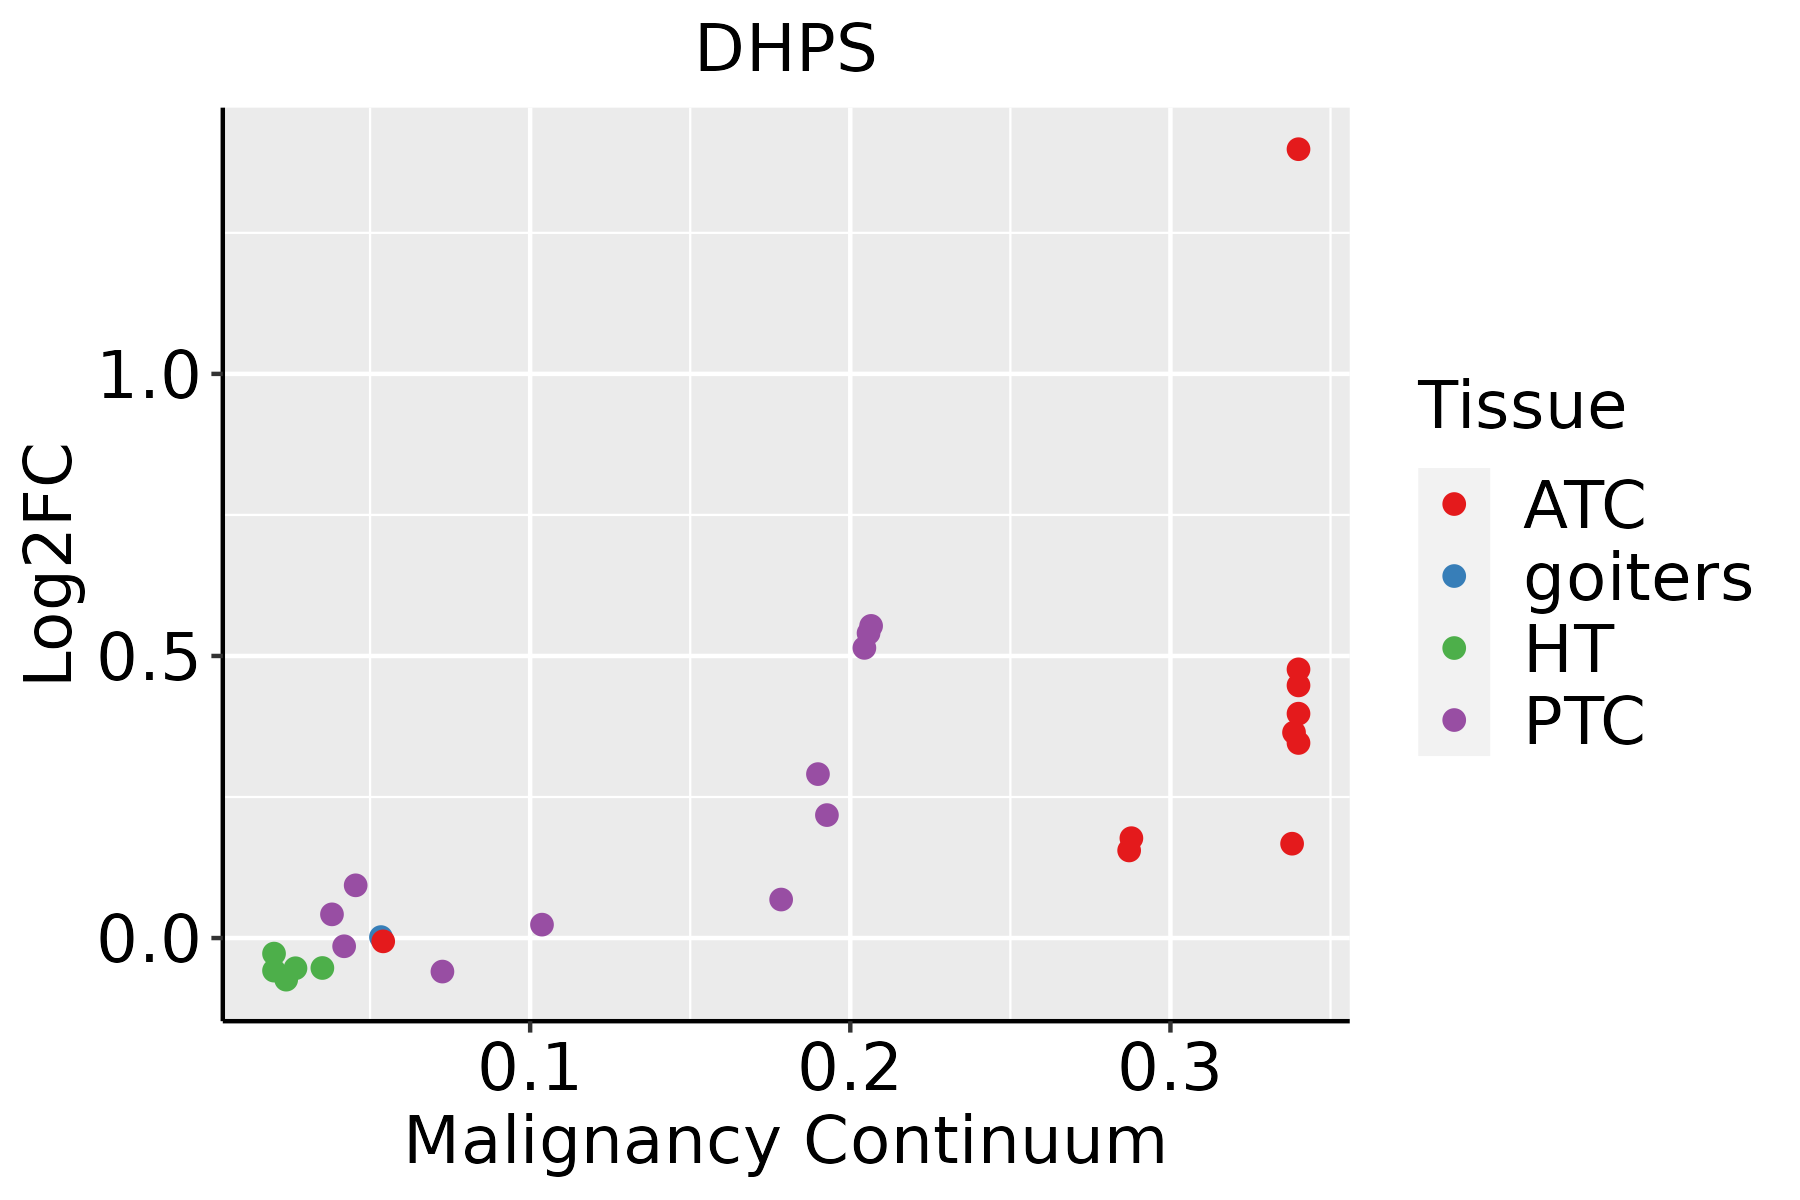
ATC: Anaplastic thyroid cancer
HT: Hashimoto's thyroiditis
PTC: Papillary thyroid cancer
∗log2FC in expression of this searched gene in stem-like cells from each diseased tissue sample relative to stem-like cells in normal samples in each tissue plotted against the malignancy continuum. Samples are colored based on if they are from different disease stage.

Top

Malignant transformation related pathway analysis

check buttonFind out the enriched GO biological processes and KEGG pathways involved in transition from healthy to precancer to cancer
check button Figure of enriched GO biological processes.
TissueDisease StageEnriched GO biological Processes
ColorectumADGO analysis - Figure of enriched GO biological processes: Top 15 enriched GO BP terms are showed in the bar plot of each disease state in each tissue. Each row represents a significant GO biological process which is colored according to the -log10(p.adjust).
ColorectumSERGO analysis - Figure of enriched GO biological processes: Top 15 enriched GO BP terms are showed in the bar plot of each disease state in each tissue. Each row represents a significant GO biological process which is colored according to the -log10(p.adjust).
ColorectumMSSGO analysis - Figure of enriched GO biological processes: Top 15 enriched GO BP terms are showed in the bar plot of each disease state in each tissue. Each row represents a significant GO biological process which is colored according to the -log10(p.adjust).
ColorectumMSI-HGO analysis - Figure of enriched GO biological processes: Top 15 enriched GO BP terms are showed in the bar plot of each disease state in each tissue. Each row represents a significant GO biological process which is colored according to the -log10(p.adjust).
ColorectumFAPGO analysis - Figure of enriched GO biological processes: Top 15 enriched GO BP terms are showed in the bar plot of each disease state in each tissue. Each row represents a significant GO biological process which is colored according to the -log10(p.adjust).
∗Top 15 enriched GO BP terms are showed in the bar plot of each disease state in each tissue. Each row represents a significant GO biological process which is colored according to the -log10(p.adjust).
Page: 1 2 3 4 5 6 7 8 9 

check button Enriched GO biological processes.
GO IDTissueDisease StageDescriptionGene RatioBg Ratiopvaluep.adjustCount
GO:001820514EsophagusESCCpeptidyl-lysine modification259/8552376/187233.90e-205.26e-18259
GO:005160418EsophagusESCCprotein maturation189/8552294/187237.64e-112.39e-09189
GO:00516046LiverCirrhoticprotein maturation121/4634294/187233.54e-101.68e-08121
GO:00182051LiverCirrhoticpeptidyl-lysine modification134/4634376/187231.29e-062.59e-05134
GO:0006595LiverCirrhoticpolyamine metabolic process12/463418/187232.07e-041.90e-0312
GO:0044106LiverCirrhoticcellular amine metabolic process43/4634113/187231.15e-037.83e-0343
GO:0006576LiverCirrhoticcellular biogenic amine metabolic process38/4634101/187232.72e-031.59e-0238
GO:0009308LiverCirrhoticamine metabolic process43/4634118/187233.03e-031.72e-0243
GO:00182052LiverHCCpeptidyl-lysine modification230/7958376/187231.51e-138.32e-12230
GO:005160412LiverHCCprotein maturation171/7958294/187233.80e-088.30e-07171
GO:00065951LiverHCCpolyamine metabolic process14/795818/187232.57e-031.23e-0214
GO:00182056Oral cavityOSCCpeptidyl-lysine modification216/7305376/187232.32e-131.16e-11216
GO:005160410Oral cavityOSCCprotein maturation170/7305294/187233.97e-111.28e-09170
GO:00065954Oral cavityOSCCpolyamine metabolic process13/730518/187234.45e-031.79e-0213
GO:005160416Oral cavityLPprotein maturation122/4623294/187231.37e-107.72e-09122
GO:001820513Oral cavityLPpeptidyl-lysine modification136/4623376/187233.64e-071.06e-05136
GO:000659512Oral cavityLPpolyamine metabolic process13/462318/187232.94e-054.58e-0413
GO:005160419SkincSCCprotein maturation117/4864294/187231.27e-072.93e-06117
GO:001820515SkincSCCpeptidyl-lysine modification137/4864376/187234.09e-066.09e-05137
GO:000659513SkincSCCpolyamine metabolic process11/486418/187231.74e-031.06e-0211
Page: 1 2 

check button Enriched KEGG pathways.
Pathway IDTissueDisease StageDescriptionGene RatioBg Ratiopvaluep.adjustqvalueCount
Page: 1 

Top

Cell-cell communication analysis

check buttonIdentification of potential cell-cell interactions between two cell types and their ligand-receptor pairs for different disease states
LigandReceptorLRpairPathwayTissueDisease Stage
Page: 1 

Top

Single-cell gene regulatory network inference analysis

check buttonFind out the significant the regulons (TFs) and the target genes of each regulon across cell types for different disease states
TFCell TypeTissueDisease StageTarget GeneRSSRegulon Activity
∗The dot plots of a searched regulon are shown for all cell subpopulations in each disease state of each tissue based on the regulon specific score inferred using pySCENIC and by calculating the average expression.
Page: 1 

Top

Somatic mutation of malignant transformation related genes

check buttonAnnotation of somatic variants for genes involved in malignant transformation
Hugo SymbolVariant ClassVariant ClassificationdbSNP RSHGVScHGVSpHGVSp ShortSWISSPROTBIOTYPESIFTPolyPhenTumor Sample BarcodeTissueHistologySexAgeStageTherapy TypesDrugsOutcome
DHPSSNVMissense_Mutationc.108N>Gp.Phe36Leup.F36LP49366protein_codingdeleterious(0.02)benign(0.124)TCGA-A2-A0EY-01Breastbreast invasive carcinomaFemale<65I/IIChemotherapyadriamycinSD
DHPSSNVMissense_Mutationrs1050609c.254N>Tp.Ala85Valp.A85VP49366protein_codingtolerated(0.53)benign(0.005)TCGA-AC-A23H-01Breastbreast invasive carcinomaFemale>=65I/IIUnknownUnknownPD
DHPSSNVMissense_Mutationc.147N>Gp.Phe49Leup.F49LP49366protein_codingtolerated(0.28)benign(0)TCGA-D8-A1JA-01Breastbreast invasive carcinomaFemale<65III/IVChemotherapyadriamycinPD
DHPSSNVMissense_Mutationrs777080975c.374N>Gp.Val125Glyp.V125GP49366protein_codingdeleterious(0)probably_damaging(0.996)TCGA-E9-A1RE-01Breastbreast invasive carcinomaFemale>=65III/IVHormone TherapytamoxiphenSD
DHPSinsertionIn_Frame_Insnovelc.524_525insGCCTACTTACTCTTTCTTTTTTACGAGACAGGGTCTCATTCTGTTp.Asn175delinsLysProThrTyrSerPhePhePheThrArgGlnGlyLeuIleLeuPhep.N175delinsKPTYSFFFTRQGLILFP49366protein_codingTCGA-A8-A06P-01Breastbreast invasive carcinomaFemale<65III/IVUnspecificSD
DHPSSNVMissense_Mutationnovelc.1066N>Ap.Ala356Thrp.A356TP49366protein_codingdeleterious(0)possibly_damaging(0.454)TCGA-2W-A8YY-01Cervixcervical & endocervical cancerFemale<65I/IIChemotherapycisplatinCR
DHPSSNVMissense_Mutationc.800N>Gp.Asn267Serp.N267SP49366protein_codingdeleterious(0)probably_damaging(0.967)TCGA-FU-A3TQ-01Cervixcervical & endocervical cancerFemale<65III/IVUnknownUnknownSD
DHPSSNVMissense_Mutationc.147C>Gp.Phe49Leup.F49LP49366protein_codingtolerated(0.28)benign(0)TCGA-IR-A3LH-01Cervixcervical & endocervical cancerFemale<65I/IIChemotherapycisplatinCR
DHPSSNVMissense_Mutationc.147N>Ap.Phe49Leup.F49LP49366protein_codingtolerated(0.28)benign(0)TCGA-UC-A7PF-01Cervixcervical & endocervical cancerFemale<65I/IIUnknownUnknownSD
DHPSSNVMissense_Mutationnovelc.277N>Tp.Pro93Serp.P93SP49366protein_codingtolerated(0.51)benign(0.003)TCGA-VS-A953-01Cervixcervical & endocervical cancerFemale<65I/IIUnknownUnknownPD
Page: 1 2 3 4 

Top

Related drugs of malignant transformation related genes

check buttonIdentification of chemicals and drugs interact with genes involved in malignant transfromation
(DGIdb 4.0)
Entrez IDSymbolCategoryInteraction TypesDrug Claim NameDrug NamePMIDs
1725DHPSNADEOXYSPERGUALIN11964177
Page: 1