
|
|||||
|
 | |
| |
| |
| |
| |
| |
|
Gene: DHFR |
Gene summary for DHFR |
| Gene information | Species | Human | Gene symbol | DHFR | Gene ID | 1719 |
| Gene name | dihydrofolate reductase | |
| Gene Alias | DHFRP1 | |
| Cytomap | 5q14.1 | |
| Gene Type | protein-coding | GO ID | GO:0000302 | UniProtAcc | B0YJ76 |
Top |
Malignant transformation analysis |
| Identification of the aberrant gene expression in precancerous and cancerous lesions by comparing the gene expression of stem-like cells in diseased tissues with normal stem cells |
| Entrez ID | Symbol | Replicates | Species | Organ | Tissue | Adj P-value | Log2FC | Malignancy |
| 1719 | DHFR | HTA11_3410_2000001011 | Human | Colorectum | AD | 3.47e-20 | 6.05e-01 | 0.0155 |
| 1719 | DHFR | HTA11_2487_2000001011 | Human | Colorectum | SER | 2.74e-48 | 1.56e+00 | -0.1808 |
| 1719 | DHFR | HTA11_2951_2000001011 | Human | Colorectum | AD | 3.14e-03 | 6.82e-01 | 0.0216 |
| 1719 | DHFR | HTA11_1938_2000001011 | Human | Colorectum | AD | 2.02e-33 | 1.41e+00 | -0.0811 |
| 1719 | DHFR | HTA11_78_2000001011 | Human | Colorectum | AD | 9.42e-21 | 8.60e-01 | -0.1088 |
| 1719 | DHFR | HTA11_347_2000001011 | Human | Colorectum | AD | 5.27e-93 | 2.04e+00 | -0.1954 |
| 1719 | DHFR | HTA11_411_2000001011 | Human | Colorectum | SER | 1.54e-17 | 2.06e+00 | -0.2602 |
| 1719 | DHFR | HTA11_2112_2000001011 | Human | Colorectum | SER | 1.99e-25 | 2.22e+00 | -0.2196 |
| 1719 | DHFR | HTA11_3361_2000001011 | Human | Colorectum | AD | 6.06e-39 | 1.68e+00 | -0.1207 |
| 1719 | DHFR | HTA11_83_2000001011 | Human | Colorectum | SER | 2.00e-27 | 1.44e+00 | -0.1526 |
| 1719 | DHFR | HTA11_696_2000001011 | Human | Colorectum | AD | 5.89e-63 | 1.42e+00 | -0.1464 |
| 1719 | DHFR | HTA11_866_2000001011 | Human | Colorectum | AD | 8.09e-38 | 1.01e+00 | -0.1001 |
| 1719 | DHFR | HTA11_1391_2000001011 | Human | Colorectum | AD | 2.89e-49 | 1.59e+00 | -0.059 |
| 1719 | DHFR | HTA11_2992_2000001011 | Human | Colorectum | SER | 8.47e-20 | 1.70e+00 | -0.1706 |
| 1719 | DHFR | HTA11_5212_2000001011 | Human | Colorectum | AD | 8.21e-24 | 1.75e+00 | -0.2061 |
| 1719 | DHFR | HTA11_5216_2000001011 | Human | Colorectum | SER | 4.46e-19 | 1.83e+00 | -0.1462 |
| 1719 | DHFR | HTA11_546_2000001011 | Human | Colorectum | AD | 1.79e-30 | 1.49e+00 | -0.0842 |
| 1719 | DHFR | HTA11_7862_2000001011 | Human | Colorectum | AD | 4.17e-02 | 3.90e-01 | -0.0179 |
| 1719 | DHFR | HTA11_866_3004761011 | Human | Colorectum | AD | 3.22e-16 | 7.34e-01 | 0.096 |
| 1719 | DHFR | HTA11_4255_2000001011 | Human | Colorectum | SER | 1.29e-09 | 9.85e-01 | 0.0446 |
| Page: 1 2 3 4 5 6 7 |
| Tissue | Expression Dynamics | Abbreviation |
| Colorectum (GSE201348) |  | FAP: Familial adenomatous polyposis |
| CRC: Colorectal cancer | ||
| Colorectum (HTA11) |  | AD: Adenomas |
| SER: Sessile serrated lesions | ||
| MSI-H: Microsatellite-high colorectal cancer | ||
| MSS: Microsatellite stable colorectal cancer | ||
| Esophagus | 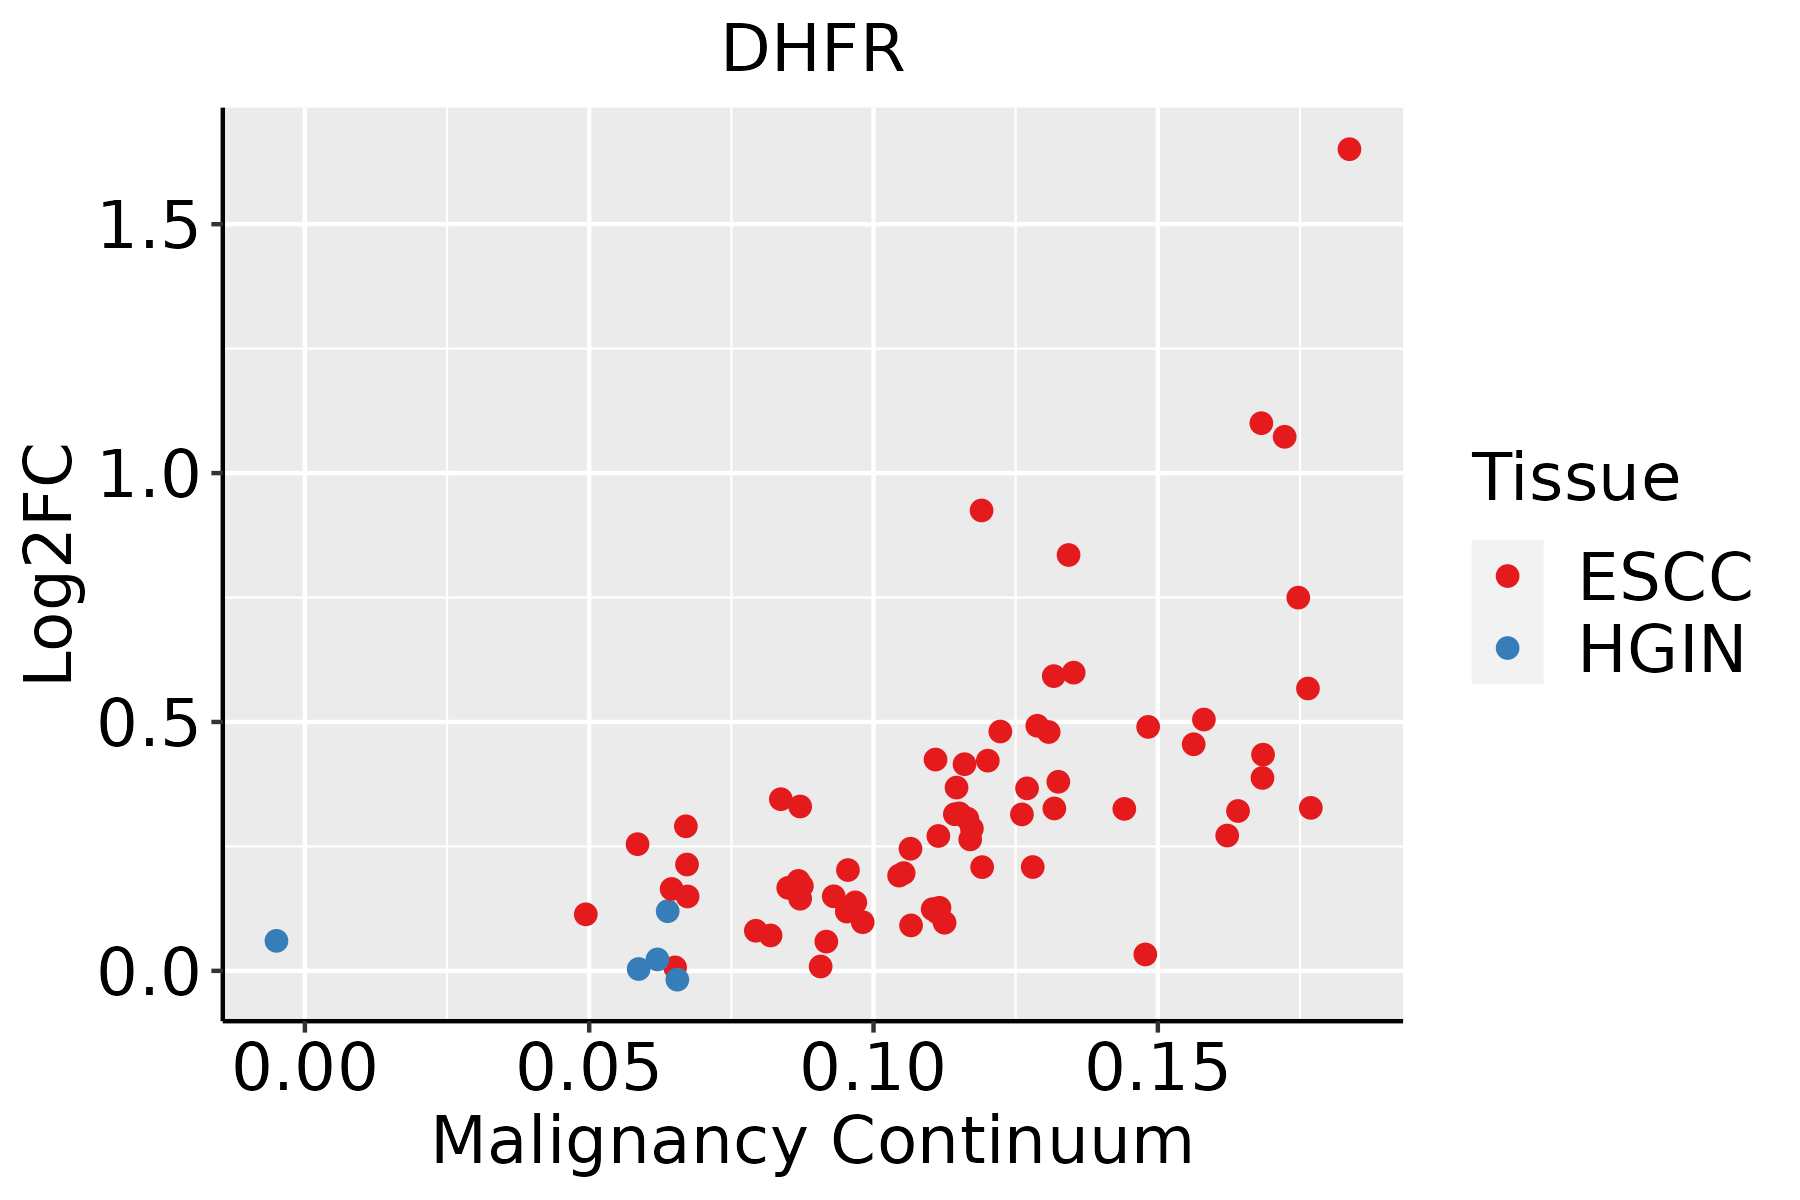 | ESCC: Esophageal squamous cell carcinoma |
| HGIN: High-grade intraepithelial neoplasias | ||
| LGIN: Low-grade intraepithelial neoplasias | ||
| Liver |  | HCC: Hepatocellular carcinoma |
| NAFLD: Non-alcoholic fatty liver disease | ||
| Oral Cavity | 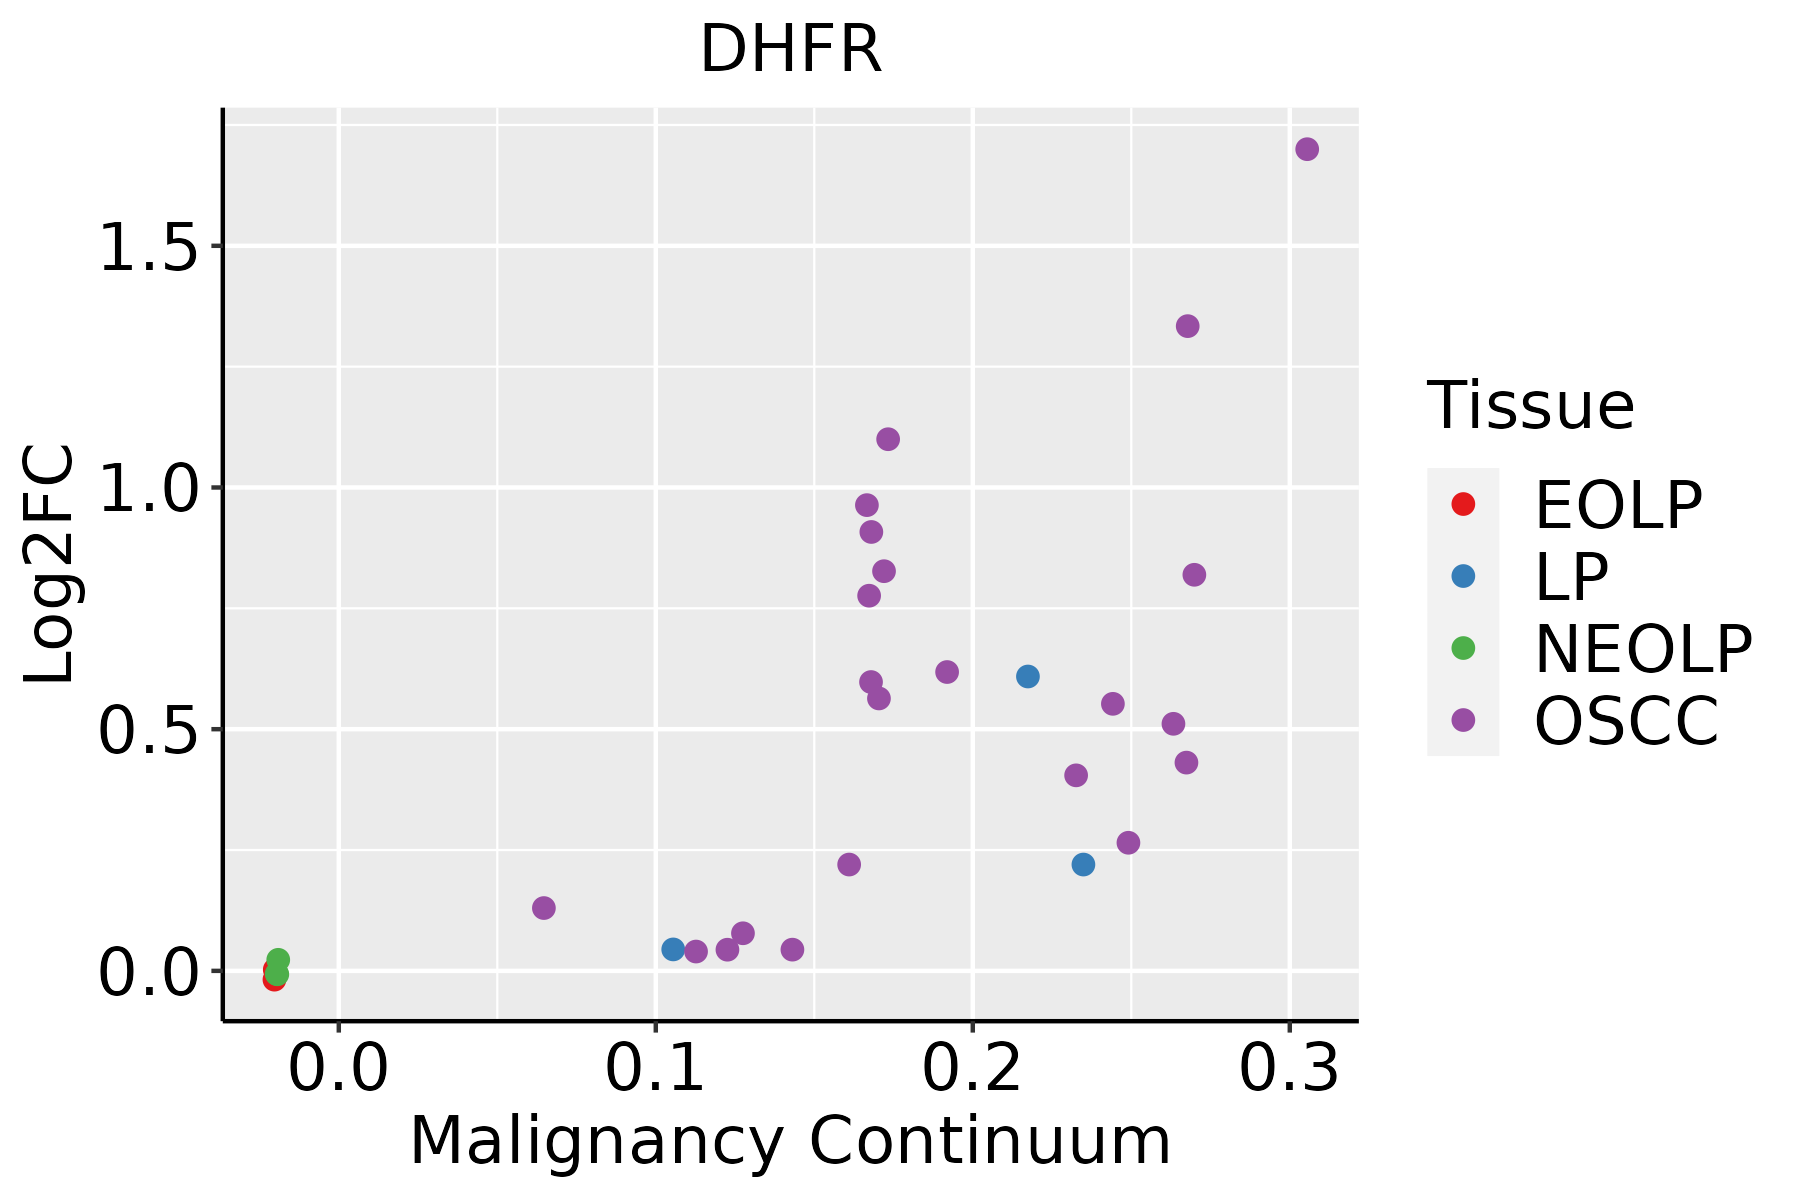 | EOLP: Erosive Oral lichen planus |
| LP: leukoplakia | ||
| NEOLP: Non-erosive oral lichen planus | ||
| OSCC: Oral squamous cell carcinoma | ||
| Skin |  | AK: Actinic keratosis |
| cSCC: Cutaneous squamous cell carcinoma | ||
| SCCIS:squamous cell carcinoma in situ | ||
| Thyroid | 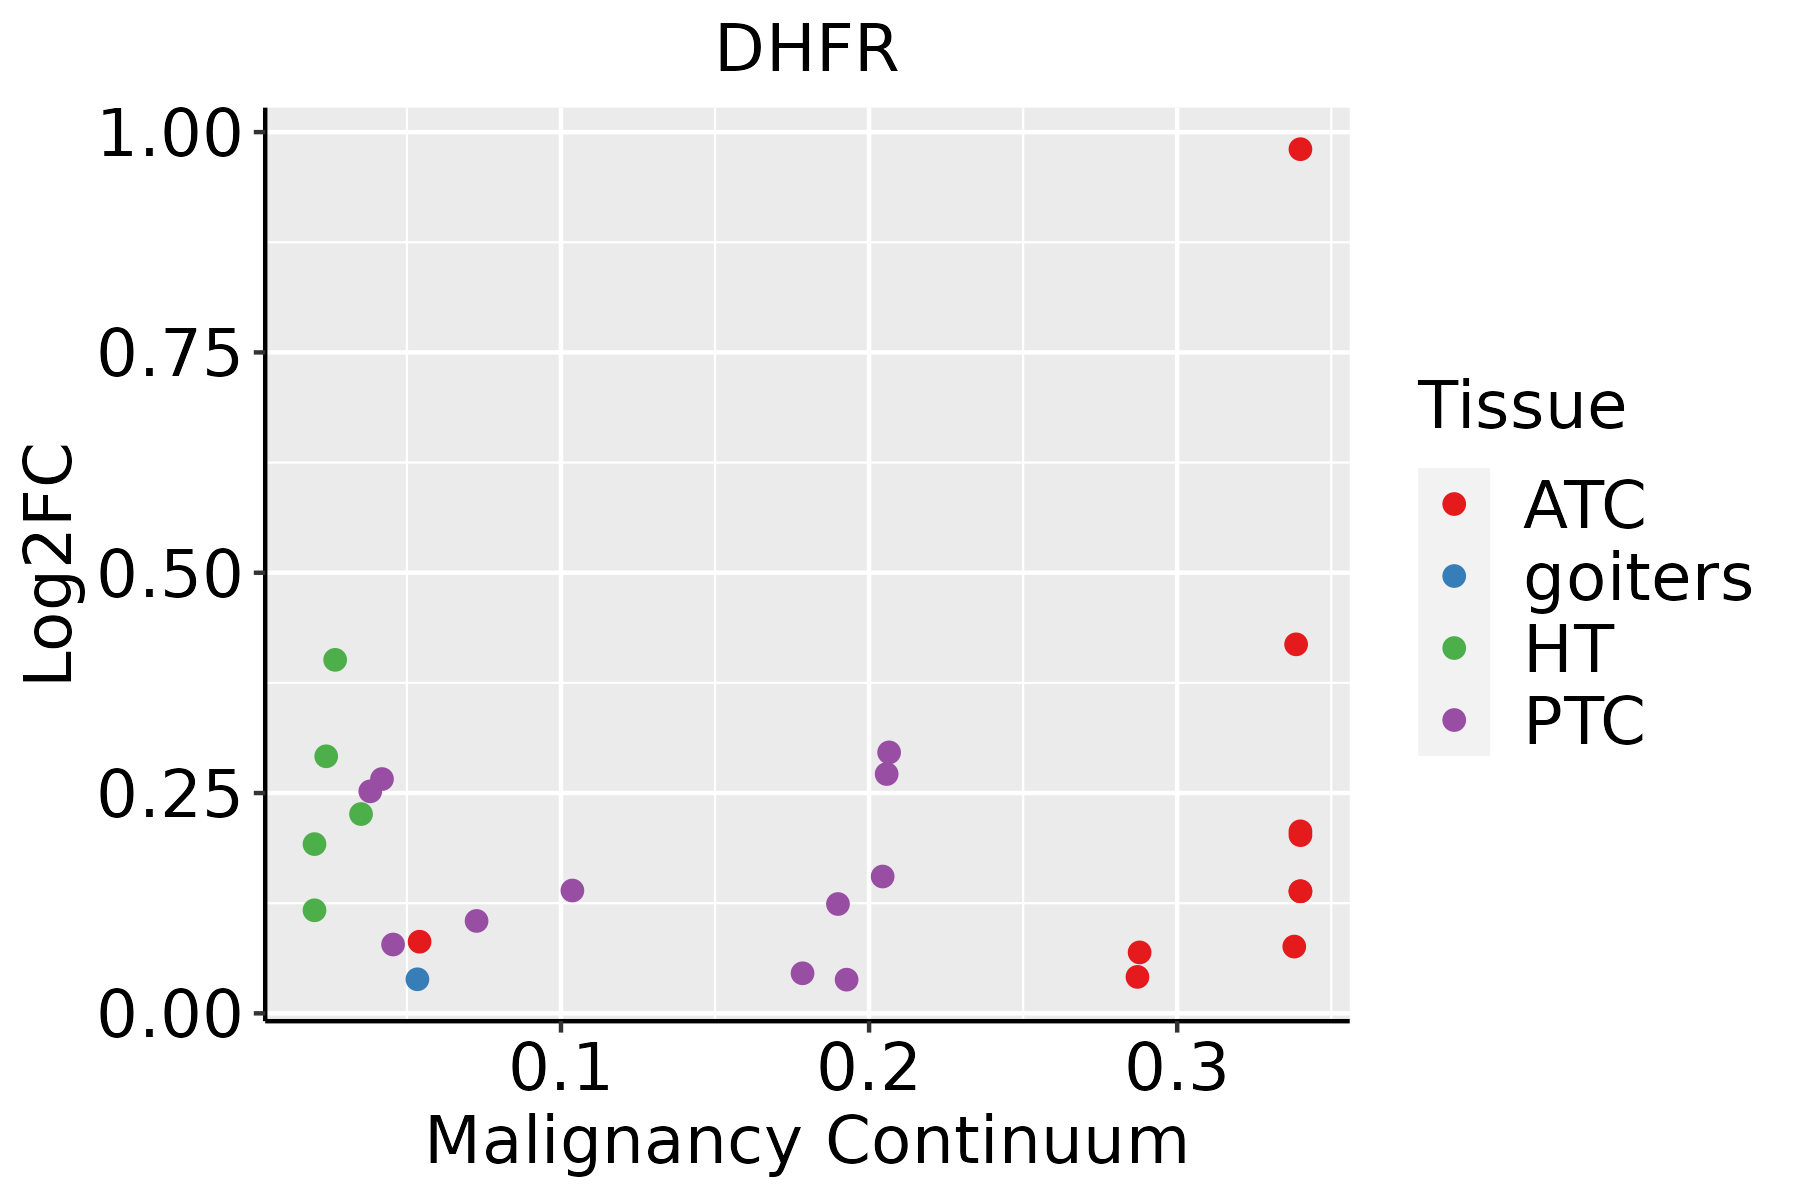 | ATC: Anaplastic thyroid cancer |
| HT: Hashimoto's thyroiditis | ||
| PTC: Papillary thyroid cancer |
| ∗log2FC in expression of this searched gene in stem-like cells from each diseased tissue sample relative to stem-like cells in normal samples in each tissue plotted against the malignancy continuum. Samples are colored based on if they are from different disease stage. |
Top |
Malignant transformation related pathway analysis |
| Find out the enriched GO biological processes and KEGG pathways involved in transition from healthy to precancer to cancer |
| Tissue | Disease Stage | Enriched GO biological Processes |
| Colorectum | AD |  |
| Colorectum | SER |  |
| Colorectum | MSS |  |
| Colorectum | MSI-H |  |
| Colorectum | FAP |  |
| ∗Top 15 enriched GO BP terms are showed in the bar plot of each disease state in each tissue. Each row represents a significant GO biological process which is colored according to the -log10(p.adjust). |
| Page: 1 2 3 4 5 6 7 8 9 |
| GO ID | Tissue | Disease Stage | Description | Gene Ratio | Bg Ratio | pvalue | p.adjust | Count |
| GO:0006979 | Colorectum | AD | response to oxidative stress | 145/3918 | 446/18723 | 5.16e-09 | 3.23e-07 | 145 |
| GO:0062197 | Colorectum | AD | cellular response to chemical stress | 109/3918 | 337/18723 | 5.33e-07 | 1.95e-05 | 109 |
| GO:0000302 | Colorectum | AD | response to reactive oxygen species | 78/3918 | 222/18723 | 6.17e-07 | 2.21e-05 | 78 |
| GO:0009636 | Colorectum | AD | response to toxic substance | 88/3918 | 262/18723 | 1.12e-06 | 3.72e-05 | 88 |
| GO:0006417 | Colorectum | AD | regulation of translation | 141/3918 | 468/18723 | 1.32e-06 | 4.22e-05 | 141 |
| GO:0034599 | Colorectum | AD | cellular response to oxidative stress | 94/3918 | 288/18723 | 2.03e-06 | 6.02e-05 | 94 |
| GO:0006066 | Colorectum | AD | alcohol metabolic process | 106/3918 | 353/18723 | 3.02e-05 | 5.57e-04 | 106 |
| GO:0098754 | Colorectum | AD | detoxification | 53/3918 | 152/18723 | 4.63e-05 | 7.98e-04 | 53 |
| GO:0061564 | Colorectum | AD | axon development | 132/3918 | 467/18723 | 8.40e-05 | 1.31e-03 | 132 |
| GO:0097237 | Colorectum | AD | cellular response to toxic substance | 44/3918 | 124/18723 | 1.24e-04 | 1.80e-03 | 44 |
| GO:1990748 | Colorectum | AD | cellular detoxification | 41/3918 | 116/18723 | 2.29e-04 | 2.97e-03 | 41 |
| GO:0072593 | Colorectum | AD | reactive oxygen species metabolic process | 73/3918 | 239/18723 | 2.79e-04 | 3.42e-03 | 73 |
| GO:0006575 | Colorectum | AD | cellular modified amino acid metabolic process | 59/3918 | 188/18723 | 4.80e-04 | 5.27e-03 | 59 |
| GO:0006730 | Colorectum | AD | one-carbon metabolic process | 18/3918 | 40/18723 | 5.36e-04 | 5.74e-03 | 18 |
| GO:0034614 | Colorectum | AD | cellular response to reactive oxygen species | 50/3918 | 155/18723 | 6.25e-04 | 6.49e-03 | 50 |
| GO:0043648 | Colorectum | AD | dicarboxylic acid metabolic process | 34/3918 | 96/18723 | 7.22e-04 | 7.28e-03 | 34 |
| GO:1902882 | Colorectum | AD | regulation of response to oxidative stress | 34/3918 | 98/18723 | 1.09e-03 | 1.01e-02 | 34 |
| GO:0006520 | Colorectum | AD | cellular amino acid metabolic process | 81/3918 | 284/18723 | 1.37e-03 | 1.19e-02 | 81 |
| GO:1900407 | Colorectum | AD | regulation of cellular response to oxidative stress | 31/3918 | 89/18723 | 1.65e-03 | 1.38e-02 | 31 |
| GO:2000377 | Colorectum | AD | regulation of reactive oxygen species metabolic process | 48/3918 | 157/18723 | 2.77e-03 | 2.09e-02 | 48 |
| Page: 1 2 3 4 5 6 7 8 9 10 11 12 13 14 15 16 17 18 19 20 |
| Pathway ID | Tissue | Disease Stage | Description | Gene Ratio | Bg Ratio | pvalue | p.adjust | qvalue | Count |
| hsa00670 | Colorectum | MSI-H | One carbon pool by folate | 7/797 | 20/8465 | 1.65e-03 | 1.73e-02 | 1.45e-02 | 7 |
| hsa006701 | Colorectum | MSI-H | One carbon pool by folate | 7/797 | 20/8465 | 1.65e-03 | 1.73e-02 | 1.45e-02 | 7 |
| hsa012405 | Esophagus | ESCC | Biosynthesis of cofactors | 97/4205 | 153/8465 | 3.88e-04 | 1.35e-03 | 6.94e-04 | 97 |
| hsa015232 | Esophagus | ESCC | Antifolate resistance | 22/4205 | 30/8465 | 7.23e-03 | 1.76e-02 | 8.99e-03 | 22 |
| hsa0124012 | Esophagus | ESCC | Biosynthesis of cofactors | 97/4205 | 153/8465 | 3.88e-04 | 1.35e-03 | 6.94e-04 | 97 |
| hsa0152311 | Esophagus | ESCC | Antifolate resistance | 22/4205 | 30/8465 | 7.23e-03 | 1.76e-02 | 8.99e-03 | 22 |
| hsa01240 | Liver | Cirrhotic | Biosynthesis of cofactors | 66/2530 | 153/8465 | 3.11e-04 | 1.99e-03 | 1.23e-03 | 66 |
| hsa012401 | Liver | Cirrhotic | Biosynthesis of cofactors | 66/2530 | 153/8465 | 3.11e-04 | 1.99e-03 | 1.23e-03 | 66 |
| hsa012402 | Liver | HCC | Biosynthesis of cofactors | 103/4020 | 153/8465 | 4.67e-07 | 5.05e-06 | 2.81e-06 | 103 |
| hsa006702 | Liver | HCC | One carbon pool by folate | 17/4020 | 20/8465 | 6.04e-04 | 2.50e-03 | 1.39e-03 | 17 |
| hsa01523 | Liver | HCC | Antifolate resistance | 21/4020 | 30/8465 | 1.06e-02 | 2.71e-02 | 1.51e-02 | 21 |
| hsa012403 | Liver | HCC | Biosynthesis of cofactors | 103/4020 | 153/8465 | 4.67e-07 | 5.05e-06 | 2.81e-06 | 103 |
| hsa0067011 | Liver | HCC | One carbon pool by folate | 17/4020 | 20/8465 | 6.04e-04 | 2.50e-03 | 1.39e-03 | 17 |
| hsa015231 | Liver | HCC | Antifolate resistance | 21/4020 | 30/8465 | 1.06e-02 | 2.71e-02 | 1.51e-02 | 21 |
| hsa012404 | Oral cavity | OSCC | Biosynthesis of cofactors | 88/3704 | 153/8465 | 3.84e-04 | 1.20e-03 | 6.12e-04 | 88 |
| hsa0124011 | Oral cavity | OSCC | Biosynthesis of cofactors | 88/3704 | 153/8465 | 3.84e-04 | 1.20e-03 | 6.12e-04 | 88 |
| Page: 1 |
Top |
Cell-cell communication analysis |
| Identification of potential cell-cell interactions between two cell types and their ligand-receptor pairs for different disease states |
| Ligand | Receptor | LRpair | Pathway | Tissue | Disease Stage |
| Page: 1 |
Top |
Single-cell gene regulatory network inference analysis |
| Find out the significant the regulons (TFs) and the target genes of each regulon across cell types for different disease states |
| TF | Cell Type | Tissue | Disease Stage | Target Gene | RSS | Regulon Activity |
| ∗The dot plots of a searched regulon are shown for all cell subpopulations in each disease state of each tissue based on the regulon specific score inferred using pySCENIC and by calculating the average expression. |
| Page: 1 |
Top |
Somatic mutation of malignant transformation related genes |
| Annotation of somatic variants for genes involved in malignant transformation |
| Hugo Symbol | Variant Class | Variant Classification | dbSNP RS | HGVSc | HGVSp | HGVSp Short | SWISSPROT | BIOTYPE | SIFT | PolyPhen | Tumor Sample Barcode | Tissue | Histology | Sex | Age | Stage | Therapy Types | Drugs | Outcome |
| DHFR | SNV | Missense_Mutation | novel | c.358T>C | p.Ser120Pro | p.S120P | P00374 | protein_coding | deleterious(0.02) | possibly_damaging(0.86) | TCGA-AA-3715-01 | Colorectum | colon adenocarcinoma | Male | >=65 | I/II | Unknown | Unknown | PD |
| DHFR | SNV | Missense_Mutation | c.226N>A | p.Leu76Ile | p.L76I | P00374 | protein_coding | deleterious(0.01) | probably_damaging(0.991) | TCGA-AG-3892-01 | Colorectum | rectum adenocarcinoma | Female | <65 | I/II | Unknown | Unknown | SD | |
| DHFR | SNV | Missense_Mutation | novel | c.557N>G | p.Asn186Ser | p.N186S | P00374 | protein_coding | tolerated(0.58) | benign(0) | TCGA-AP-A054-01 | Endometrium | uterine corpus endometrioid carcinoma | Female | <65 | III/IV | Chemotherapy | carboplatin | PD |
| DHFR | SNV | Missense_Mutation | c.359C>A | p.Ser120Tyr | p.S120Y | P00374 | protein_coding | deleterious(0) | possibly_damaging(0.853) | TCGA-AP-A0LM-01 | Endometrium | uterine corpus endometrioid carcinoma | Female | <65 | III/IV | Chemotherapy | cisplatin | SD | |
| DHFR | SNV | Missense_Mutation | c.499N>A | p.Leu167Ile | p.L167I | P00374 | protein_coding | deleterious(0.02) | benign(0.058) | TCGA-AX-A0J0-01 | Endometrium | uterine corpus endometrioid carcinoma | Female | <65 | I/II | Unknown | Unknown | SD | |
| DHFR | SNV | Missense_Mutation | c.226C>A | p.Leu76Ile | p.L76I | P00374 | protein_coding | deleterious(0.01) | probably_damaging(0.991) | TCGA-BS-A0UF-01 | Endometrium | uterine corpus endometrioid carcinoma | Female | >=65 | I/II | Unknown | Unknown | SD | |
| DHFR | SNV | Missense_Mutation | novel | c.395N>G | p.Leu132Arg | p.L132R | P00374 | protein_coding | tolerated(0.38) | benign(0.073) | TCGA-EO-A22R-01 | Endometrium | uterine corpus endometrioid carcinoma | Female | <65 | I/II | Unknown | Unknown | SD |
| DHFR | SNV | Missense_Mutation | novel | c.347N>G | p.Val116Gly | p.V116G | P00374 | protein_coding | deleterious(0) | possibly_damaging(0.749) | TCGA-EO-A22X-01 | Endometrium | uterine corpus endometrioid carcinoma | Female | <65 | III/IV | Unspecific | Carboplatin | Complete Response |
| DHFR | SNV | Missense_Mutation | c.391N>T | p.His131Tyr | p.H131Y | P00374 | protein_coding | tolerated(1) | benign(0.007) | TCGA-55-8092-01 | Lung | lung adenocarcinoma | Male | >=65 | I/II | Unknown | Unknown | PD | |
| DHFR | SNV | Missense_Mutation | novel | c.233N>A | p.Arg78Lys | p.R78K | P00374 | protein_coding | tolerated(0.15) | benign(0.039) | TCGA-CR-7388-01 | Oral cavity | head & neck squamous cell carcinoma | Female | >=65 | I/II | Chemotherapy | carboplatin | PD |
| Page: 1 2 |
Top |
Related drugs of malignant transformation related genes |
| Identification of chemicals and drugs interact with genes involved in malignant transfromation |
| (DGIdb 4.0) |
| Entrez ID | Symbol | Category | Interaction Types | Drug Claim Name | Drug Name | PMIDs |
| 1719 | DHFR | DRUGGABLE GENOME, ENZYME | 10-PROPARGYL-10-DEAZAAMINOPTERIN | PRALATREXATE | ||
| 1719 | DHFR | DRUGGABLE GENOME, ENZYME | inhibitor | 310264671 | ||
| 1719 | DHFR | DRUGGABLE GENOME, ENZYME | inhibitor | CHEMBL1201746 | PRALATREXATE | |
| 1719 | DHFR | DRUGGABLE GENOME, ENZYME | METHOTREXATE | METHOTREXATE | ||
| 1719 | DHFR | DRUGGABLE GENOME, ENZYME | inhibitor | 178103443 | PEMETREXED | |
| 1719 | DHFR | DRUGGABLE GENOME, ENZYME | CH-4051 | |||
| 1719 | DHFR | DRUGGABLE GENOME, ENZYME | ANTITUMOR ANTIBIOTIC | 8117738 | ||
| 1719 | DHFR | DRUGGABLE GENOME, ENZYME | pemetrexed | PEMETREXED | 24732178,23709418 | |
| 1719 | DHFR | DRUGGABLE GENOME, ENZYME | MITOMYCIN-C | 1332730 | ||
| 1719 | DHFR | DRUGGABLE GENOME, ENZYME | Leucovorin Calcium |
| Page: 1 2 3 4 5 6 |

Copyright 2023-Present -The University of Texas Health Science Center at Houston |