
|
|||||
|
 | |
| |
| |
| |
| |
| |
|
Gene: DHDDS |
Gene summary for DHDDS |
| Gene information | Species | Human | Gene symbol | DHDDS | Gene ID | 79947 |
| Gene name | dehydrodolichyl diphosphate synthase subunit | |
| Gene Alias | CIT | |
| Cytomap | 1p36.11 | |
| Gene Type | protein-coding | GO ID | GO:0006066 | UniProtAcc | Q86SQ9 |
Top |
Malignant transformation analysis |
| Identification of the aberrant gene expression in precancerous and cancerous lesions by comparing the gene expression of stem-like cells in diseased tissues with normal stem cells |
| Entrez ID | Symbol | Replicates | Species | Organ | Tissue | Adj P-value | Log2FC | Malignancy |
| 79947 | DHDDS | LZE4T | Human | Esophagus | ESCC | 4.37e-02 | 1.69e-01 | 0.0811 |
| 79947 | DHDDS | LZE24T | Human | Esophagus | ESCC | 6.05e-07 | 1.89e-01 | 0.0596 |
| 79947 | DHDDS | P1T-E | Human | Esophagus | ESCC | 5.87e-04 | 2.18e-01 | 0.0875 |
| 79947 | DHDDS | P2T-E | Human | Esophagus | ESCC | 3.39e-21 | 2.72e-01 | 0.1177 |
| 79947 | DHDDS | P4T-E | Human | Esophagus | ESCC | 1.95e-11 | 2.62e-01 | 0.1323 |
| 79947 | DHDDS | P5T-E | Human | Esophagus | ESCC | 4.03e-20 | 3.33e-01 | 0.1327 |
| 79947 | DHDDS | P8T-E | Human | Esophagus | ESCC | 1.14e-06 | 1.41e-01 | 0.0889 |
| 79947 | DHDDS | P9T-E | Human | Esophagus | ESCC | 2.27e-03 | 1.32e-01 | 0.1131 |
| 79947 | DHDDS | P10T-E | Human | Esophagus | ESCC | 1.18e-17 | 3.19e-01 | 0.116 |
| 79947 | DHDDS | P11T-E | Human | Esophagus | ESCC | 9.66e-07 | 2.99e-01 | 0.1426 |
| 79947 | DHDDS | P12T-E | Human | Esophagus | ESCC | 8.40e-12 | 1.85e-01 | 0.1122 |
| 79947 | DHDDS | P15T-E | Human | Esophagus | ESCC | 3.82e-17 | 2.82e-01 | 0.1149 |
| 79947 | DHDDS | P16T-E | Human | Esophagus | ESCC | 1.67e-13 | 1.27e-01 | 0.1153 |
| 79947 | DHDDS | P17T-E | Human | Esophagus | ESCC | 2.39e-02 | 1.83e-01 | 0.1278 |
| 79947 | DHDDS | P19T-E | Human | Esophagus | ESCC | 1.55e-05 | 3.52e-01 | 0.1662 |
| 79947 | DHDDS | P20T-E | Human | Esophagus | ESCC | 3.34e-10 | 2.39e-01 | 0.1124 |
| 79947 | DHDDS | P21T-E | Human | Esophagus | ESCC | 7.73e-24 | 4.74e-01 | 0.1617 |
| 79947 | DHDDS | P22T-E | Human | Esophagus | ESCC | 2.32e-05 | 7.90e-02 | 0.1236 |
| 79947 | DHDDS | P23T-E | Human | Esophagus | ESCC | 3.30e-17 | 3.46e-01 | 0.108 |
| 79947 | DHDDS | P24T-E | Human | Esophagus | ESCC | 1.75e-08 | 1.94e-01 | 0.1287 |
| Page: 1 2 3 4 5 |
| Tissue | Expression Dynamics | Abbreviation |
| Esophagus | 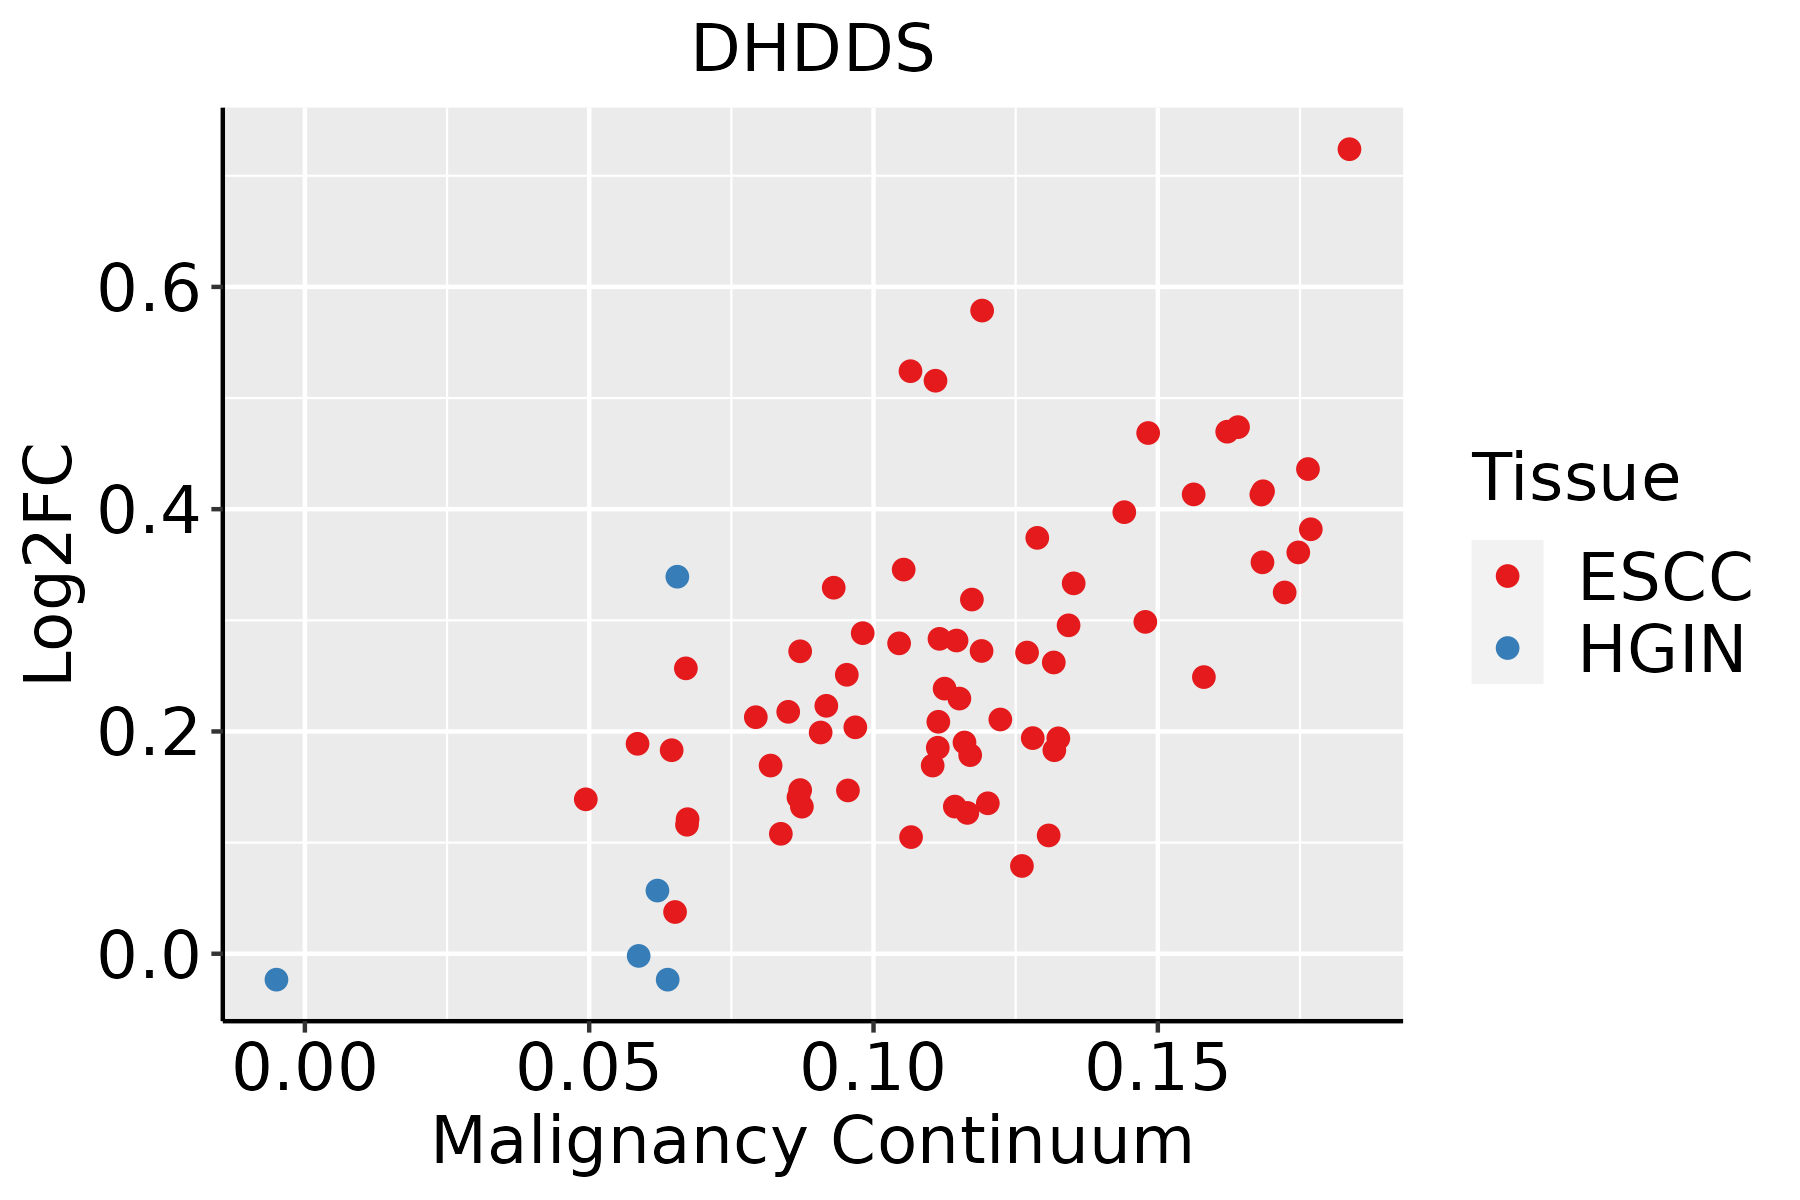 | ESCC: Esophageal squamous cell carcinoma |
| HGIN: High-grade intraepithelial neoplasias | ||
| LGIN: Low-grade intraepithelial neoplasias | ||
| Liver | 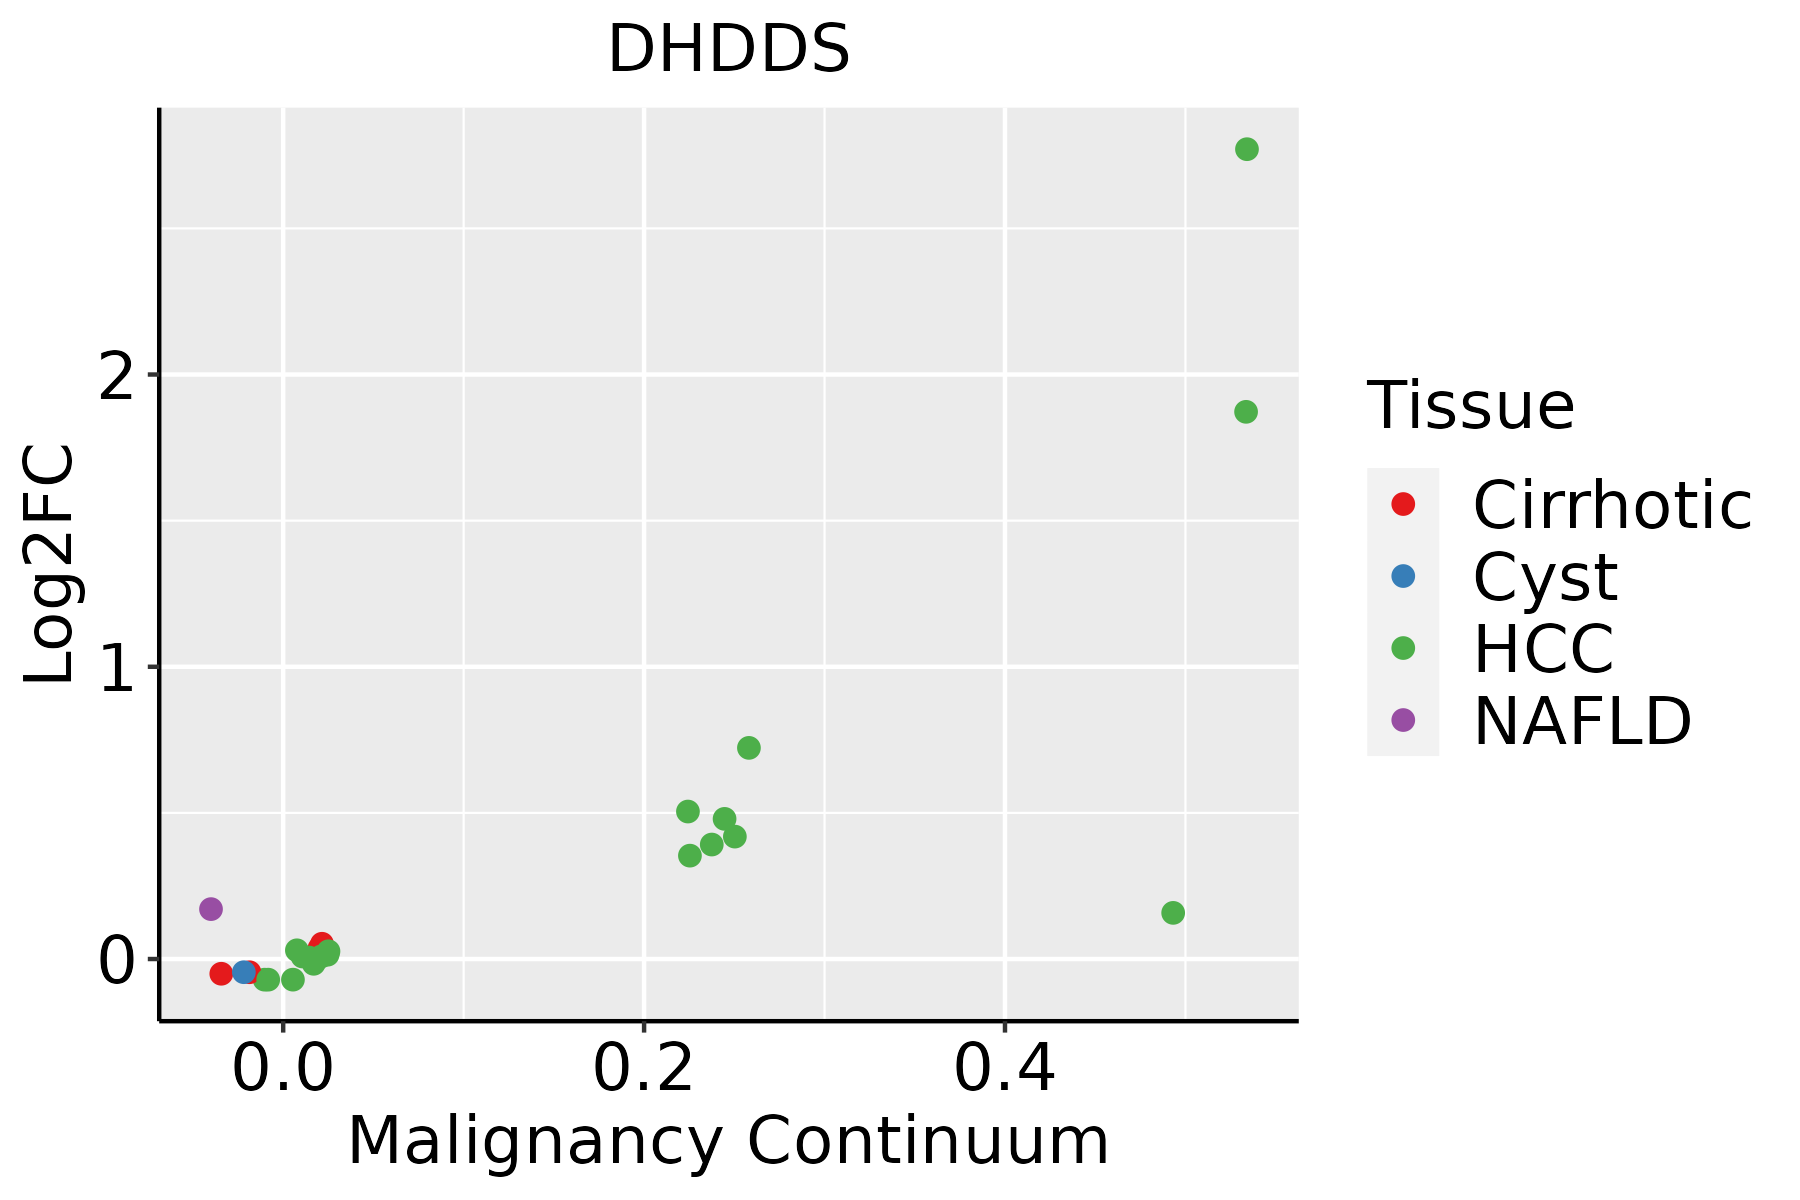 | HCC: Hepatocellular carcinoma |
| NAFLD: Non-alcoholic fatty liver disease | ||
| Oral Cavity |  | EOLP: Erosive Oral lichen planus |
| LP: leukoplakia | ||
| NEOLP: Non-erosive oral lichen planus | ||
| OSCC: Oral squamous cell carcinoma | ||
| Thyroid | 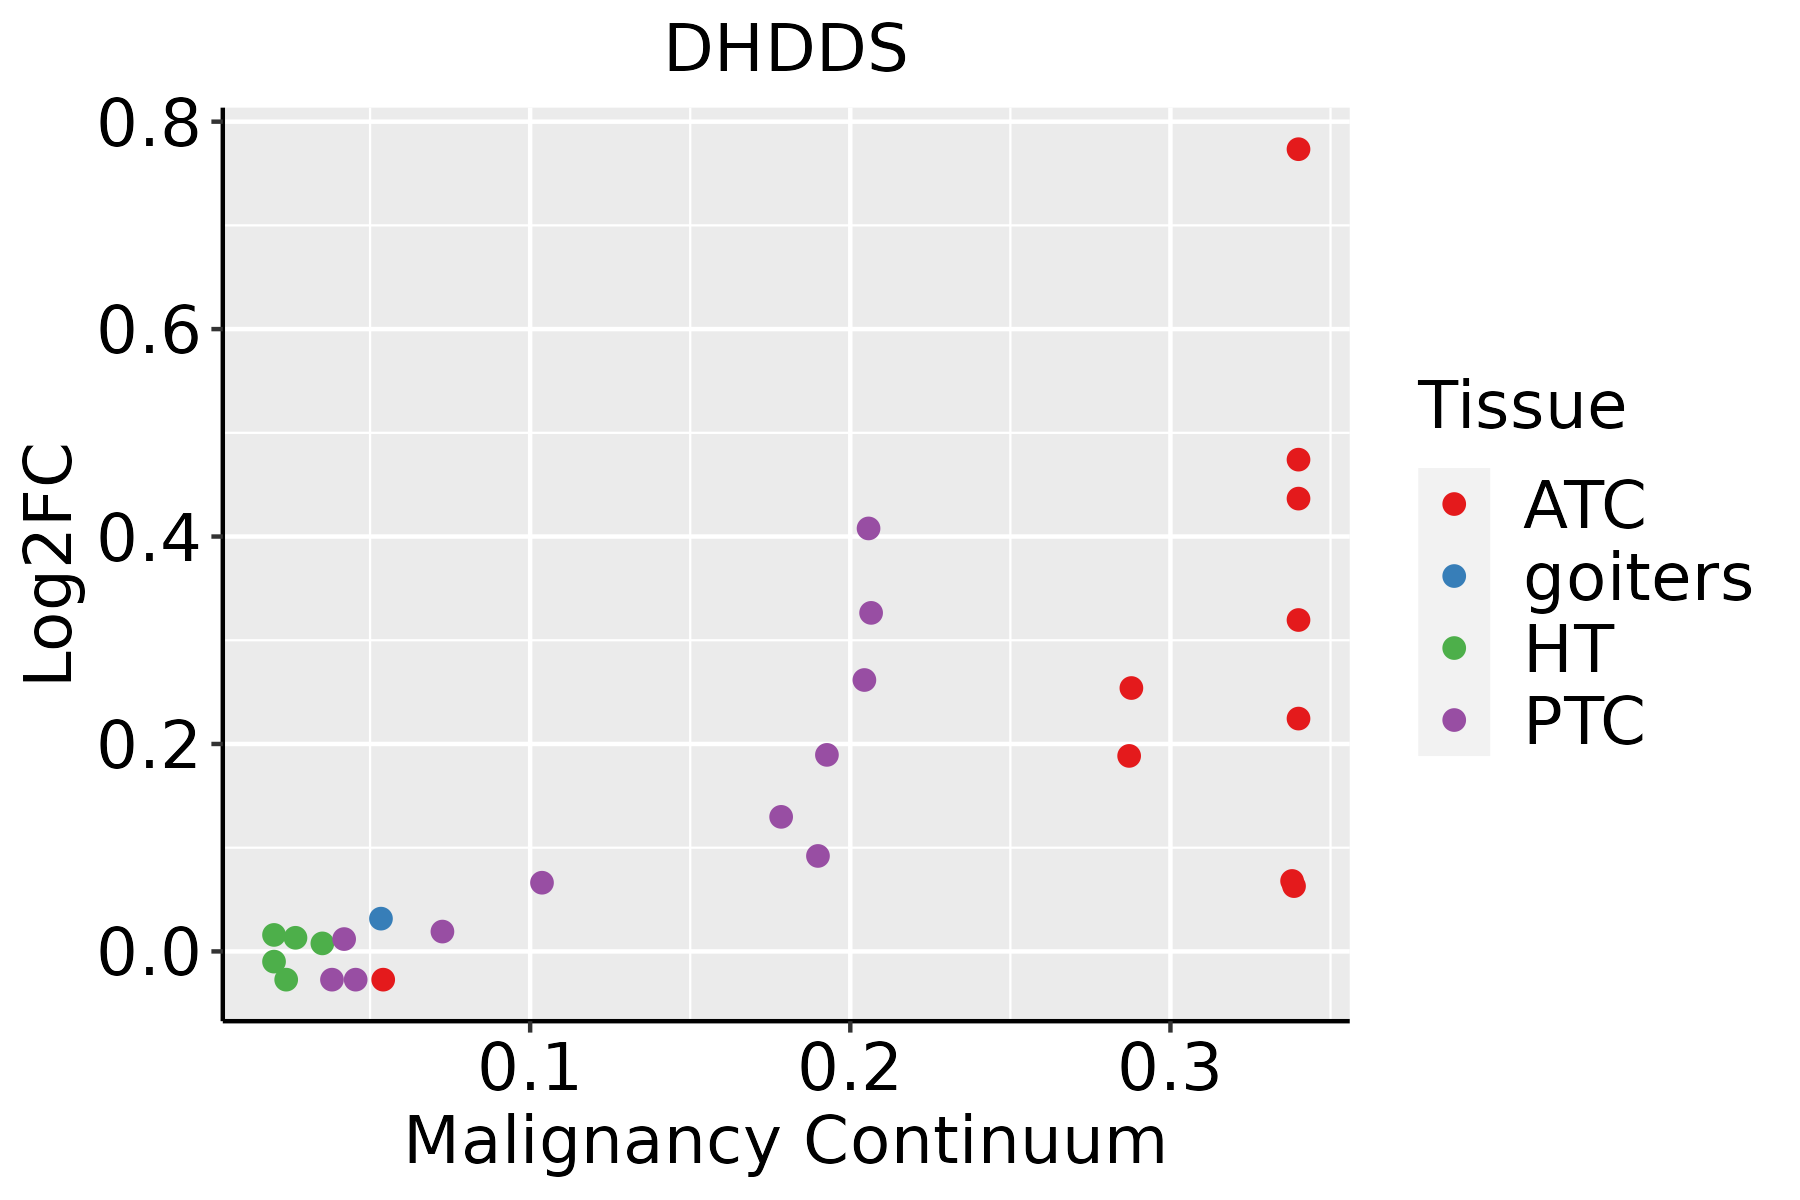 | ATC: Anaplastic thyroid cancer |
| HT: Hashimoto's thyroiditis | ||
| PTC: Papillary thyroid cancer |
| ∗log2FC in expression of this searched gene in stem-like cells from each diseased tissue sample relative to stem-like cells in normal samples in each tissue plotted against the malignancy continuum. Samples are colored based on if they are from different disease stage. |
Top |
Malignant transformation related pathway analysis |
| Find out the enriched GO biological processes and KEGG pathways involved in transition from healthy to precancer to cancer |
| Tissue | Disease Stage | Enriched GO biological Processes |
| Colorectum | AD |  |
| Colorectum | SER |  |
| Colorectum | MSS |  |
| Colorectum | MSI-H |  |
| Colorectum | FAP |  |
| ∗Top 15 enriched GO BP terms are showed in the bar plot of each disease state in each tissue. Each row represents a significant GO biological process which is colored according to the -log10(p.adjust). |
| Page: 1 2 3 4 5 6 7 8 9 |
| GO ID | Tissue | Disease Stage | Description | Gene Ratio | Bg Ratio | pvalue | p.adjust | Count |
| GO:00086544 | Esophagus | ESCC | phospholipid biosynthetic process | 162/8552 | 253/18723 | 2.59e-09 | 5.73e-08 | 162 |
| GO:000648714 | Esophagus | ESCC | protein N-linked glycosylation | 51/8552 | 65/18723 | 6.41e-08 | 1.13e-06 | 51 |
| GO:00091002 | Esophagus | ESCC | glycoprotein metabolic process | 226/8552 | 387/18723 | 2.64e-07 | 3.94e-06 | 226 |
| GO:00700854 | Esophagus | ESCC | glycosylation | 144/8552 | 240/18723 | 5.12e-06 | 5.38e-05 | 144 |
| GO:00066446 | Esophagus | ESCC | phospholipid metabolic process | 218/8552 | 383/18723 | 5.37e-06 | 5.59e-05 | 218 |
| GO:00060668 | Esophagus | ESCC | alcohol metabolic process | 202/8552 | 353/18723 | 7.32e-06 | 7.26e-05 | 202 |
| GO:00064865 | Esophagus | ESCC | protein glycosylation | 135/8552 | 226/18723 | 1.36e-05 | 1.24e-04 | 135 |
| GO:00434135 | Esophagus | ESCC | macromolecule glycosylation | 135/8552 | 226/18723 | 1.36e-05 | 1.24e-04 | 135 |
| GO:00091012 | Esophagus | ESCC | glycoprotein biosynthetic process | 181/8552 | 317/18723 | 2.54e-05 | 2.15e-04 | 181 |
| GO:00461653 | Esophagus | ESCC | alcohol biosynthetic process | 83/8552 | 140/18723 | 8.04e-04 | 4.16e-03 | 83 |
| GO:00082991 | Esophagus | ESCC | isoprenoid biosynthetic process | 21/8552 | 28/18723 | 1.57e-03 | 7.33e-03 | 21 |
| GO:00064882 | Esophagus | ESCC | dolichol-linked oligosaccharide biosynthetic process | 14/8552 | 18/18723 | 5.77e-03 | 2.14e-02 | 14 |
| GO:19016174 | Esophagus | ESCC | organic hydroxy compound biosynthetic process | 128/8552 | 237/18723 | 5.86e-03 | 2.16e-02 | 128 |
| GO:00064902 | Esophagus | ESCC | oligosaccharide-lipid intermediate biosynthetic process | 14/8552 | 19/18723 | 1.27e-02 | 4.21e-02 | 14 |
| GO:000606621 | Liver | HCC | alcohol metabolic process | 208/7958 | 353/18723 | 2.80e-10 | 9.50e-09 | 208 |
| GO:00086542 | Liver | HCC | phospholipid biosynthetic process | 150/7958 | 253/18723 | 4.77e-08 | 1.03e-06 | 150 |
| GO:00066444 | Liver | HCC | phospholipid metabolic process | 214/7958 | 383/18723 | 7.25e-08 | 1.48e-06 | 214 |
| GO:000648711 | Liver | HCC | protein N-linked glycosylation | 48/7958 | 65/18723 | 2.85e-07 | 5.00e-06 | 48 |
| GO:19016172 | Liver | HCC | organic hydroxy compound biosynthetic process | 129/7958 | 237/18723 | 1.32e-04 | 1.08e-03 | 129 |
| GO:00461651 | Liver | HCC | alcohol biosynthetic process | 81/7958 | 140/18723 | 1.73e-04 | 1.36e-03 | 81 |
| Page: 1 2 3 |
| Pathway ID | Tissue | Disease Stage | Description | Gene Ratio | Bg Ratio | pvalue | p.adjust | qvalue | Count |
| hsa009005 | Esophagus | ESCC | Terpenoid backbone biosynthesis | 20/4205 | 23/8465 | 2.14e-04 | 7.87e-04 | 4.03e-04 | 20 |
| hsa0090012 | Esophagus | ESCC | Terpenoid backbone biosynthesis | 20/4205 | 23/8465 | 2.14e-04 | 7.87e-04 | 4.03e-04 | 20 |
| hsa00900 | Liver | HCC | Terpenoid backbone biosynthesis | 17/4020 | 23/8465 | 9.26e-03 | 2.46e-02 | 1.37e-02 | 17 |
| hsa009001 | Liver | HCC | Terpenoid backbone biosynthesis | 17/4020 | 23/8465 | 9.26e-03 | 2.46e-02 | 1.37e-02 | 17 |
| hsa009004 | Oral cavity | OSCC | Terpenoid backbone biosynthesis | 19/3704 | 23/8465 | 1.55e-04 | 5.34e-04 | 2.72e-04 | 19 |
| hsa0090011 | Oral cavity | OSCC | Terpenoid backbone biosynthesis | 19/3704 | 23/8465 | 1.55e-04 | 5.34e-04 | 2.72e-04 | 19 |
| hsa009002 | Oral cavity | LP | Terpenoid backbone biosynthesis | 12/2418 | 23/8465 | 1.43e-02 | 4.59e-02 | 2.96e-02 | 12 |
| hsa009003 | Oral cavity | LP | Terpenoid backbone biosynthesis | 12/2418 | 23/8465 | 1.43e-02 | 4.59e-02 | 2.96e-02 | 12 |
| Page: 1 |
Top |
Cell-cell communication analysis |
| Identification of potential cell-cell interactions between two cell types and their ligand-receptor pairs for different disease states |
| Ligand | Receptor | LRpair | Pathway | Tissue | Disease Stage |
| Page: 1 |
Top |
Single-cell gene regulatory network inference analysis |
| Find out the significant the regulons (TFs) and the target genes of each regulon across cell types for different disease states |
| TF | Cell Type | Tissue | Disease Stage | Target Gene | RSS | Regulon Activity |
| ∗The dot plots of a searched regulon are shown for all cell subpopulations in each disease state of each tissue based on the regulon specific score inferred using pySCENIC and by calculating the average expression. |
| Page: 1 |
Top |
Somatic mutation of malignant transformation related genes |
| Annotation of somatic variants for genes involved in malignant transformation |
| Hugo Symbol | Variant Class | Variant Classification | dbSNP RS | HGVSc | HGVSp | HGVSp Short | SWISSPROT | BIOTYPE | SIFT | PolyPhen | Tumor Sample Barcode | Tissue | Histology | Sex | Age | Stage | Therapy Types | Drugs | Outcome |
| DHDDS | SNV | Missense_Mutation | c.836N>T | p.Thr279Ile | p.T279I | Q86SQ9 | protein_coding | tolerated(0.19) | benign(0.017) | TCGA-A2-A04T-01 | Breast | breast invasive carcinoma | Female | <65 | I/II | Chemotherapy | cyclophosphamide | SD | |
| DHDDS | SNV | Missense_Mutation | novel | c.492N>A | p.Asn164Lys | p.N164K | Q86SQ9 | protein_coding | tolerated(0.14) | benign(0.023) | TCGA-A7-A425-01 | Breast | breast invasive carcinoma | Female | >=65 | III/IV | Chemotherapy | adriamycin | PD |
| DHDDS | SNV | Missense_Mutation | novel | c.562C>T | p.Leu188Phe | p.L188F | Q86SQ9 | protein_coding | tolerated(0.15) | benign(0.233) | TCGA-AN-A046-01 | Breast | breast invasive carcinoma | Female | >=65 | I/II | Unknown | Unknown | SD |
| DHDDS | SNV | Missense_Mutation | novel | c.478C>G | p.His160Asp | p.H160D | Q86SQ9 | protein_coding | tolerated(1) | benign(0.001) | TCGA-Q1-A73O-01 | Cervix | cervical & endocervical cancer | Female | <65 | I/II | Chemotherapy | cisplatin | CR |
| DHDDS | SNV | Missense_Mutation | novel | c.929N>T | p.Arg310Leu | p.R310L | Q86SQ9 | protein_coding | deleterious(0) | probably_damaging(1) | TCGA-VS-A9UH-01 | Cervix | cervical & endocervical cancer | Female | <65 | I/II | Chemotherapy | cisplatin | CR |
| DHDDS | SNV | Missense_Mutation | c.503N>T | p.Glu168Val | p.E168V | Q86SQ9 | protein_coding | tolerated(0.08) | benign(0.236) | TCGA-AA-3663-01 | Colorectum | colon adenocarcinoma | Male | <65 | I/II | Unknown | Unknown | SD | |
| DHDDS | SNV | Missense_Mutation | novel | c.254G>A | p.Arg85His | p.R85H | Q86SQ9 | protein_coding | deleterious(0) | probably_damaging(1) | TCGA-AZ-6601-01 | Colorectum | colon adenocarcinoma | Male | >=65 | I/II | Unknown | Unknown | PD |
| DHDDS | SNV | Missense_Mutation | c.358G>A | p.Val120Ile | p.V120I | Q86SQ9 | protein_coding | tolerated(0.42) | benign(0.065) | TCGA-CK-4951-01 | Colorectum | colon adenocarcinoma | Female | >=65 | I/II | Unknown | Unknown | PD | |
| DHDDS | SNV | Missense_Mutation | c.724G>A | p.Glu242Lys | p.E242K | Q86SQ9 | protein_coding | tolerated(0.75) | benign(0.011) | TCGA-AG-3892-01 | Colorectum | rectum adenocarcinoma | Female | <65 | I/II | Unknown | Unknown | SD | |
| DHDDS | deletion | Frame_Shift_Del | c.512delN | p.Val173TrpfsTer31 | p.V173Wfs*31 | Q86SQ9 | protein_coding | TCGA-D5-6530-01 | Colorectum | colon adenocarcinoma | Male | <65 | I/II | Unknown | Unknown | SD |
| Page: 1 2 3 4 |
Top |
Related drugs of malignant transformation related genes |
| Identification of chemicals and drugs interact with genes involved in malignant transfromation |
| (DGIdb 4.0) |
| Entrez ID | Symbol | Category | Interaction Types | Drug Claim Name | Drug Name | PMIDs |
| Page: 1 |

Copyright 2023-Present -The University of Texas Health Science Center at Houston |