
|
|||||
|
 | |
| |
| |
| |
| |
| |
|
Gene: DGKZ |
Gene summary for DGKZ |
| Gene information | Species | Human | Gene symbol | DGKZ | Gene ID | 8525 |
| Gene name | diacylglycerol kinase zeta | |
| Gene Alias | DAGK5 | |
| Cytomap | 11p11.2 | |
| Gene Type | protein-coding | GO ID | GO:0001775 | UniProtAcc | Q13574 |
Top |
Malignant transformation analysis |
| Identification of the aberrant gene expression in precancerous and cancerous lesions by comparing the gene expression of stem-like cells in diseased tissues with normal stem cells |
| Entrez ID | Symbol | Replicates | Species | Organ | Tissue | Adj P-value | Log2FC | Malignancy |
| 8525 | DGKZ | LZE4T | Human | Esophagus | ESCC | 6.27e-13 | 2.31e-01 | 0.0811 |
| 8525 | DGKZ | LZE5T | Human | Esophagus | ESCC | 6.47e-04 | 2.50e-01 | 0.0514 |
| 8525 | DGKZ | LZE7T | Human | Esophagus | ESCC | 1.74e-07 | 3.88e-01 | 0.0667 |
| 8525 | DGKZ | LZE8T | Human | Esophagus | ESCC | 1.53e-05 | 1.31e-01 | 0.067 |
| 8525 | DGKZ | LZE22T | Human | Esophagus | ESCC | 4.90e-03 | 3.04e-01 | 0.068 |
| 8525 | DGKZ | LZE24T | Human | Esophagus | ESCC | 2.44e-08 | 2.01e-01 | 0.0596 |
| 8525 | DGKZ | P1T-E | Human | Esophagus | ESCC | 2.95e-06 | 3.24e-01 | 0.0875 |
| 8525 | DGKZ | P2T-E | Human | Esophagus | ESCC | 3.73e-24 | 4.40e-01 | 0.1177 |
| 8525 | DGKZ | P4T-E | Human | Esophagus | ESCC | 5.16e-17 | 2.46e-01 | 0.1323 |
| 8525 | DGKZ | P5T-E | Human | Esophagus | ESCC | 5.71e-11 | 1.14e-01 | 0.1327 |
| 8525 | DGKZ | P8T-E | Human | Esophagus | ESCC | 6.99e-22 | 3.74e-01 | 0.0889 |
| 8525 | DGKZ | P9T-E | Human | Esophagus | ESCC | 1.66e-14 | 1.76e-01 | 0.1131 |
| 8525 | DGKZ | P10T-E | Human | Esophagus | ESCC | 8.81e-18 | 2.71e-01 | 0.116 |
| 8525 | DGKZ | P11T-E | Human | Esophagus | ESCC | 7.34e-18 | 6.16e-01 | 0.1426 |
| 8525 | DGKZ | P12T-E | Human | Esophagus | ESCC | 2.86e-15 | 2.77e-01 | 0.1122 |
| 8525 | DGKZ | P15T-E | Human | Esophagus | ESCC | 8.12e-22 | 3.08e-01 | 0.1149 |
| 8525 | DGKZ | P16T-E | Human | Esophagus | ESCC | 8.45e-09 | 1.47e-01 | 0.1153 |
| 8525 | DGKZ | P17T-E | Human | Esophagus | ESCC | 1.26e-05 | 2.86e-01 | 0.1278 |
| 8525 | DGKZ | P19T-E | Human | Esophagus | ESCC | 1.25e-04 | 2.87e-01 | 0.1662 |
| 8525 | DGKZ | P20T-E | Human | Esophagus | ESCC | 8.85e-18 | 2.89e-01 | 0.1124 |
| Page: 1 2 3 4 5 6 |
| Tissue | Expression Dynamics | Abbreviation |
| Esophagus | 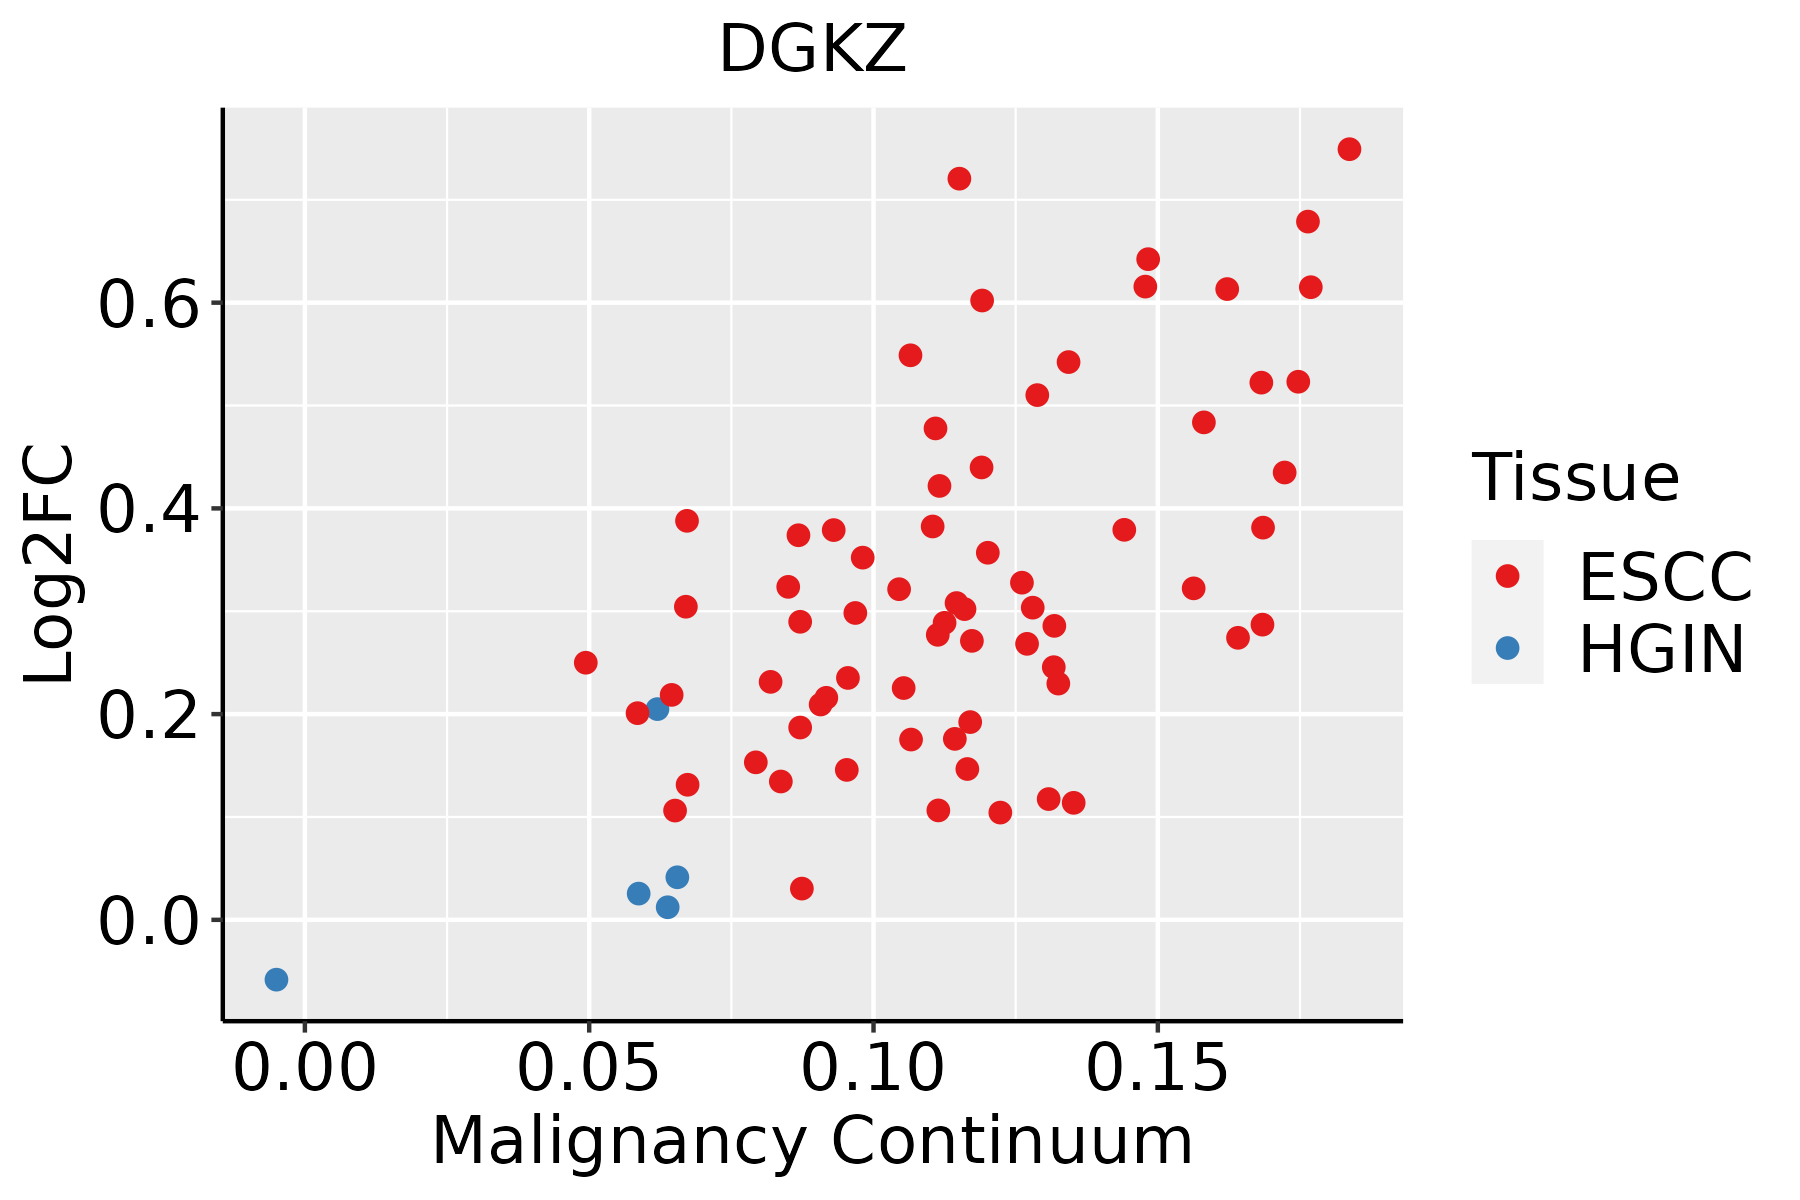 | ESCC: Esophageal squamous cell carcinoma |
| HGIN: High-grade intraepithelial neoplasias | ||
| LGIN: Low-grade intraepithelial neoplasias | ||
| Liver | 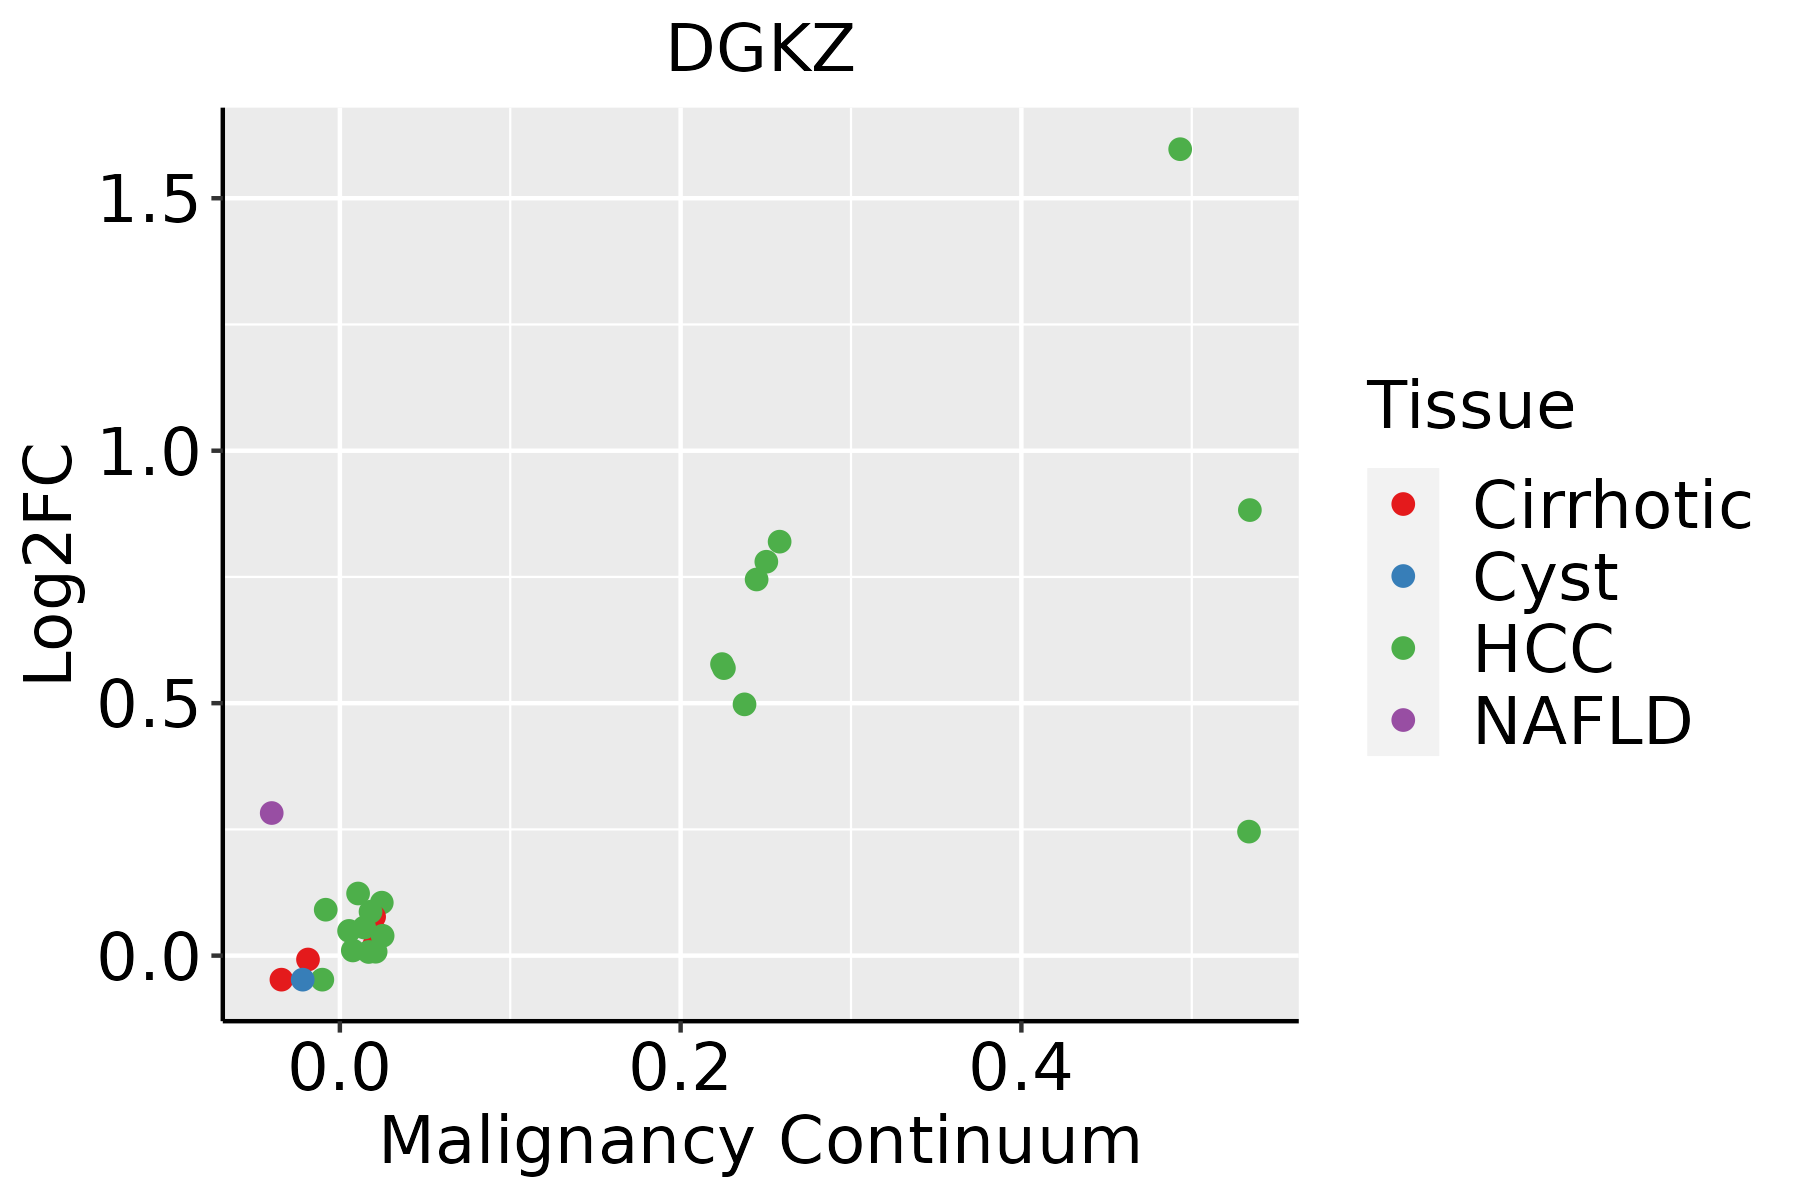 | HCC: Hepatocellular carcinoma |
| NAFLD: Non-alcoholic fatty liver disease | ||
| Oral Cavity |  | EOLP: Erosive Oral lichen planus |
| LP: leukoplakia | ||
| NEOLP: Non-erosive oral lichen planus | ||
| OSCC: Oral squamous cell carcinoma | ||
| Skin |  | AK: Actinic keratosis |
| cSCC: Cutaneous squamous cell carcinoma | ||
| SCCIS:squamous cell carcinoma in situ | ||
| Thyroid |  | ATC: Anaplastic thyroid cancer |
| HT: Hashimoto's thyroiditis | ||
| PTC: Papillary thyroid cancer |
| ∗log2FC in expression of this searched gene in stem-like cells from each diseased tissue sample relative to stem-like cells in normal samples in each tissue plotted against the malignancy continuum. Samples are colored based on if they are from different disease stage. |
Top |
Malignant transformation related pathway analysis |
| Find out the enriched GO biological processes and KEGG pathways involved in transition from healthy to precancer to cancer |
| Tissue | Disease Stage | Enriched GO biological Processes |
| Colorectum | AD |  |
| Colorectum | SER |  |
| Colorectum | MSS |  |
| Colorectum | MSI-H |  |
| Colorectum | FAP |  |
| ∗Top 15 enriched GO BP terms are showed in the bar plot of each disease state in each tissue. Each row represents a significant GO biological process which is colored according to the -log10(p.adjust). |
| Page: 1 2 3 4 5 6 7 8 9 |
| GO ID | Tissue | Disease Stage | Description | Gene Ratio | Bg Ratio | pvalue | p.adjust | Count |
| GO:00086544 | Esophagus | ESCC | phospholipid biosynthetic process | 162/8552 | 253/18723 | 2.59e-09 | 5.73e-08 | 162 |
| GO:00464744 | Esophagus | ESCC | glycerophospholipid biosynthetic process | 135/8552 | 211/18723 | 5.75e-08 | 1.02e-06 | 135 |
| GO:004206027 | Esophagus | ESCC | wound healing | 243/8552 | 422/18723 | 4.62e-07 | 6.25e-06 | 243 |
| GO:00450175 | Esophagus | ESCC | glycerolipid biosynthetic process | 154/8552 | 252/18723 | 5.20e-07 | 6.96e-06 | 154 |
| GO:00066446 | Esophagus | ESCC | phospholipid metabolic process | 218/8552 | 383/18723 | 5.37e-06 | 5.59e-05 | 218 |
| GO:003367420 | Esophagus | ESCC | positive regulation of kinase activity | 260/8552 | 467/18723 | 7.26e-06 | 7.22e-05 | 260 |
| GO:00066505 | Esophagus | ESCC | glycerophospholipid metabolic process | 174/8552 | 306/18723 | 4.92e-05 | 3.85e-04 | 174 |
| GO:00066541 | Esophagus | ESCC | phosphatidic acid biosynthetic process | 26/8552 | 33/18723 | 1.06e-04 | 7.43e-04 | 26 |
| GO:00464733 | Esophagus | ESCC | phosphatidic acid metabolic process | 28/8552 | 37/18723 | 2.00e-04 | 1.26e-03 | 28 |
| GO:00464864 | Esophagus | ESCC | glycerolipid metabolic process | 211/8552 | 392/18723 | 6.51e-04 | 3.46e-03 | 211 |
| GO:000268316 | Esophagus | ESCC | negative regulation of immune system process | 231/8552 | 434/18723 | 8.48e-04 | 4.36e-03 | 231 |
| GO:00508528 | Esophagus | ESCC | T cell receptor signaling pathway | 73/8552 | 123/18723 | 1.54e-03 | 7.24e-03 | 73 |
| GO:00302586 | Esophagus | ESCC | lipid modification | 116/8552 | 212/18723 | 4.90e-03 | 1.89e-02 | 116 |
| GO:00508565 | Esophagus | ESCC | regulation of T cell receptor signaling pathway | 27/8552 | 41/18723 | 7.31e-03 | 2.63e-02 | 27 |
| GO:00192168 | Esophagus | ESCC | regulation of lipid metabolic process | 172/8552 | 331/18723 | 1.20e-02 | 4.02e-02 | 172 |
| GO:00086542 | Liver | HCC | phospholipid biosynthetic process | 150/7958 | 253/18723 | 4.77e-08 | 1.03e-06 | 150 |
| GO:00066444 | Liver | HCC | phospholipid metabolic process | 214/7958 | 383/18723 | 7.25e-08 | 1.48e-06 | 214 |
| GO:004648611 | Liver | HCC | glycerolipid metabolic process | 215/7958 | 392/18723 | 4.54e-07 | 7.49e-06 | 215 |
| GO:004501711 | Liver | HCC | glycerolipid biosynthetic process | 143/7958 | 252/18723 | 3.27e-06 | 4.31e-05 | 143 |
| GO:003025821 | Liver | HCC | lipid modification | 123/7958 | 212/18723 | 3.50e-06 | 4.58e-05 | 123 |
| Page: 1 2 3 4 |
| Pathway ID | Tissue | Disease Stage | Description | Gene Ratio | Bg Ratio | pvalue | p.adjust | qvalue | Count |
| hsa052319 | Esophagus | ESCC | Choline metabolism in cancer | 61/4205 | 98/8465 | 7.97e-03 | 1.92e-02 | 9.84e-03 | 61 |
| hsa0523114 | Esophagus | ESCC | Choline metabolism in cancer | 61/4205 | 98/8465 | 7.97e-03 | 1.92e-02 | 9.84e-03 | 61 |
| hsa005615 | Liver | HCC | Glycerolipid metabolism | 41/4020 | 63/8465 | 3.59e-03 | 1.12e-02 | 6.22e-03 | 41 |
| hsa052316 | Liver | HCC | Choline metabolism in cancer | 57/4020 | 98/8465 | 2.14e-02 | 4.90e-02 | 2.72e-02 | 57 |
| hsa0056112 | Liver | HCC | Glycerolipid metabolism | 41/4020 | 63/8465 | 3.59e-03 | 1.12e-02 | 6.22e-03 | 41 |
| hsa0523111 | Liver | HCC | Choline metabolism in cancer | 57/4020 | 98/8465 | 2.14e-02 | 4.90e-02 | 2.72e-02 | 57 |
| Page: 1 |
Top |
Cell-cell communication analysis |
| Identification of potential cell-cell interactions between two cell types and their ligand-receptor pairs for different disease states |
| Ligand | Receptor | LRpair | Pathway | Tissue | Disease Stage |
| Page: 1 |
Top |
Single-cell gene regulatory network inference analysis |
| Find out the significant the regulons (TFs) and the target genes of each regulon across cell types for different disease states |
| TF | Cell Type | Tissue | Disease Stage | Target Gene | RSS | Regulon Activity |
| ∗The dot plots of a searched regulon are shown for all cell subpopulations in each disease state of each tissue based on the regulon specific score inferred using pySCENIC and by calculating the average expression. |
| Page: 1 |
Top |
Somatic mutation of malignant transformation related genes |
| Annotation of somatic variants for genes involved in malignant transformation |
| Hugo Symbol | Variant Class | Variant Classification | dbSNP RS | HGVSc | HGVSp | HGVSp Short | SWISSPROT | BIOTYPE | SIFT | PolyPhen | Tumor Sample Barcode | Tissue | Histology | Sex | Age | Stage | Therapy Types | Drugs | Outcome |
| DGKZ | SNV | Missense_Mutation | rs372859164 | c.3085N>T | p.Arg1029Cys | p.R1029C | Q13574 | protein_coding | deleterious(0) | probably_damaging(0.953) | TCGA-2W-A8YY-01 | Cervix | cervical & endocervical cancer | Female | <65 | I/II | Chemotherapy | cisplatin | CR |
| DGKZ | SNV | Missense_Mutation | c.2672N>C | p.Gly891Ala | p.G891A | Q13574 | protein_coding | tolerated(0.71) | benign(0.01) | TCGA-DG-A2KK-01 | Cervix | cervical & endocervical cancer | Female | <65 | III/IV | Chemotherapy | cisplatin | SD | |
| DGKZ | SNV | Missense_Mutation | novel | c.1960G>C | p.Glu654Gln | p.E654Q | Q13574 | protein_coding | deleterious(0) | probably_damaging(0.96) | TCGA-EA-A3HU-01 | Cervix | cervical & endocervical cancer | Female | <65 | I/II | Unknown | Unknown | SD |
| DGKZ | SNV | Missense_Mutation | novel | c.3274N>C | p.Asp1092His | p.D1092H | Q13574 | protein_coding | deleterious(0) | probably_damaging(0.99) | TCGA-HM-A4S6-01 | Cervix | cervical & endocervical cancer | Female | <65 | III/IV | Chemotherapy | cisplatin | CR |
| DGKZ | SNV | Missense_Mutation | novel | c.772N>T | p.Pro258Ser | p.P258S | Q13574 | protein_coding | tolerated(0.13) | benign(0.007) | TCGA-JW-A5VL-01 | Cervix | cervical & endocervical cancer | Female | <65 | I/II | Unknown | Unknown | SD |
| DGKZ | SNV | Missense_Mutation | novel | c.927N>C | p.Arg309Ser | p.R309S | Q13574 | protein_coding | deleterious(0.03) | benign(0.04) | TCGA-JW-A5VL-01 | Cervix | cervical & endocervical cancer | Female | <65 | I/II | Unknown | Unknown | SD |
| DGKZ | SNV | Missense_Mutation | novel | c.164N>C | p.Val55Ala | p.V55A | Q13574 | protein_coding | tolerated_low_confidence(0.12) | benign(0) | TCGA-5M-AAT6-01 | Colorectum | colon adenocarcinoma | Female | <65 | III/IV | Unknown | Unknown | PD |
| DGKZ | SNV | Missense_Mutation | c.1265G>T | p.Gly422Val | p.G422V | Q13574 | protein_coding | deleterious(0) | probably_damaging(1) | TCGA-A6-5661-01 | Colorectum | colon adenocarcinoma | Female | >=65 | I/II | Unknown | Unknown | SD | |
| DGKZ | SNV | Missense_Mutation | c.3041C>T | p.Thr1014Met | p.T1014M | Q13574 | protein_coding | deleterious(0.02) | probably_damaging(0.996) | TCGA-A6-5661-01 | Colorectum | colon adenocarcinoma | Female | >=65 | I/II | Unknown | Unknown | SD | |
| DGKZ | SNV | Missense_Mutation | rs368913796 | c.2900C>T | p.Thr967Met | p.T967M | Q13574 | protein_coding | tolerated(0.12) | benign(0.06) | TCGA-AA-3811-01 | Colorectum | colon adenocarcinoma | Female | >=65 | III/IV | Unknown | Unknown | PD |
| Page: 1 2 3 4 5 6 7 8 9 |
Top |
Related drugs of malignant transformation related genes |
| Identification of chemicals and drugs interact with genes involved in malignant transfromation |
| (DGIdb 4.0) |
| Entrez ID | Symbol | Category | Interaction Types | Drug Claim Name | Drug Name | PMIDs |
| Page: 1 |

Copyright 2023-Present -The University of Texas Health Science Center at Houston |