
|
|||||
|
 | |
| |
| |
| |
| |
| |
|
Gene: DGKI |
Gene summary for DGKI |
| Gene information | Species | Human | Gene symbol | DGKI | Gene ID | 9162 |
| Gene name | diacylglycerol kinase iota | |
| Gene Alias | DGK-IOTA | |
| Cytomap | 7q33 | |
| Gene Type | protein-coding | GO ID | GO:0001775 | UniProtAcc | O75912 |
Top |
Malignant transformation analysis |
| Identification of the aberrant gene expression in precancerous and cancerous lesions by comparing the gene expression of stem-like cells in diseased tissues with normal stem cells |
| Entrez ID | Symbol | Replicates | Species | Organ | Tissue | Adj P-value | Log2FC | Malignancy |
| 9162 | DGKI | S014 | Human | Liver | HCC | 1.23e-27 | 8.71e-01 | 0.2254 |
| 9162 | DGKI | S015 | Human | Liver | HCC | 2.85e-07 | 4.19e-01 | 0.2375 |
| 9162 | DGKI | S016 | Human | Liver | HCC | 1.96e-30 | 8.24e-01 | 0.2243 |
| 9162 | DGKI | male-WTA | Human | Thyroid | PTC | 4.77e-06 | 1.09e-02 | 0.1037 |
| 9162 | DGKI | PTC01 | Human | Thyroid | PTC | 2.33e-04 | -8.94e-02 | 0.1899 |
| 9162 | DGKI | PTC06 | Human | Thyroid | PTC | 3.40e-07 | 2.37e-02 | 0.2057 |
| 9162 | DGKI | ATC11 | Human | Thyroid | ATC | 2.56e-04 | 2.74e-01 | 0.3386 |
| 9162 | DGKI | ATC12 | Human | Thyroid | ATC | 3.61e-09 | 1.67e-01 | 0.34 |
| 9162 | DGKI | ATC13 | Human | Thyroid | ATC | 4.27e-05 | -3.44e-02 | 0.34 |
| 9162 | DGKI | ATC3 | Human | Thyroid | ATC | 1.41e-05 | 4.34e-01 | 0.338 |
| 9162 | DGKI | ATC4 | Human | Thyroid | ATC | 6.48e-09 | 2.56e-01 | 0.34 |
| 9162 | DGKI | ATC5 | Human | Thyroid | ATC | 4.33e-13 | -2.48e-02 | 0.34 |
| Page: 1 |
| Tissue | Expression Dynamics | Abbreviation |
| Liver | 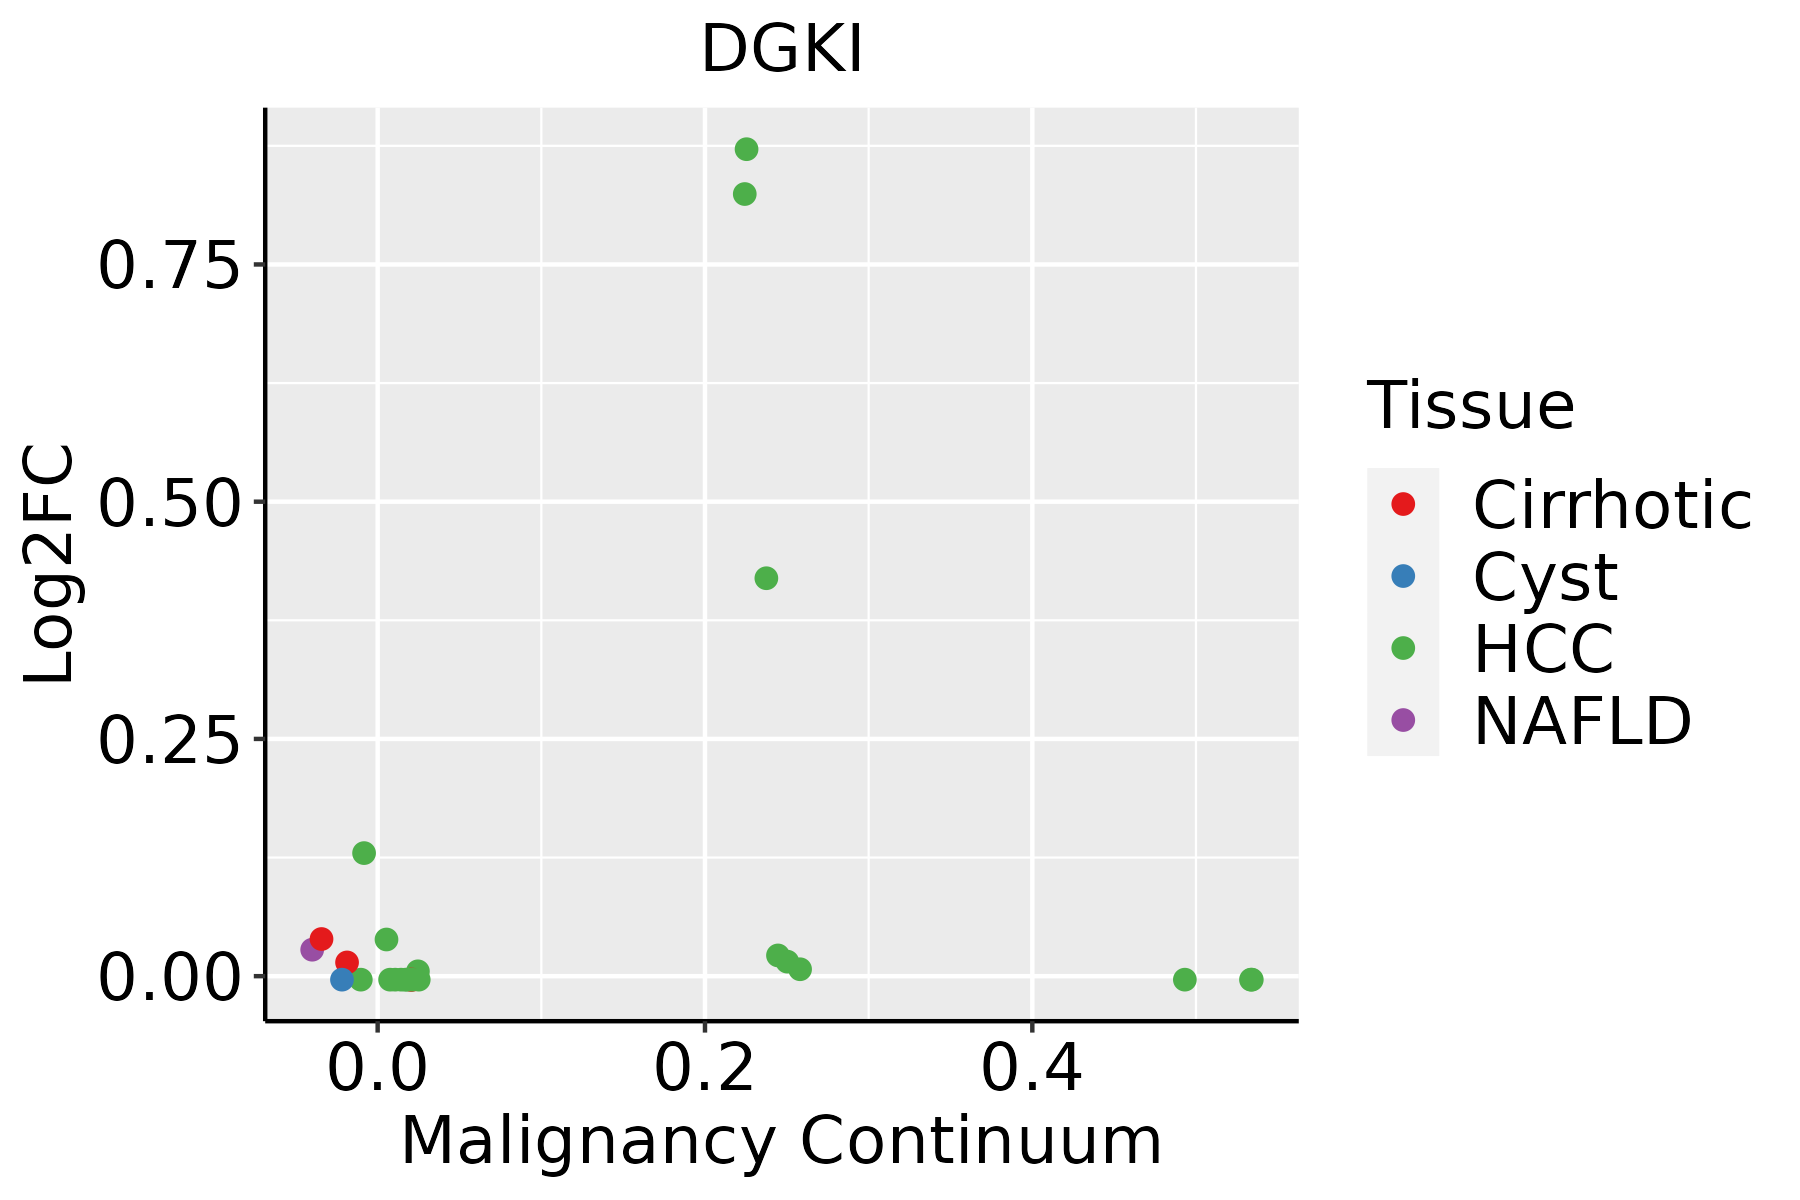 | HCC: Hepatocellular carcinoma |
| NAFLD: Non-alcoholic fatty liver disease | ||
| Thyroid | 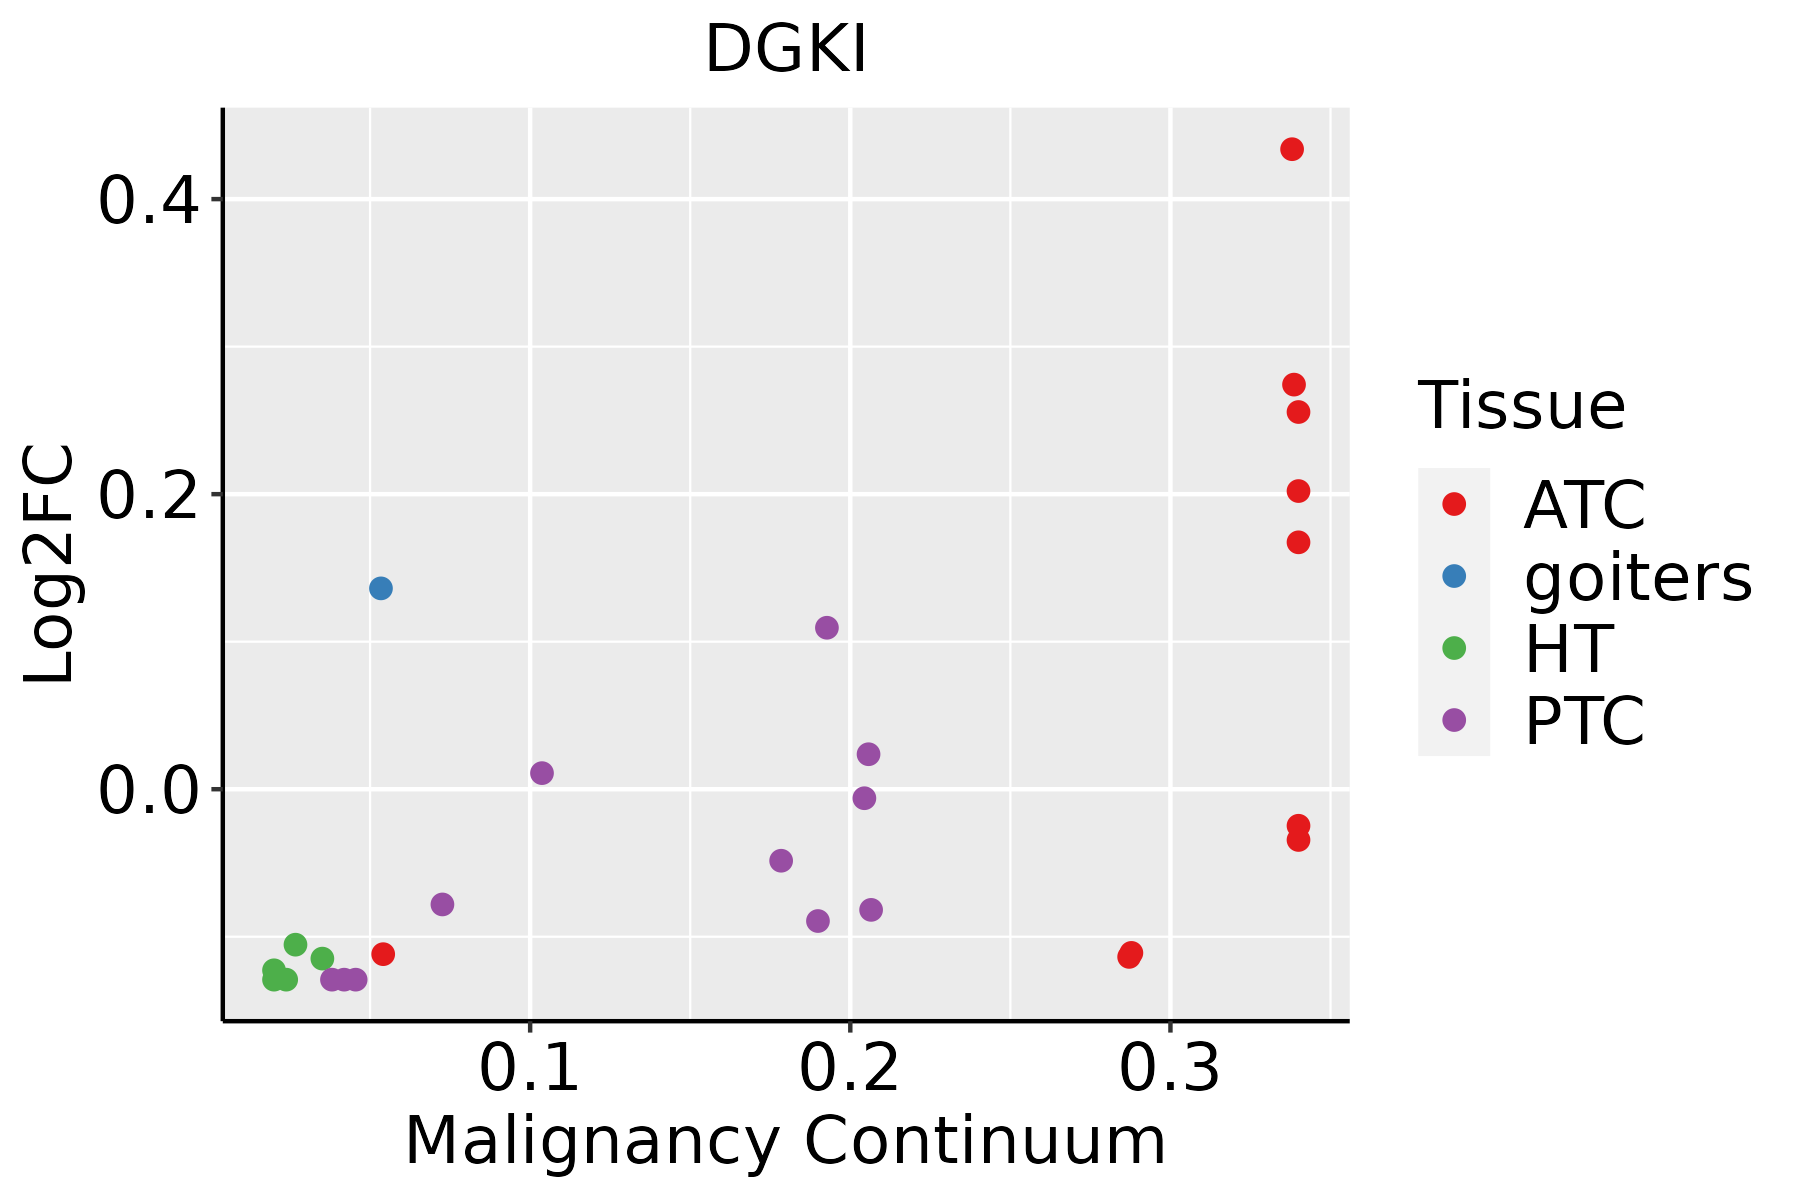 | ATC: Anaplastic thyroid cancer |
| HT: Hashimoto's thyroiditis | ||
| PTC: Papillary thyroid cancer |
| ∗log2FC in expression of this searched gene in stem-like cells from each diseased tissue sample relative to stem-like cells in normal samples in each tissue plotted against the malignancy continuum. Samples are colored based on if they are from different disease stage. |
Top |
Malignant transformation related pathway analysis |
| Find out the enriched GO biological processes and KEGG pathways involved in transition from healthy to precancer to cancer |
| Tissue | Disease Stage | Enriched GO biological Processes |
| Colorectum | AD |  |
| Colorectum | SER |  |
| Colorectum | MSS |  |
| Colorectum | MSI-H |  |
| Colorectum | FAP |  |
| ∗Top 15 enriched GO BP terms are showed in the bar plot of each disease state in each tissue. Each row represents a significant GO biological process which is colored according to the -log10(p.adjust). |
| Page: 1 2 3 4 5 6 7 8 9 |
| GO ID | Tissue | Disease Stage | Description | Gene Ratio | Bg Ratio | pvalue | p.adjust | Count |
| GO:004648611 | Liver | HCC | glycerolipid metabolic process | 215/7958 | 392/18723 | 4.54e-07 | 7.49e-06 | 215 |
| GO:003025821 | Liver | HCC | lipid modification | 123/7958 | 212/18723 | 3.50e-06 | 4.58e-05 | 123 |
| GO:004206022 | Liver | HCC | wound healing | 219/7958 | 422/18723 | 5.34e-05 | 5.04e-04 | 219 |
| GO:00075962 | Liver | HCC | blood coagulation | 118/7958 | 217/18723 | 2.63e-04 | 1.94e-03 | 118 |
| GO:00075992 | Liver | HCC | hemostasis | 119/7958 | 222/18723 | 5.25e-04 | 3.41e-03 | 119 |
| GO:00508172 | Liver | HCC | coagulation | 118/7958 | 222/18723 | 8.41e-04 | 5.03e-03 | 118 |
| GO:005087822 | Liver | HCC | regulation of body fluid levels | 191/7958 | 379/18723 | 1.06e-03 | 6.11e-03 | 191 |
| GO:000663911 | Liver | HCC | acylglycerol metabolic process | 72/7958 | 128/18723 | 1.16e-03 | 6.54e-03 | 72 |
| GO:000663811 | Liver | HCC | neutral lipid metabolic process | 72/7958 | 129/18723 | 1.54e-03 | 8.14e-03 | 72 |
| GO:0042060112 | Thyroid | PTC | wound healing | 190/5968 | 422/18723 | 7.72e-09 | 1.92e-07 | 190 |
| GO:004206034 | Thyroid | ATC | wound healing | 210/6293 | 422/18723 | 3.33e-12 | 1.37e-10 | 210 |
| GO:000759618 | Thyroid | ATC | blood coagulation | 93/6293 | 217/18723 | 2.69e-03 | 1.23e-02 | 93 |
| GO:000759918 | Thyroid | ATC | hemostasis | 94/6293 | 222/18723 | 3.92e-03 | 1.70e-02 | 94 |
| GO:005081718 | Thyroid | ATC | coagulation | 94/6293 | 222/18723 | 3.92e-03 | 1.70e-02 | 94 |
| GO:0050878112 | Thyroid | ATC | regulation of body fluid levels | 149/6293 | 379/18723 | 1.08e-02 | 3.90e-02 | 149 |
| GO:003016813 | Thyroid | ATC | platelet activation | 54/6293 | 123/18723 | 1.10e-02 | 3.95e-02 | 54 |
| Page: 1 |
| Pathway ID | Tissue | Disease Stage | Description | Gene Ratio | Bg Ratio | pvalue | p.adjust | qvalue | Count |
| hsa005615 | Liver | HCC | Glycerolipid metabolism | 41/4020 | 63/8465 | 3.59e-03 | 1.12e-02 | 6.22e-03 | 41 |
| hsa0056112 | Liver | HCC | Glycerolipid metabolism | 41/4020 | 63/8465 | 3.59e-03 | 1.12e-02 | 6.22e-03 | 41 |
| Page: 1 |
Top |
Cell-cell communication analysis |
| Identification of potential cell-cell interactions between two cell types and their ligand-receptor pairs for different disease states |
| Ligand | Receptor | LRpair | Pathway | Tissue | Disease Stage |
| Page: 1 |
Top |
Single-cell gene regulatory network inference analysis |
| Find out the significant the regulons (TFs) and the target genes of each regulon across cell types for different disease states |
| TF | Cell Type | Tissue | Disease Stage | Target Gene | RSS | Regulon Activity |
| ∗The dot plots of a searched regulon are shown for all cell subpopulations in each disease state of each tissue based on the regulon specific score inferred using pySCENIC and by calculating the average expression. |
| Page: 1 |
Top |
Somatic mutation of malignant transformation related genes |
| Annotation of somatic variants for genes involved in malignant transformation |
| Hugo Symbol | Variant Class | Variant Classification | dbSNP RS | HGVSc | HGVSp | HGVSp Short | SWISSPROT | BIOTYPE | SIFT | PolyPhen | Tumor Sample Barcode | Tissue | Histology | Sex | Age | Stage | Therapy Types | Drugs | Outcome |
| DGKI | SNV | Missense_Mutation | c.710N>T | p.Arg237Leu | p.R237L | O75912 | protein_coding | deleterious(0) | probably_damaging(0.984) | TCGA-A1-A0SO-01 | Breast | breast invasive carcinoma | Female | >=65 | I/II | Chemotherapy | SD | ||
| DGKI | SNV | Missense_Mutation | novel | c.2897C>T | p.Ala966Val | p.A966V | O75912 | protein_coding | deleterious(0) | probably_damaging(0.992) | TCGA-A2-A0T3-01 | Breast | breast invasive carcinoma | Female | <65 | I/II | Chemotherapy | adriamycin | SD |
| DGKI | SNV | Missense_Mutation | c.1615G>T | p.Val539Phe | p.V539F | O75912 | protein_coding | deleterious(0) | probably_damaging(0.992) | TCGA-AN-A0AT-01 | Breast | breast invasive carcinoma | Female | <65 | I/II | Unknown | Unknown | SD | |
| DGKI | SNV | Missense_Mutation | c.1496N>A | p.Arg499His | p.R499H | O75912 | protein_coding | deleterious(0.01) | probably_damaging(1) | TCGA-AN-A0FV-01 | Breast | breast invasive carcinoma | Female | <65 | I/II | Unknown | Unknown | SD | |
| DGKI | SNV | Missense_Mutation | rs200760549 | c.2209N>A | p.Glu737Lys | p.E737K | O75912 | protein_coding | deleterious(0.01) | possibly_damaging(0.889) | TCGA-BH-A1FN-01 | Breast | breast invasive carcinoma | Female | <65 | I/II | Unknown | Unknown | PD |
| DGKI | SNV | Missense_Mutation | c.824N>G | p.Ser275Cys | p.S275C | O75912 | protein_coding | deleterious(0) | probably_damaging(0.984) | TCGA-D8-A1JA-01 | Breast | breast invasive carcinoma | Female | <65 | III/IV | Chemotherapy | adriamycin | PD | |
| DGKI | insertion | Frame_Shift_Ins | novel | c.2979_2980insGAGTGCCTGCTATGTGTTAG | p.Thr994GlufsTer35 | p.T994Efs*35 | O75912 | protein_coding | TCGA-AO-A03R-01 | Breast | breast invasive carcinoma | Female | <65 | I/II | Chemotherapy | doxorubicin | SD | ||
| DGKI | insertion | Nonsense_Mutation | novel | c.1429_1430insGATTTGGAAGGGAGAAGTTA | p.Tyr477Ter | p.Y477* | O75912 | protein_coding | TCGA-AO-A128-01 | Breast | breast invasive carcinoma | Female | <65 | I/II | Chemotherapy | doxorubicin | SD | ||
| DGKI | deletion | Frame_Shift_Del | novel | c.1320delN | p.Trp440Ter | p.W440* | O75912 | protein_coding | TCGA-EW-A2FV-01 | Breast | breast invasive carcinoma | Female | <65 | III/IV | Chemotherapy | docetaxel | SD | ||
| DGKI | SNV | Missense_Mutation | rs141499171 | c.2666G>A | p.Arg889Gln | p.R889Q | O75912 | protein_coding | tolerated(0.1) | benign(0.081) | TCGA-EK-A3GN-01 | Cervix | cervical & endocervical cancer | Female | <65 | III/IV | Unknown | Unknown | SD |
| Page: 1 2 3 4 5 6 7 8 9 10 11 12 13 14 15 16 17 18 |
Top |
Related drugs of malignant transformation related genes |
| Identification of chemicals and drugs interact with genes involved in malignant transfromation |
| (DGIdb 4.0) |
| Entrez ID | Symbol | Category | Interaction Types | Drug Claim Name | Drug Name | PMIDs |
| Page: 1 |

Copyright 2023-Present -The University of Texas Health Science Center at Houston |