
|
|||||
|
 | |
| |
| |
| |
| |
| |
|
Gene: DGKE |
Gene summary for DGKE |
| Gene information | Species | Human | Gene symbol | DGKE | Gene ID | 8526 |
| Gene name | diacylglycerol kinase epsilon | |
| Gene Alias | AHUS7 | |
| Cytomap | 17q22 | |
| Gene Type | protein-coding | GO ID | GO:0001775 | UniProtAcc | A1L4Q0 |
Top |
Malignant transformation analysis |
| Identification of the aberrant gene expression in precancerous and cancerous lesions by comparing the gene expression of stem-like cells in diseased tissues with normal stem cells |
| Entrez ID | Symbol | Replicates | Species | Organ | Tissue | Adj P-value | Log2FC | Malignancy |
| 8526 | DGKE | LZE4T | Human | Esophagus | ESCC | 3.39e-05 | 1.95e-01 | 0.0811 |
| 8526 | DGKE | LZE24T | Human | Esophagus | ESCC | 1.56e-05 | 2.12e-01 | 0.0596 |
| 8526 | DGKE | P2T-E | Human | Esophagus | ESCC | 1.51e-08 | 2.02e-01 | 0.1177 |
| 8526 | DGKE | P4T-E | Human | Esophagus | ESCC | 3.47e-03 | 1.16e-01 | 0.1323 |
| 8526 | DGKE | P8T-E | Human | Esophagus | ESCC | 3.79e-06 | 1.19e-01 | 0.0889 |
| 8526 | DGKE | P9T-E | Human | Esophagus | ESCC | 2.02e-05 | 1.16e-01 | 0.1131 |
| 8526 | DGKE | P10T-E | Human | Esophagus | ESCC | 2.57e-06 | 1.40e-01 | 0.116 |
| 8526 | DGKE | P12T-E | Human | Esophagus | ESCC | 4.28e-14 | 2.46e-01 | 0.1122 |
| 8526 | DGKE | P15T-E | Human | Esophagus | ESCC | 7.38e-08 | 1.28e-01 | 0.1149 |
| 8526 | DGKE | P16T-E | Human | Esophagus | ESCC | 1.82e-11 | 1.85e-01 | 0.1153 |
| 8526 | DGKE | P21T-E | Human | Esophagus | ESCC | 1.34e-10 | 2.12e-01 | 0.1617 |
| 8526 | DGKE | P22T-E | Human | Esophagus | ESCC | 8.95e-05 | 2.50e-02 | 0.1236 |
| 8526 | DGKE | P23T-E | Human | Esophagus | ESCC | 7.79e-19 | 4.79e-01 | 0.108 |
| 8526 | DGKE | P24T-E | Human | Esophagus | ESCC | 3.24e-02 | 5.90e-02 | 0.1287 |
| 8526 | DGKE | P26T-E | Human | Esophagus | ESCC | 3.18e-11 | 2.18e-01 | 0.1276 |
| 8526 | DGKE | P27T-E | Human | Esophagus | ESCC | 2.14e-11 | 1.31e-01 | 0.1055 |
| 8526 | DGKE | P28T-E | Human | Esophagus | ESCC | 1.49e-15 | 2.94e-01 | 0.1149 |
| 8526 | DGKE | P30T-E | Human | Esophagus | ESCC | 2.21e-12 | 5.33e-01 | 0.137 |
| 8526 | DGKE | P31T-E | Human | Esophagus | ESCC | 7.29e-11 | 1.31e-01 | 0.1251 |
| 8526 | DGKE | P32T-E | Human | Esophagus | ESCC | 3.99e-12 | 1.23e-01 | 0.1666 |
| Page: 1 2 3 |
| Tissue | Expression Dynamics | Abbreviation |
| Esophagus | 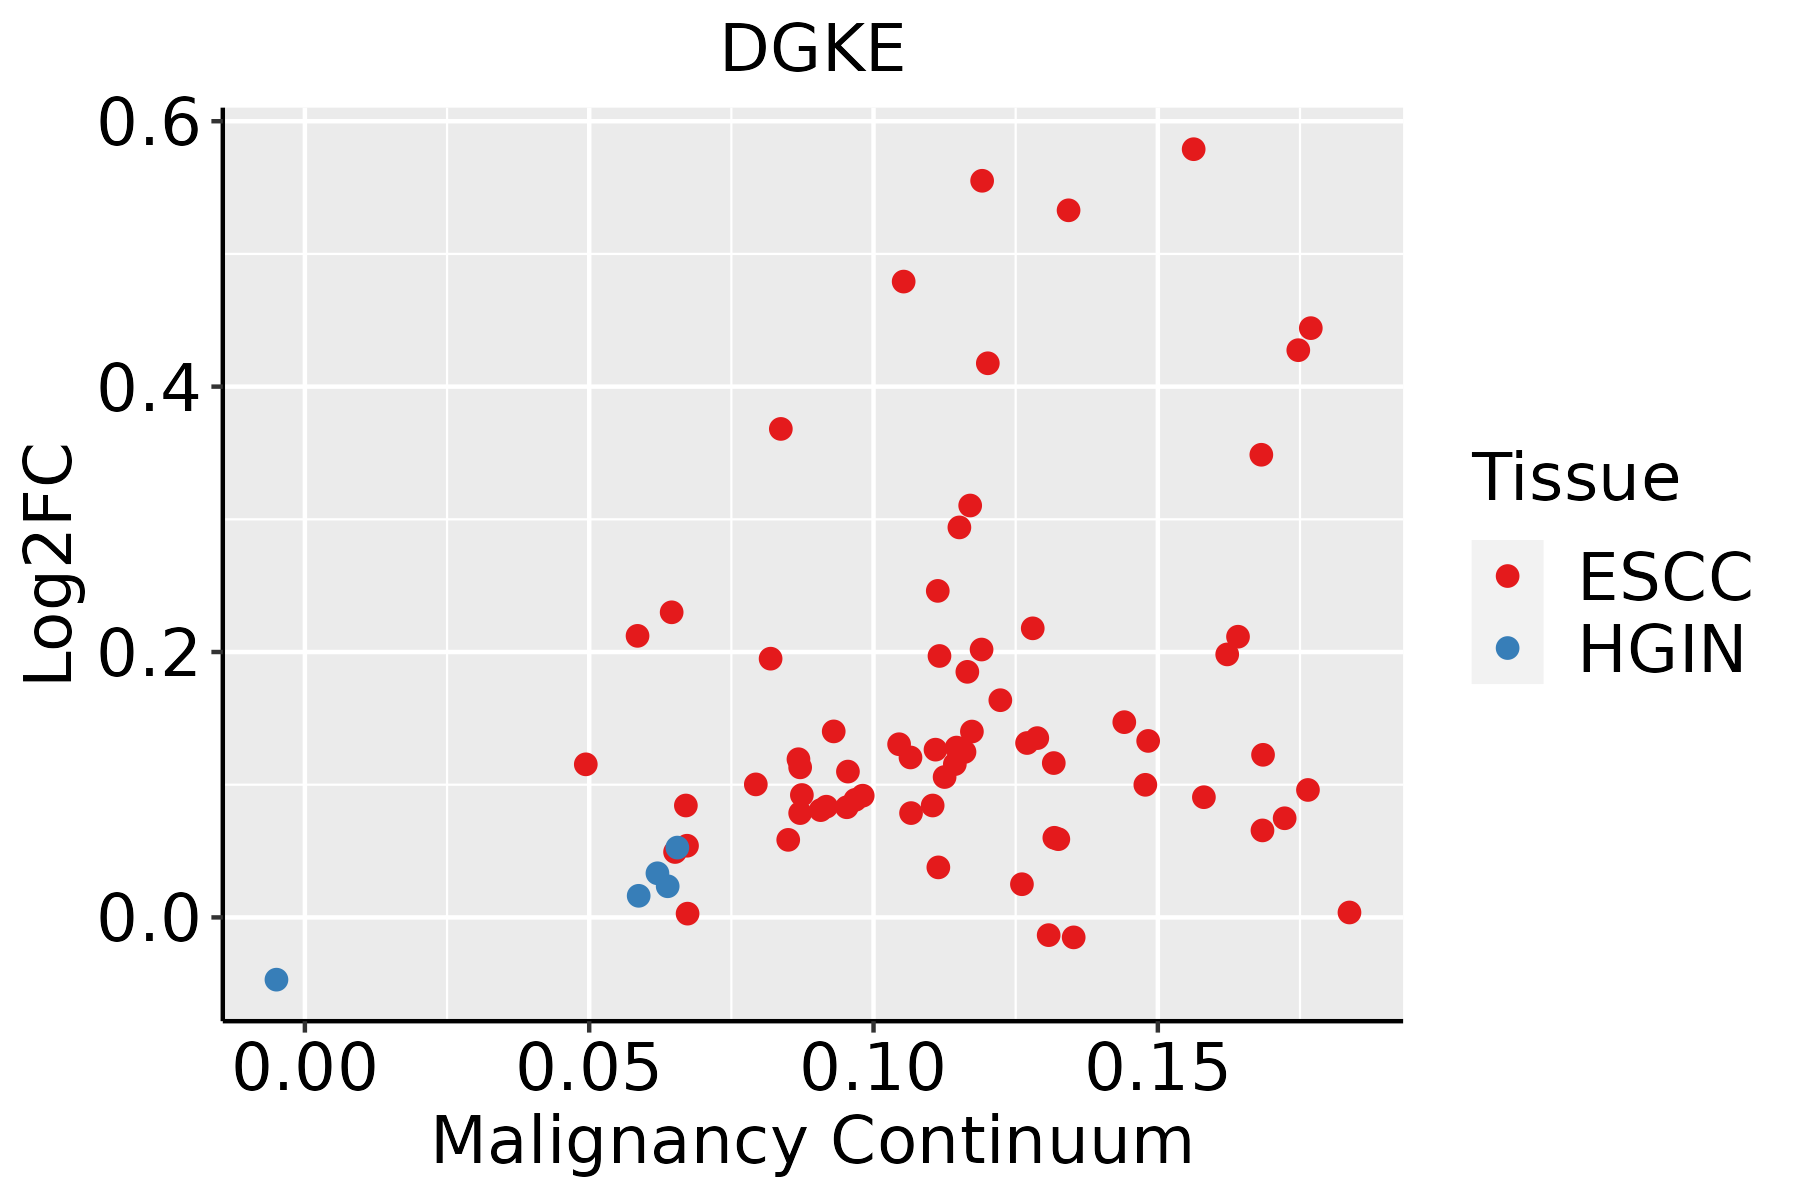 | ESCC: Esophageal squamous cell carcinoma |
| HGIN: High-grade intraepithelial neoplasias | ||
| LGIN: Low-grade intraepithelial neoplasias |
| ∗log2FC in expression of this searched gene in stem-like cells from each diseased tissue sample relative to stem-like cells in normal samples in each tissue plotted against the malignancy continuum. Samples are colored based on if they are from different disease stage. |
Top |
Malignant transformation related pathway analysis |
| Find out the enriched GO biological processes and KEGG pathways involved in transition from healthy to precancer to cancer |
| Tissue | Disease Stage | Enriched GO biological Processes |
| Colorectum | AD |  |
| Colorectum | SER |  |
| Colorectum | MSS |  |
| Colorectum | MSI-H |  |
| Colorectum | FAP |  |
| ∗Top 15 enriched GO BP terms are showed in the bar plot of each disease state in each tissue. Each row represents a significant GO biological process which is colored according to the -log10(p.adjust). |
| Page: 1 2 3 4 5 6 7 8 9 |
| GO ID | Tissue | Disease Stage | Description | Gene Ratio | Bg Ratio | pvalue | p.adjust | Count |
| GO:00086544 | Esophagus | ESCC | phospholipid biosynthetic process | 162/8552 | 253/18723 | 2.59e-09 | 5.73e-08 | 162 |
| GO:00464744 | Esophagus | ESCC | glycerophospholipid biosynthetic process | 135/8552 | 211/18723 | 5.75e-08 | 1.02e-06 | 135 |
| GO:004206027 | Esophagus | ESCC | wound healing | 243/8552 | 422/18723 | 4.62e-07 | 6.25e-06 | 243 |
| GO:00450175 | Esophagus | ESCC | glycerolipid biosynthetic process | 154/8552 | 252/18723 | 5.20e-07 | 6.96e-06 | 154 |
| GO:00066446 | Esophagus | ESCC | phospholipid metabolic process | 218/8552 | 383/18723 | 5.37e-06 | 5.59e-05 | 218 |
| GO:00066505 | Esophagus | ESCC | glycerophospholipid metabolic process | 174/8552 | 306/18723 | 4.92e-05 | 3.85e-04 | 174 |
| GO:00066541 | Esophagus | ESCC | phosphatidic acid biosynthetic process | 26/8552 | 33/18723 | 1.06e-04 | 7.43e-04 | 26 |
| GO:00464733 | Esophagus | ESCC | phosphatidic acid metabolic process | 28/8552 | 37/18723 | 2.00e-04 | 1.26e-03 | 28 |
| GO:00464864 | Esophagus | ESCC | glycerolipid metabolic process | 211/8552 | 392/18723 | 6.51e-04 | 3.46e-03 | 211 |
| GO:00302586 | Esophagus | ESCC | lipid modification | 116/8552 | 212/18723 | 4.90e-03 | 1.89e-02 | 116 |
| GO:00066611 | Esophagus | ESCC | phosphatidylinositol biosynthetic process | 73/8552 | 131/18723 | 1.31e-02 | 4.28e-02 | 73 |
| Page: 1 |
| Pathway ID | Tissue | Disease Stage | Description | Gene Ratio | Bg Ratio | pvalue | p.adjust | qvalue | Count |
| hsa052319 | Esophagus | ESCC | Choline metabolism in cancer | 61/4205 | 98/8465 | 7.97e-03 | 1.92e-02 | 9.84e-03 | 61 |
| hsa0523114 | Esophagus | ESCC | Choline metabolism in cancer | 61/4205 | 98/8465 | 7.97e-03 | 1.92e-02 | 9.84e-03 | 61 |
| Page: 1 |
Top |
Cell-cell communication analysis |
| Identification of potential cell-cell interactions between two cell types and their ligand-receptor pairs for different disease states |
| Ligand | Receptor | LRpair | Pathway | Tissue | Disease Stage |
| Page: 1 |
Top |
Single-cell gene regulatory network inference analysis |
| Find out the significant the regulons (TFs) and the target genes of each regulon across cell types for different disease states |
| TF | Cell Type | Tissue | Disease Stage | Target Gene | RSS | Regulon Activity |
| ∗The dot plots of a searched regulon are shown for all cell subpopulations in each disease state of each tissue based on the regulon specific score inferred using pySCENIC and by calculating the average expression. |
| Page: 1 |
Top |
Somatic mutation of malignant transformation related genes |
| Annotation of somatic variants for genes involved in malignant transformation |
| Hugo Symbol | Variant Class | Variant Classification | dbSNP RS | HGVSc | HGVSp | HGVSp Short | SWISSPROT | BIOTYPE | SIFT | PolyPhen | Tumor Sample Barcode | Tissue | Histology | Sex | Age | Stage | Therapy Types | Drugs | Outcome |
| DGKE | SNV | Missense_Mutation | c.1042N>C | p.Asp348His | p.D348H | P52429 | protein_coding | deleterious(0) | probably_damaging(1) | TCGA-A8-A08L-01 | Breast | breast invasive carcinoma | Female | >=65 | III/IV | Unknown | Unknown | SD | |
| DGKE | SNV | Missense_Mutation | rs373335233 | c.58N>T | p.Gly20Trp | p.G20W | P52429 | protein_coding | tolerated_low_confidence(0.07) | benign(0) | TCGA-AC-A23H-01 | Breast | breast invasive carcinoma | Female | >=65 | I/II | Unknown | Unknown | PD |
| DGKE | SNV | Missense_Mutation | c.698N>C | p.Gly233Ala | p.G233A | P52429 | protein_coding | deleterious(0.05) | probably_damaging(0.979) | TCGA-AC-A23H-01 | Breast | breast invasive carcinoma | Female | >=65 | I/II | Unknown | Unknown | PD | |
| DGKE | SNV | Missense_Mutation | c.1165N>T | p.His389Tyr | p.H389Y | P52429 | protein_coding | tolerated(0.06) | possibly_damaging(0.786) | TCGA-AN-A0XW-01 | Breast | breast invasive carcinoma | Female | <65 | III/IV | Unknown | Unknown | SD | |
| DGKE | SNV | Missense_Mutation | novel | c.1580A>C | p.Gln527Pro | p.Q527P | P52429 | protein_coding | deleterious(0) | probably_damaging(0.984) | TCGA-B6-A0RE-01 | Breast | breast invasive carcinoma | Female | <65 | I/II | Unknown | Unknown | SD |
| DGKE | SNV | Missense_Mutation | c.1490A>T | p.Asn497Ile | p.N497I | P52429 | protein_coding | deleterious(0.02) | possibly_damaging(0.837) | TCGA-D8-A1XK-01 | Breast | breast invasive carcinoma | Female | <65 | I/II | Chemotherapy | doxorubicine+cyclophosphamide | SD | |
| DGKE | SNV | Missense_Mutation | c.224N>C | p.Cys75Ser | p.C75S | P52429 | protein_coding | tolerated(1) | benign(0.003) | TCGA-DS-A1OB-01 | Cervix | cervical & endocervical cancer | Female | <65 | I/II | Chemotherapy | carboplatin | PD | |
| DGKE | SNV | Missense_Mutation | c.1027N>A | p.Asp343Asn | p.D343N | P52429 | protein_coding | tolerated(0.11) | benign(0.062) | TCGA-EK-A2RC-01 | Cervix | cervical & endocervical cancer | Female | <65 | I/II | Unknown | Unknown | SD | |
| DGKE | insertion | In_Frame_Ins | novel | c.222_223insCTT | p.Cys74_Cys75insLeu | p.C74_C75insL | P52429 | protein_coding | TCGA-DS-A1OB-01 | Cervix | cervical & endocervical cancer | Female | <65 | I/II | Chemotherapy | carboplatin | PD | ||
| DGKE | insertion | Frame_Shift_Ins | novel | c.299_300insT | p.Arg100SerfsTer17 | p.R100Sfs*17 | P52429 | protein_coding | TCGA-DS-A1OB-01 | Cervix | cervical & endocervical cancer | Female | <65 | I/II | Chemotherapy | carboplatin | PD |
| Page: 1 2 3 4 5 6 7 |
Top |
Related drugs of malignant transformation related genes |
| Identification of chemicals and drugs interact with genes involved in malignant transfromation |
| (DGIdb 4.0) |
| Entrez ID | Symbol | Category | Interaction Types | Drug Claim Name | Drug Name | PMIDs |
| Page: 1 |

Copyright 2023-Present -The University of Texas Health Science Center at Houston |