| Tissue | Expression Dynamics | Abbreviation |
| Colorectum (GSE201348) |  | FAP: Familial adenomatous polyposis |
| CRC: Colorectal cancer |
| Colorectum (HTA11) |  | AD: Adenomas |
| SER: Sessile serrated lesions |
| MSI-H: Microsatellite-high colorectal cancer |
| MSS: Microsatellite stable colorectal cancer |
| Esophagus | 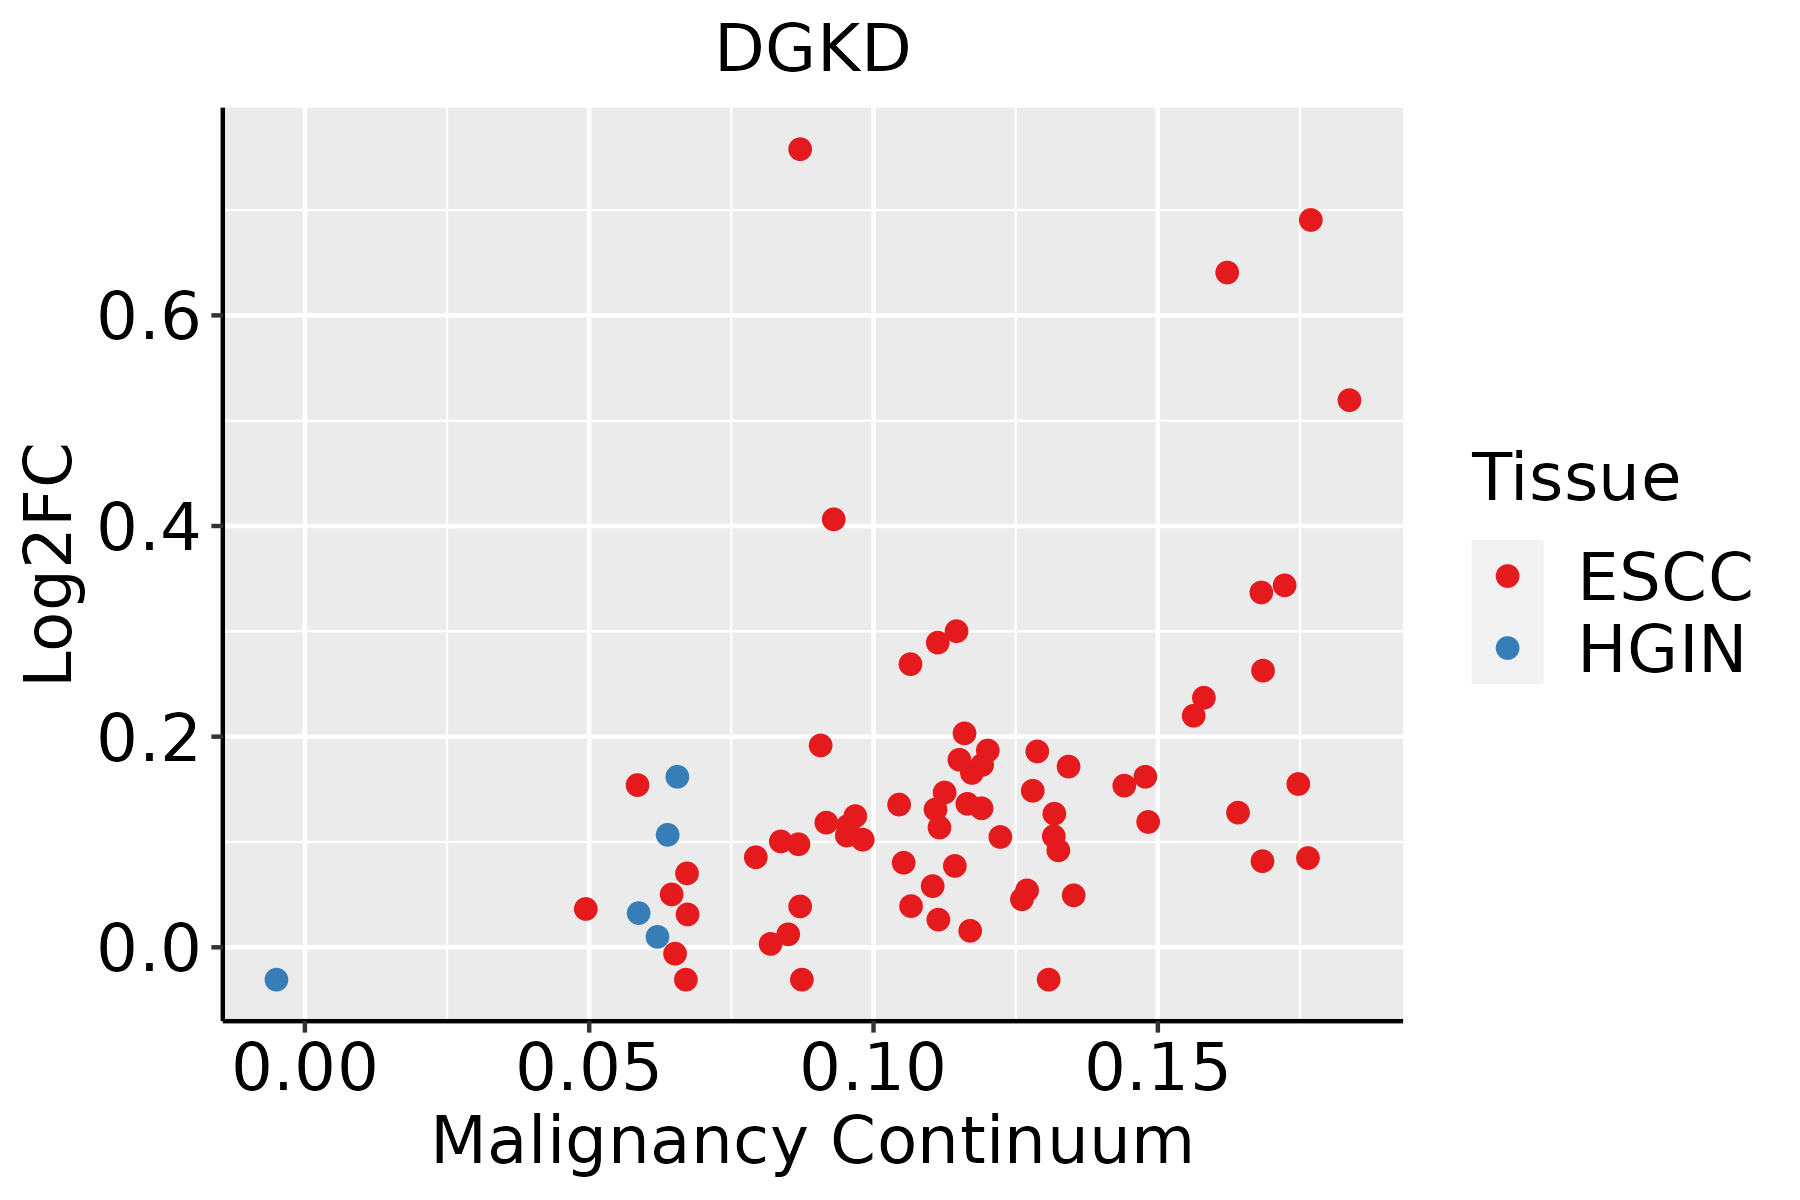 | ESCC: Esophageal squamous cell carcinoma |
| HGIN: High-grade intraepithelial neoplasias |
| LGIN: Low-grade intraepithelial neoplasias |
| Liver | 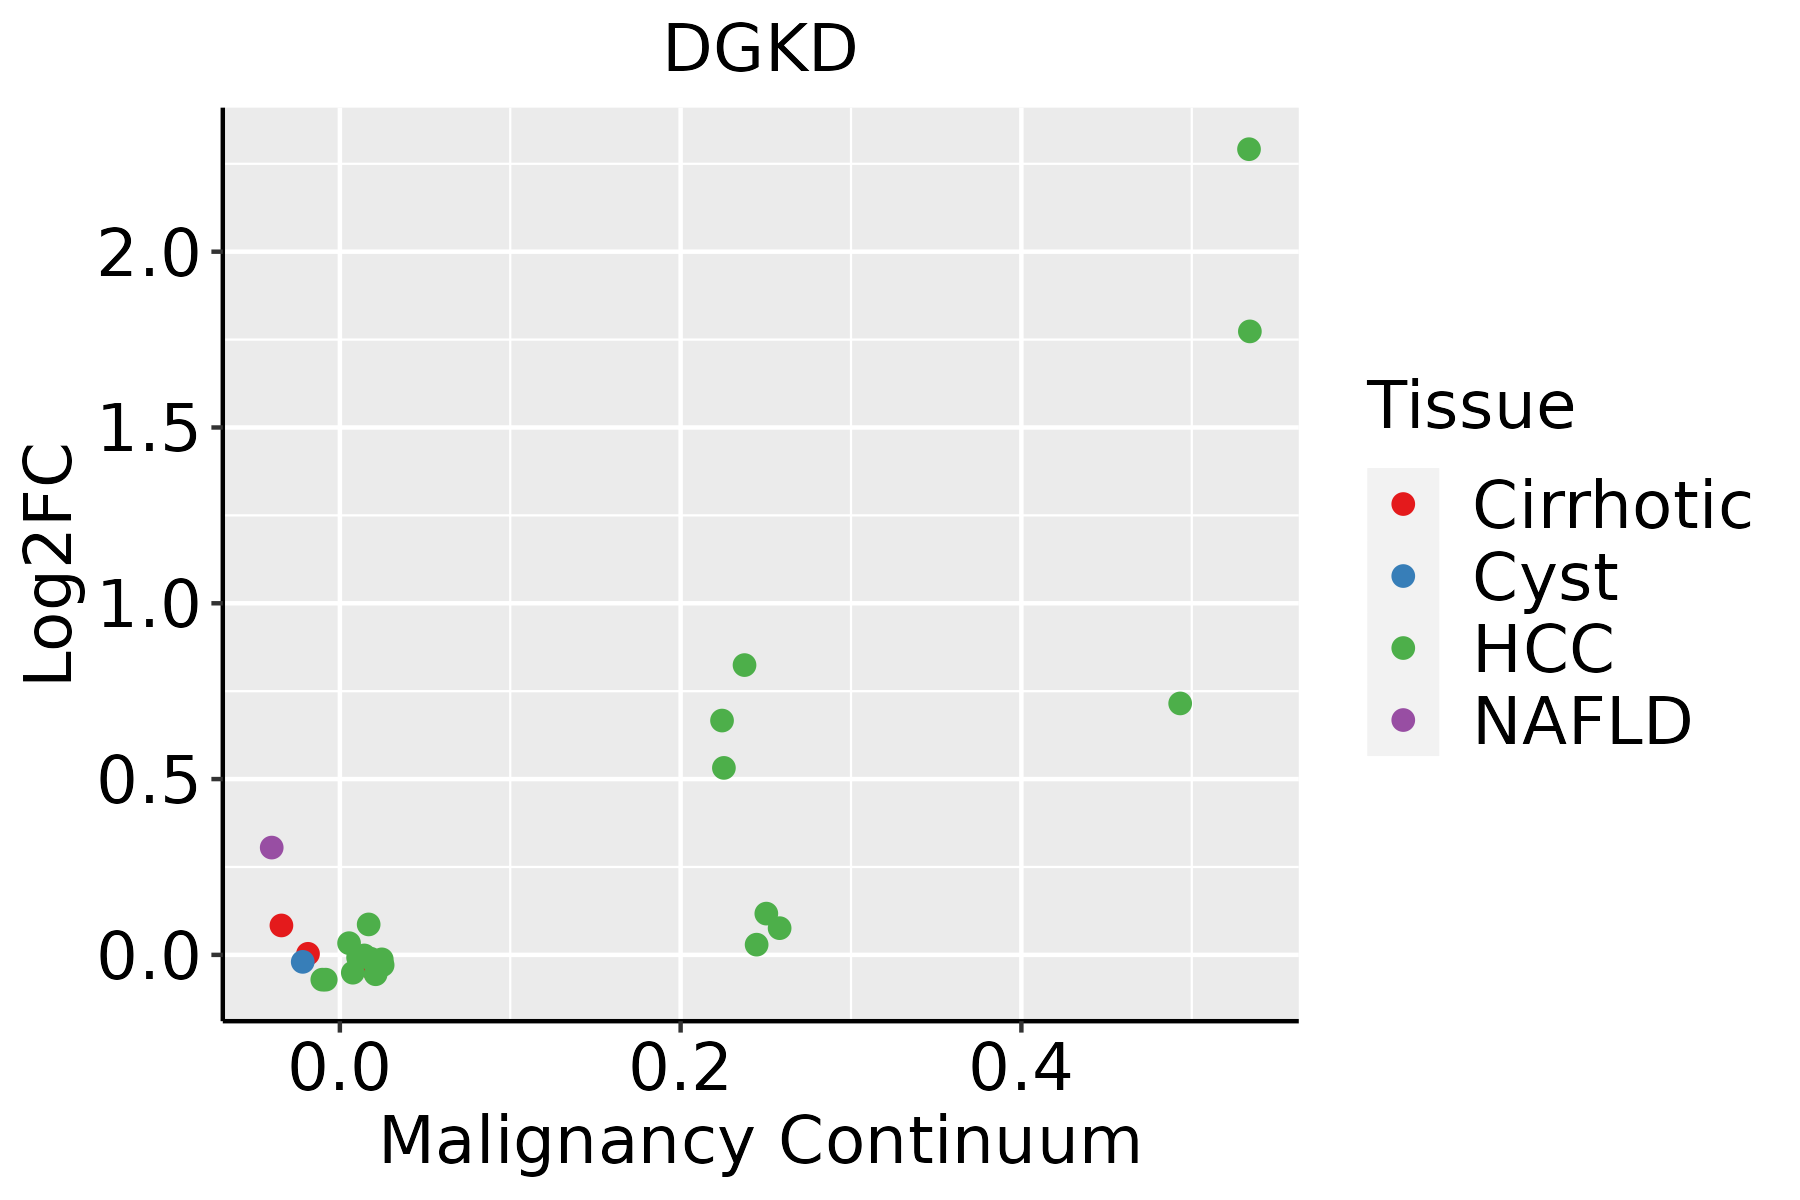 | HCC: Hepatocellular carcinoma |
| NAFLD: Non-alcoholic fatty liver disease |
| Lung | 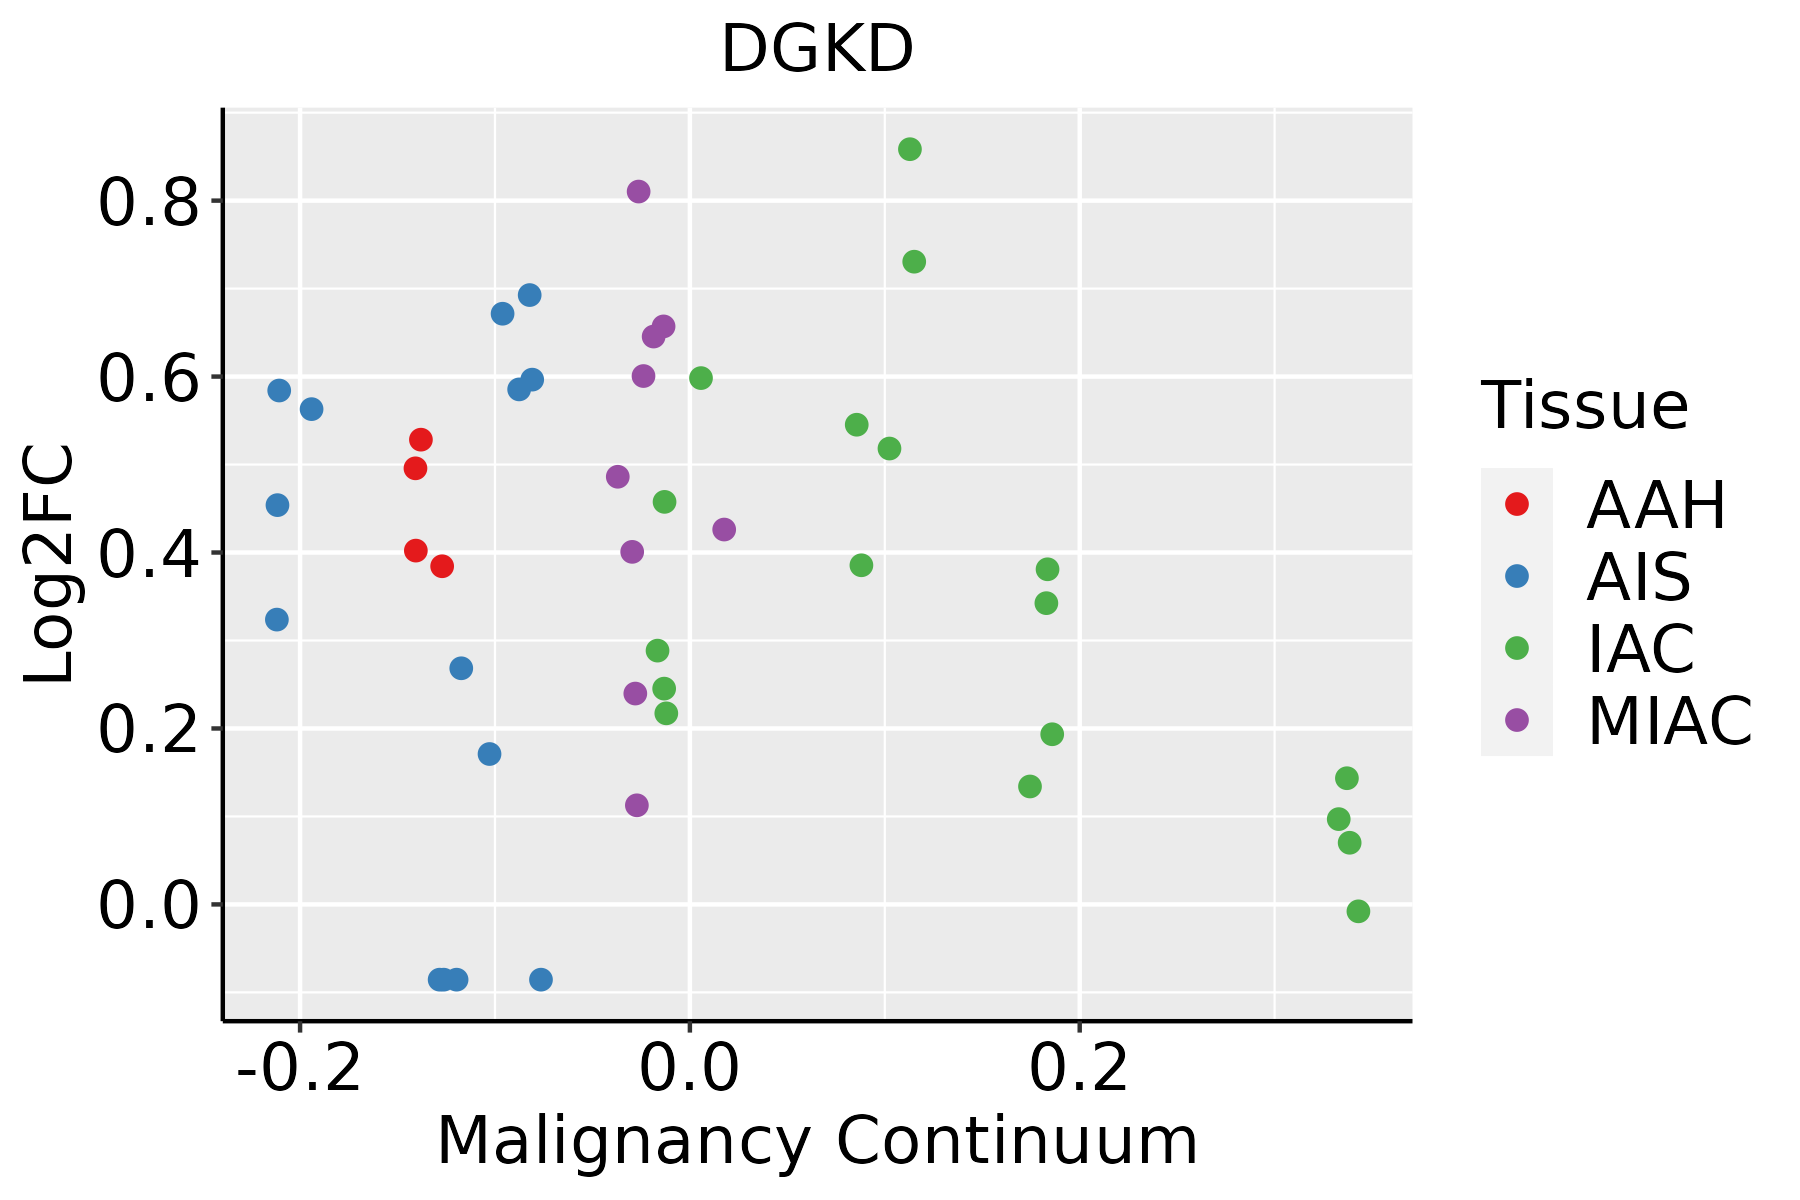 | AAH: Atypical adenomatous hyperplasia |
| AIS: Adenocarcinoma in situ |
| IAC: Invasive lung adenocarcinoma |
| MIA: Minimally invasive adenocarcinoma |
| Thyroid | 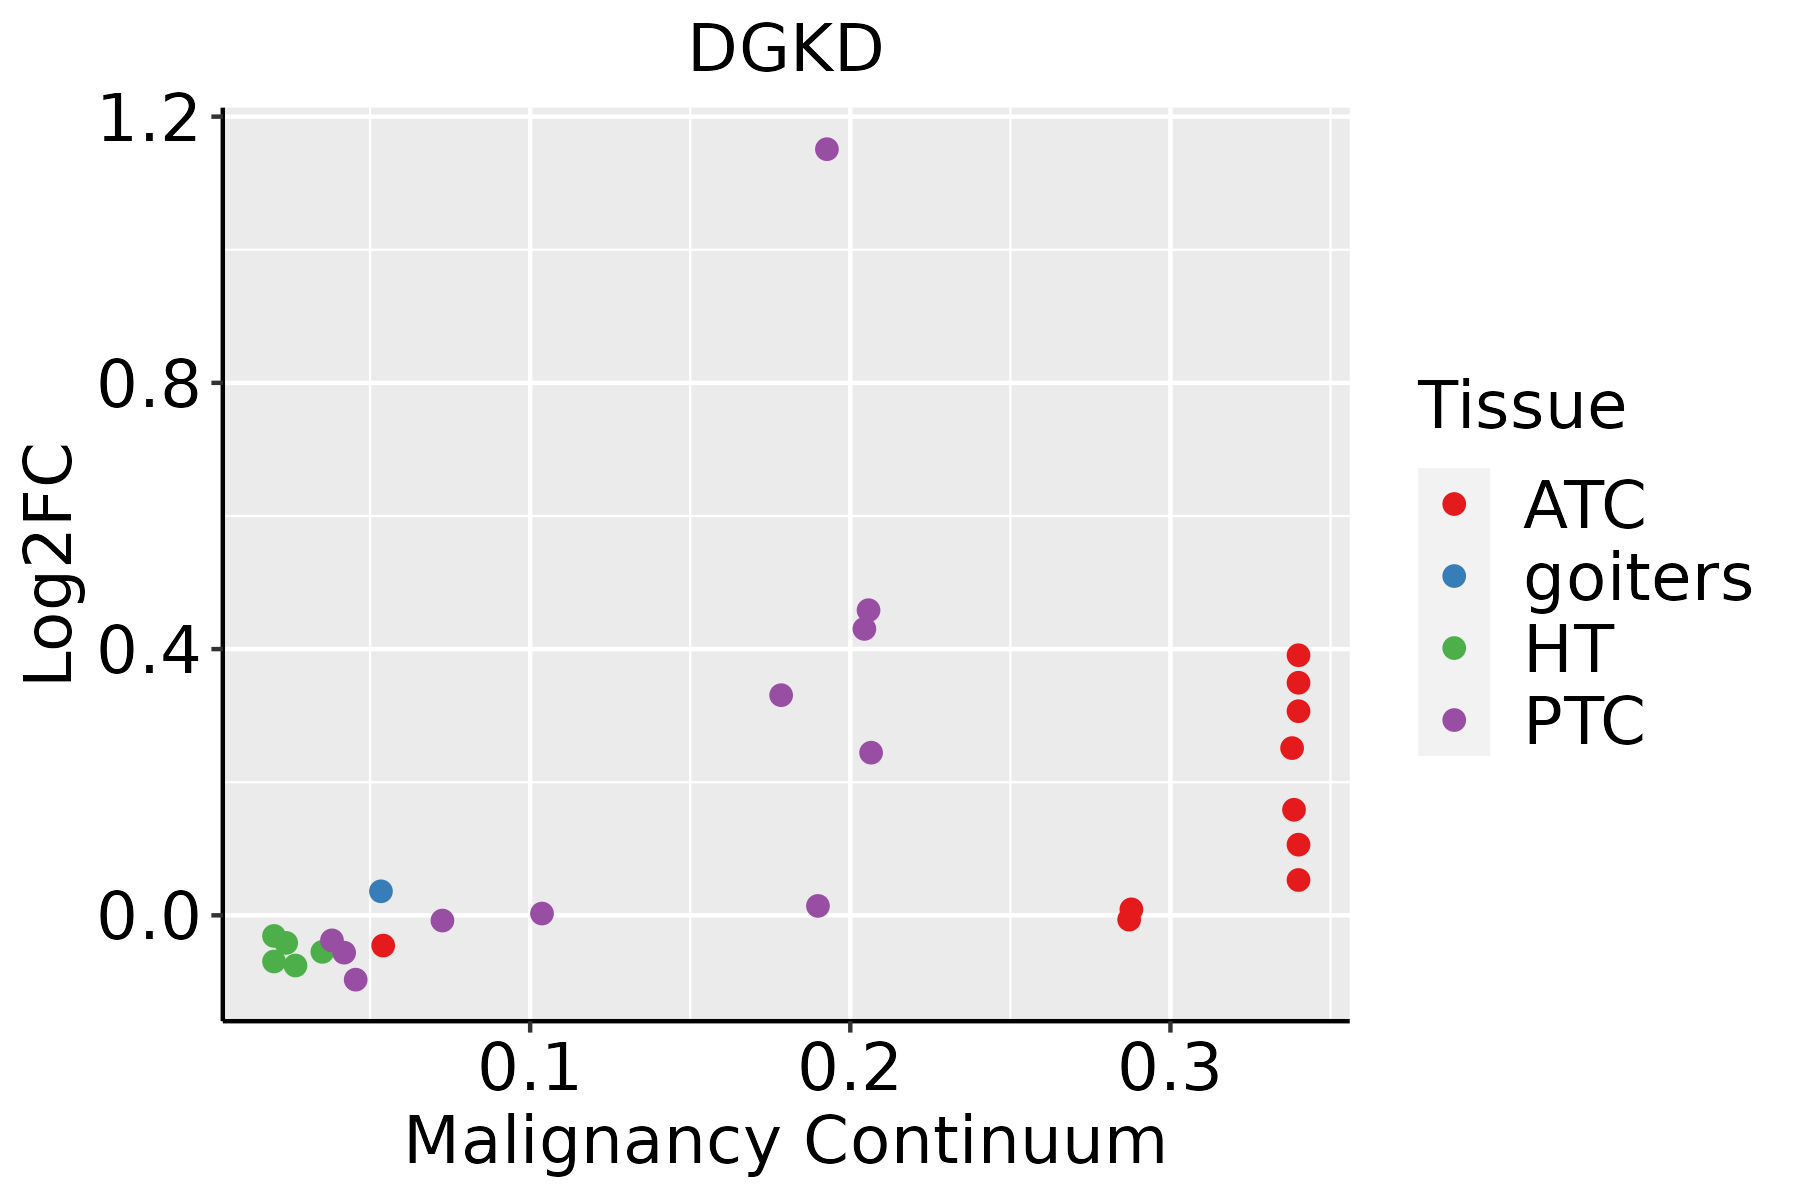 | ATC: Anaplastic thyroid cancer |
| HT: Hashimoto's thyroiditis |
| PTC: Papillary thyroid cancer |
| GO ID | Tissue | Disease Stage | Description | Gene Ratio | Bg Ratio | pvalue | p.adjust | Count |
| GO:0038127 | Colorectum | AD | ERBB signaling pathway | 55/3918 | 121/18723 | 1.19e-09 | 8.85e-08 | 55 |
| GO:0007173 | Colorectum | AD | epidermal growth factor receptor signaling pathway | 50/3918 | 108/18723 | 3.08e-09 | 2.07e-07 | 50 |
| GO:0042060 | Colorectum | AD | wound healing | 128/3918 | 422/18723 | 2.73e-06 | 7.89e-05 | 128 |
| GO:0072583 | Colorectum | AD | clathrin-dependent endocytosis | 24/3918 | 47/18723 | 4.60e-06 | 1.22e-04 | 24 |
| GO:1901184 | Colorectum | AD | regulation of ERBB signaling pathway | 34/3918 | 79/18723 | 7.46e-06 | 1.82e-04 | 34 |
| GO:0042058 | Colorectum | AD | regulation of epidermal growth factor receptor signaling pathway | 31/3918 | 73/18723 | 2.56e-05 | 4.89e-04 | 31 |
| GO:0006898 | Colorectum | AD | receptor-mediated endocytosis | 76/3918 | 244/18723 | 1.07e-04 | 1.59e-03 | 76 |
| GO:0030100 | Colorectum | AD | regulation of endocytosis | 67/3918 | 211/18723 | 1.42e-04 | 2.01e-03 | 67 |
| GO:0030258 | Colorectum | AD | lipid modification | 67/3918 | 212/18723 | 1.66e-04 | 2.27e-03 | 67 |
| GO:0050878 | Colorectum | AD | regulation of body fluid levels | 108/3918 | 379/18723 | 2.54e-04 | 3.20e-03 | 108 |
| GO:0045807 | Colorectum | AD | positive regulation of endocytosis | 35/3918 | 100/18723 | 7.78e-04 | 7.78e-03 | 35 |
| GO:0048260 | Colorectum | AD | positive regulation of receptor-mediated endocytosis | 20/3918 | 52/18723 | 2.87e-03 | 2.14e-02 | 20 |
| GO:0048259 | Colorectum | AD | regulation of receptor-mediated endocytosis | 35/3918 | 110/18723 | 4.85e-03 | 3.27e-02 | 35 |
| GO:0006650 | Colorectum | AD | glycerophospholipid metabolic process | 83/3918 | 306/18723 | 5.40e-03 | 3.55e-02 | 83 |
| GO:0006644 | Colorectum | AD | phospholipid metabolic process | 101/3918 | 383/18723 | 5.80e-03 | 3.67e-02 | 101 |
| GO:0045017 | Colorectum | AD | glycerolipid biosynthetic process | 69/3918 | 252/18723 | 8.33e-03 | 4.88e-02 | 69 |
| GO:00071732 | Colorectum | MSS | epidermal growth factor receptor signaling pathway | 43/3467 | 108/18723 | 1.92e-07 | 8.31e-06 | 43 |
| GO:00381272 | Colorectum | MSS | ERBB signaling pathway | 46/3467 | 121/18723 | 3.63e-07 | 1.45e-05 | 46 |
| GO:00420602 | Colorectum | MSS | wound healing | 119/3467 | 422/18723 | 5.93e-07 | 2.24e-05 | 119 |
| GO:00725831 | Colorectum | MSS | clathrin-dependent endocytosis | 22/3467 | 47/18723 | 8.74e-06 | 2.16e-04 | 22 |
| Pathway ID | Tissue | Disease Stage | Description | Gene Ratio | Bg Ratio | pvalue | p.adjust | qvalue | Count |
| hsa00561 | Colorectum | AD | Glycerolipid metabolism | 24/2092 | 63/8465 | 1.25e-02 | 4.54e-02 | 2.90e-02 | 24 |
| hsa005611 | Colorectum | AD | Glycerolipid metabolism | 24/2092 | 63/8465 | 1.25e-02 | 4.54e-02 | 2.90e-02 | 24 |
| hsa05231 | Colorectum | MSS | Choline metabolism in cancer | 34/1875 | 98/8465 | 2.90e-03 | 1.39e-02 | 8.50e-03 | 34 |
| hsa005612 | Colorectum | MSS | Glycerolipid metabolism | 23/1875 | 63/8465 | 6.55e-03 | 2.64e-02 | 1.62e-02 | 23 |
| hsa052311 | Colorectum | MSS | Choline metabolism in cancer | 34/1875 | 98/8465 | 2.90e-03 | 1.39e-02 | 8.50e-03 | 34 |
| hsa005613 | Colorectum | MSS | Glycerolipid metabolism | 23/1875 | 63/8465 | 6.55e-03 | 2.64e-02 | 1.62e-02 | 23 |
| hsa052312 | Colorectum | FAP | Choline metabolism in cancer | 29/1404 | 98/8465 | 9.03e-04 | 5.20e-03 | 3.16e-03 | 29 |
| hsa052313 | Colorectum | FAP | Choline metabolism in cancer | 29/1404 | 98/8465 | 9.03e-04 | 5.20e-03 | 3.16e-03 | 29 |
| hsa04070 | Colorectum | CRC | Phosphatidylinositol signaling system | 25/1091 | 97/8465 | 4.27e-04 | 4.60e-03 | 3.12e-03 | 25 |
| hsa052314 | Colorectum | CRC | Choline metabolism in cancer | 24/1091 | 98/8465 | 1.21e-03 | 9.84e-03 | 6.67e-03 | 24 |
| hsa040701 | Colorectum | CRC | Phosphatidylinositol signaling system | 25/1091 | 97/8465 | 4.27e-04 | 4.60e-03 | 3.12e-03 | 25 |
| hsa052315 | Colorectum | CRC | Choline metabolism in cancer | 24/1091 | 98/8465 | 1.21e-03 | 9.84e-03 | 6.67e-03 | 24 |
| hsa052319 | Esophagus | ESCC | Choline metabolism in cancer | 61/4205 | 98/8465 | 7.97e-03 | 1.92e-02 | 9.84e-03 | 61 |
| hsa0523114 | Esophagus | ESCC | Choline metabolism in cancer | 61/4205 | 98/8465 | 7.97e-03 | 1.92e-02 | 9.84e-03 | 61 |
| hsa005615 | Liver | HCC | Glycerolipid metabolism | 41/4020 | 63/8465 | 3.59e-03 | 1.12e-02 | 6.22e-03 | 41 |
| hsa052316 | Liver | HCC | Choline metabolism in cancer | 57/4020 | 98/8465 | 2.14e-02 | 4.90e-02 | 2.72e-02 | 57 |
| hsa0056112 | Liver | HCC | Glycerolipid metabolism | 41/4020 | 63/8465 | 3.59e-03 | 1.12e-02 | 6.22e-03 | 41 |
| hsa0523111 | Liver | HCC | Choline metabolism in cancer | 57/4020 | 98/8465 | 2.14e-02 | 4.90e-02 | 2.72e-02 | 57 |
| hsa052317 | Lung | IAC | Choline metabolism in cancer | 23/1053 | 98/8465 | 1.72e-03 | 9.66e-03 | 6.41e-03 | 23 |
| hsa04072 | Lung | IAC | Phospholipase D signaling pathway | 28/1053 | 148/8465 | 1.46e-02 | 5.00e-02 | 3.32e-02 | 28 |
| Hugo Symbol | Variant Class | Variant Classification | dbSNP RS | HGVSc | HGVSp | HGVSp Short | SWISSPROT | BIOTYPE | SIFT | PolyPhen | Tumor Sample Barcode | Tissue | Histology | Sex | Age | Stage | Therapy Types | Drugs | Outcome |
| DGKD | SNV | Missense_Mutation | | c.1259N>T | p.Ser420Leu | p.S420L | Q16760 | protein_coding | deleterious(0.01) | benign(0.358) | TCGA-AC-A23H-01 | Breast | breast invasive carcinoma | Female | >=65 | I/II | Unknown | Unknown | PD |
| DGKD | SNV | Missense_Mutation | rs754657046 | c.1396N>A | p.Glu466Lys | p.E466K | Q16760 | protein_coding | tolerated(0.22) | benign(0.047) | TCGA-AN-A046-01 | Breast | breast invasive carcinoma | Female | >=65 | I/II | Unknown | Unknown | SD |
| DGKD | SNV | Missense_Mutation | rs753381810 | c.1663N>A | p.Asp555Asn | p.D555N | Q16760 | protein_coding | deleterious(0.03) | benign(0.067) | TCGA-AQ-A04H-01 | Breast | breast invasive carcinoma | Female | <65 | III/IV | Chemotherapy | taxotere | SD |
| DGKD | SNV | Missense_Mutation | | c.583N>A | p.Glu195Lys | p.E195K | Q16760 | protein_coding | deleterious(0.02) | benign(0.381) | TCGA-BH-A0HF-01 | Breast | breast invasive carcinoma | Female | >=65 | I/II | Hormone Therapy | arimidex | SD |
| DGKD | SNV | Missense_Mutation | | c.1421T>C | p.Val474Ala | p.V474A | Q16760 | protein_coding | tolerated(0.26) | benign(0.01) | TCGA-BH-A18G-01 | Breast | breast invasive carcinoma | Female | >=65 | I/II | Unknown | Unknown | SD |
| DGKD | SNV | Missense_Mutation | rs758673209 | c.896N>T | p.Thr299Met | p.T299M | Q16760 | protein_coding | deleterious(0) | benign(0.295) | TCGA-D8-A1JA-01 | Breast | breast invasive carcinoma | Female | <65 | III/IV | Chemotherapy | adriamycin | PD |
| DGKD | SNV | Missense_Mutation | | c.3572N>T | p.Lys1191Met | p.K1191M | Q16760 | protein_coding | deleterious(0) | probably_damaging(1) | TCGA-EW-A1P4-01 | Breast | breast invasive carcinoma | Female | <65 | I/II | Chemotherapy | docetaxel | SD |
| DGKD | SNV | Missense_Mutation | novel | c.2219N>T | p.Arg740Leu | p.R740L | Q16760 | protein_coding | tolerated(0.73) | benign(0.006) | TCGA-GM-A3XG-01 | Breast | breast invasive carcinoma | Female | <65 | III/IV | Chemotherapy | paclitaxel | CR |
| DGKD | SNV | Missense_Mutation | novel | c.1081N>A | p.Leu361Ile | p.L361I | Q16760 | protein_coding | tolerated(0.06) | possibly_damaging(0.524) | TCGA-OL-A66J-01 | Breast | breast invasive carcinoma | Female | >=65 | I/II | Unknown | Unknown | SD |
| DGKD | insertion | Frame_Shift_Ins | novel | c.265_266insTTGATGGCGTGTCGGGCTGGGGGCTTTCTGCAGCCTTCCCTGTTCC | p.Lys89IlefsTer21 | p.K89Ifs*21 | Q16760 | protein_coding | | | TCGA-A2-A0EQ-01 | Breast | breast invasive carcinoma | Female | <65 | I/II | Chemotherapy | adriamycin | SD |


