
|
|||||
|
 | |
| |
| |
| |
| |
| |
|
Gene: DGKB |
Gene summary for DGKB |
| Gene information | Species | Human | Gene symbol | DGKB | Gene ID | 1607 |
| Gene name | diacylglycerol kinase beta | |
| Gene Alias | DAGK2 | |
| Cytomap | 7p21.2 | |
| Gene Type | protein-coding | GO ID | GO:0001775 | UniProtAcc | Q9Y6T7 |
Top |
Malignant transformation analysis |
| Identification of the aberrant gene expression in precancerous and cancerous lesions by comparing the gene expression of stem-like cells in diseased tissues with normal stem cells |
| Entrez ID | Symbol | Replicates | Species | Organ | Tissue | Adj P-value | Log2FC | Malignancy |
| 1607 | DGKB | HCC1_Meng | Human | Liver | HCC | 3.38e-03 | -3.04e-02 | 0.0246 |
| 1607 | DGKB | HCC1 | Human | Liver | HCC | 1.05e-12 | 2.01e+00 | 0.5336 |
| 1607 | DGKB | HCC2 | Human | Liver | HCC | 4.48e-17 | 2.27e+00 | 0.5341 |
| 1607 | DGKB | HCC5 | Human | Liver | HCC | 4.03e-11 | 1.39e+00 | 0.4932 |
| 1607 | DGKB | HTA12-15-2 | Human | Pancreas | PDAC | 1.66e-14 | 9.82e-01 | 0.2315 |
| 1607 | DGKB | HTA12-23-1 | Human | Pancreas | PDAC | 8.00e-12 | 1.12e+00 | 0.3405 |
| 1607 | DGKB | HTA12-25-1 | Human | Pancreas | PDAC | 3.07e-08 | 7.26e-01 | 0.313 |
| 1607 | DGKB | HTA12-26-1 | Human | Pancreas | PDAC | 2.45e-25 | 1.28e+00 | 0.3728 |
| 1607 | DGKB | HTA12-29-1 | Human | Pancreas | PDAC | 2.25e-25 | 8.40e-01 | 0.3722 |
| 1607 | DGKB | HTA12-30-1 | Human | Pancreas | PDAC | 1.14e-02 | 9.73e-01 | 0.3671 |
| 1607 | DGKB | HTA12-32-1 | Human | Pancreas | PDAC | 1.46e-03 | 7.32e-01 | 0.3624 |
| 1607 | DGKB | HTA12-9-3 | Human | Pancreas | PDAC | 1.07e-02 | 5.47e-01 | 0.2045 |
| Page: 1 |
| Tissue | Expression Dynamics | Abbreviation |
| Liver | 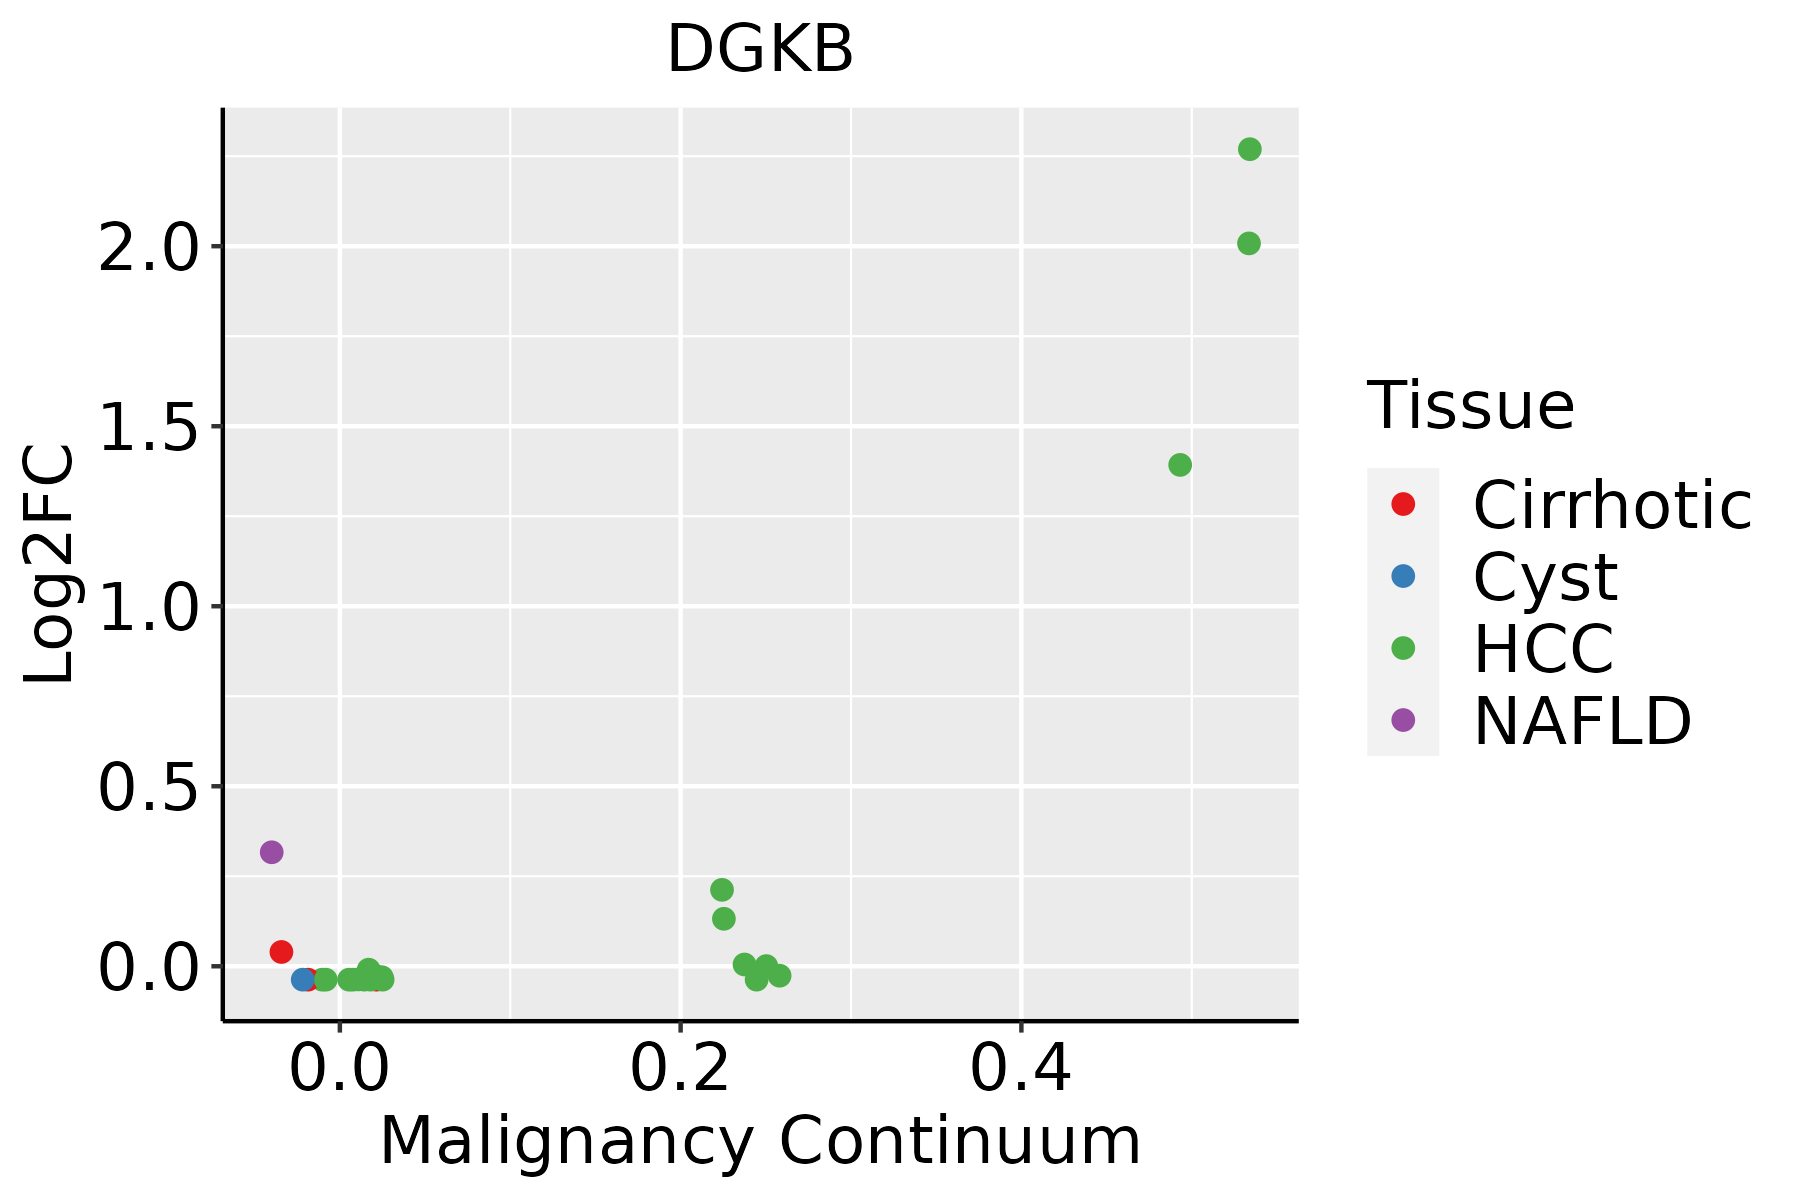 | HCC: Hepatocellular carcinoma |
| NAFLD: Non-alcoholic fatty liver disease |
| ∗log2FC in expression of this searched gene in stem-like cells from each diseased tissue sample relative to stem-like cells in normal samples in each tissue plotted against the malignancy continuum. Samples are colored based on if they are from different disease stage. |
Top |
Malignant transformation related pathway analysis |
| Find out the enriched GO biological processes and KEGG pathways involved in transition from healthy to precancer to cancer |
| Tissue | Disease Stage | Enriched GO biological Processes |
| Colorectum | AD |  |
| Colorectum | SER |  |
| Colorectum | MSS |  |
| Colorectum | MSI-H |  |
| Colorectum | FAP |  |
| ∗Top 15 enriched GO BP terms are showed in the bar plot of each disease state in each tissue. Each row represents a significant GO biological process which is colored according to the -log10(p.adjust). |
| Page: 1 2 3 4 5 6 7 8 9 |
| GO ID | Tissue | Disease Stage | Description | Gene Ratio | Bg Ratio | pvalue | p.adjust | Count |
| GO:00086542 | Liver | HCC | phospholipid biosynthetic process | 150/7958 | 253/18723 | 4.77e-08 | 1.03e-06 | 150 |
| GO:00066444 | Liver | HCC | phospholipid metabolic process | 214/7958 | 383/18723 | 7.25e-08 | 1.48e-06 | 214 |
| GO:004648611 | Liver | HCC | glycerolipid metabolic process | 215/7958 | 392/18723 | 4.54e-07 | 7.49e-06 | 215 |
| GO:004501711 | Liver | HCC | glycerolipid biosynthetic process | 143/7958 | 252/18723 | 3.27e-06 | 4.31e-05 | 143 |
| GO:003025821 | Liver | HCC | lipid modification | 123/7958 | 212/18723 | 3.50e-06 | 4.58e-05 | 123 |
| GO:00066504 | Liver | HCC | glycerophospholipid metabolic process | 168/7958 | 306/18723 | 7.27e-06 | 8.62e-05 | 168 |
| GO:004647411 | Liver | HCC | glycerophospholipid biosynthetic process | 121/7958 | 211/18723 | 9.12e-06 | 1.06e-04 | 121 |
| GO:004206022 | Liver | HCC | wound healing | 219/7958 | 422/18723 | 5.34e-05 | 5.04e-04 | 219 |
| GO:00075962 | Liver | HCC | blood coagulation | 118/7958 | 217/18723 | 2.63e-04 | 1.94e-03 | 118 |
| GO:00075992 | Liver | HCC | hemostasis | 119/7958 | 222/18723 | 5.25e-04 | 3.41e-03 | 119 |
| GO:00508172 | Liver | HCC | coagulation | 118/7958 | 222/18723 | 8.41e-04 | 5.03e-03 | 118 |
| GO:005087822 | Liver | HCC | regulation of body fluid levels | 191/7958 | 379/18723 | 1.06e-03 | 6.11e-03 | 191 |
| GO:000663911 | Liver | HCC | acylglycerol metabolic process | 72/7958 | 128/18723 | 1.16e-03 | 6.54e-03 | 72 |
| GO:0006654 | Liver | HCC | phosphatidic acid biosynthetic process | 23/7958 | 33/18723 | 1.46e-03 | 7.75e-03 | 23 |
| GO:000663811 | Liver | HCC | neutral lipid metabolic process | 72/7958 | 129/18723 | 1.54e-03 | 8.14e-03 | 72 |
| GO:00464732 | Liver | HCC | phosphatidic acid metabolic process | 24/7958 | 37/18723 | 5.03e-03 | 2.11e-02 | 24 |
| Page: 1 |
| Pathway ID | Tissue | Disease Stage | Description | Gene Ratio | Bg Ratio | pvalue | p.adjust | qvalue | Count |
| hsa005615 | Liver | HCC | Glycerolipid metabolism | 41/4020 | 63/8465 | 3.59e-03 | 1.12e-02 | 6.22e-03 | 41 |
| hsa052316 | Liver | HCC | Choline metabolism in cancer | 57/4020 | 98/8465 | 2.14e-02 | 4.90e-02 | 2.72e-02 | 57 |
| hsa0056112 | Liver | HCC | Glycerolipid metabolism | 41/4020 | 63/8465 | 3.59e-03 | 1.12e-02 | 6.22e-03 | 41 |
| hsa0523111 | Liver | HCC | Choline metabolism in cancer | 57/4020 | 98/8465 | 2.14e-02 | 4.90e-02 | 2.72e-02 | 57 |
| Page: 1 |
Top |
Cell-cell communication analysis |
| Identification of potential cell-cell interactions between two cell types and their ligand-receptor pairs for different disease states |
| Ligand | Receptor | LRpair | Pathway | Tissue | Disease Stage |
| Page: 1 |
Top |
Single-cell gene regulatory network inference analysis |
| Find out the significant the regulons (TFs) and the target genes of each regulon across cell types for different disease states |
| TF | Cell Type | Tissue | Disease Stage | Target Gene | RSS | Regulon Activity |
| ∗The dot plots of a searched regulon are shown for all cell subpopulations in each disease state of each tissue based on the regulon specific score inferred using pySCENIC and by calculating the average expression. |
| Page: 1 |
Top |
Somatic mutation of malignant transformation related genes |
| Annotation of somatic variants for genes involved in malignant transformation |
| Hugo Symbol | Variant Class | Variant Classification | dbSNP RS | HGVSc | HGVSp | HGVSp Short | SWISSPROT | BIOTYPE | SIFT | PolyPhen | Tumor Sample Barcode | Tissue | Histology | Sex | Age | Stage | Therapy Types | Drugs | Outcome |
| DGKB | SNV | Missense_Mutation | c.1719G>C | p.Glu573Asp | p.E573D | Q9Y6T7 | protein_coding | tolerated(0.07) | possibly_damaging(0.704) | TCGA-A2-A0CL-01 | Breast | breast invasive carcinoma | Female | <65 | III/IV | Chemotherapy | cytoxan | SD | |
| DGKB | SNV | Missense_Mutation | c.1624N>A | p.Glu542Lys | p.E542K | Q9Y6T7 | protein_coding | tolerated(0.25) | benign(0.412) | TCGA-D8-A1JA-01 | Breast | breast invasive carcinoma | Female | <65 | III/IV | Chemotherapy | adriamycin | PD | |
| DGKB | SNV | Missense_Mutation | rs747038198 | c.38C>T | p.Ser13Leu | p.S13L | Q9Y6T7 | protein_coding | tolerated(0.22) | benign(0) | TCGA-D8-A1JH-01 | Breast | breast invasive carcinoma | Female | <65 | I/II | Hormone Therapy | nolvadex | SD |
| DGKB | SNV | Missense_Mutation | rs747038198 | c.38C>T | p.Ser13Leu | p.S13L | Q9Y6T7 | protein_coding | tolerated(0.22) | benign(0) | TCGA-D8-A1XM-01 | Breast | breast invasive carcinoma | Female | <65 | I/II | Unknown | Unknown | SD |
| DGKB | insertion | In_Frame_Ins | novel | c.910_911insTAT | p.Asn304delinsIleTyr | p.N304delinsIY | Q9Y6T7 | protein_coding | TCGA-AC-A3QQ-01 | Breast | breast invasive carcinoma | Female | <65 | I/II | Unknown | Unknown | SD | ||
| DGKB | insertion | In_Frame_Ins | novel | c.908_909insTAT | p.Arg303delinsSerMet | p.R303delinsSM | Q9Y6T7 | protein_coding | TCGA-AC-A3QQ-01 | Breast | breast invasive carcinoma | Female | <65 | I/II | Unknown | Unknown | SD | ||
| DGKB | deletion | Frame_Shift_Del | novel | c.1339delN | p.Ser447ValfsTer17 | p.S447Vfs*17 | Q9Y6T7 | protein_coding | TCGA-EW-A2FV-01 | Breast | breast invasive carcinoma | Female | <65 | III/IV | Chemotherapy | docetaxel | SD | ||
| DGKB | SNV | Missense_Mutation | novel | c.490G>A | p.Asp164Asn | p.D164N | Q9Y6T7 | protein_coding | deleterious(0.04) | probably_damaging(1) | TCGA-2W-A8YY-01 | Cervix | cervical & endocervical cancer | Female | <65 | I/II | Chemotherapy | cisplatin | CR |
| DGKB | insertion | Nonsense_Mutation | novel | c.1814_1815insTGTCAAATAGTAATGGAAAATACTGTTAAACAAGAGTTAGAAAA | p.Lys605AsnfsTer4 | p.K605Nfs*4 | Q9Y6T7 | protein_coding | TCGA-HG-A2PA-01 | Cervix | cervical & endocervical cancer | Female | <65 | I/II | Unspecific | Taxol | PD | ||
| DGKB | SNV | Missense_Mutation | novel | c.1261G>A | p.Val421Ile | p.V421I | Q9Y6T7 | protein_coding | tolerated(0.8) | benign(0) | TCGA-5M-AAT4-01 | Colorectum | colon adenocarcinoma | Male | >=65 | III/IV | Unknown | Unknown | PD |
| Page: 1 2 3 4 5 6 7 8 9 10 11 12 13 14 15 16 17 |
Top |
Related drugs of malignant transformation related genes |
| Identification of chemicals and drugs interact with genes involved in malignant transfromation |
| (DGIdb 4.0) |
| Entrez ID | Symbol | Category | Interaction Types | Drug Claim Name | Drug Name | PMIDs |
| 1607 | DGKB | KINASE | antipsychotics | 31447353 |
| Page: 1 |

Copyright 2023-Present -The University of Texas Health Science Center at Houston |