
|
|||||
|
 | |
| |
| |
| |
| |
| |
|
Gene: DGKA |
Gene summary for DGKA |
| Gene information | Species | Human | Gene symbol | DGKA | Gene ID | 1606 |
| Gene name | diacylglycerol kinase alpha | |
| Gene Alias | DAGK | |
| Cytomap | 12q13.2 | |
| Gene Type | protein-coding | GO ID | GO:0001775 | UniProtAcc | A0A024RB23 |
Top |
Malignant transformation analysis |
| Identification of the aberrant gene expression in precancerous and cancerous lesions by comparing the gene expression of stem-like cells in diseased tissues with normal stem cells |
| Entrez ID | Symbol | Replicates | Species | Organ | Tissue | Adj P-value | Log2FC | Malignancy |
| 1606 | DGKA | LZE4T | Human | Esophagus | ESCC | 3.76e-19 | 1.83e-01 | 0.0811 |
| 1606 | DGKA | LZE7T | Human | Esophagus | ESCC | 2.98e-03 | 2.58e-01 | 0.0667 |
| 1606 | DGKA | LZE8T | Human | Esophagus | ESCC | 3.04e-07 | 1.69e-01 | 0.067 |
| 1606 | DGKA | LZE20T | Human | Esophagus | ESCC | 2.82e-06 | 1.44e-01 | 0.0662 |
| 1606 | DGKA | LZE22D1 | Human | Esophagus | HGIN | 1.81e-05 | 1.03e-01 | 0.0595 |
| 1606 | DGKA | LZE22T | Human | Esophagus | ESCC | 4.76e-06 | 4.42e-01 | 0.068 |
| 1606 | DGKA | LZE24T | Human | Esophagus | ESCC | 5.83e-13 | 1.97e-01 | 0.0596 |
| 1606 | DGKA | LZE21T | Human | Esophagus | ESCC | 2.19e-09 | 3.01e-01 | 0.0655 |
| 1606 | DGKA | LZE6T | Human | Esophagus | ESCC | 3.58e-02 | -8.26e-02 | 0.0845 |
| 1606 | DGKA | P1T-E | Human | Esophagus | ESCC | 2.80e-12 | 6.38e-01 | 0.0875 |
| 1606 | DGKA | P2T-E | Human | Esophagus | ESCC | 7.17e-22 | 5.64e-01 | 0.1177 |
| 1606 | DGKA | P4T-E | Human | Esophagus | ESCC | 2.43e-17 | 3.30e-01 | 0.1323 |
| 1606 | DGKA | P5T-E | Human | Esophagus | ESCC | 5.07e-20 | 1.34e-01 | 0.1327 |
| 1606 | DGKA | P8T-E | Human | Esophagus | ESCC | 5.99e-14 | 1.07e-01 | 0.0889 |
| 1606 | DGKA | P9T-E | Human | Esophagus | ESCC | 4.83e-11 | 6.49e-02 | 0.1131 |
| 1606 | DGKA | P10T-E | Human | Esophagus | ESCC | 1.31e-13 | 2.28e-01 | 0.116 |
| 1606 | DGKA | P11T-E | Human | Esophagus | ESCC | 6.09e-07 | 3.50e-01 | 0.1426 |
| 1606 | DGKA | P12T-E | Human | Esophagus | ESCC | 7.56e-44 | 8.40e-01 | 0.1122 |
| 1606 | DGKA | P15T-E | Human | Esophagus | ESCC | 1.10e-21 | 5.29e-01 | 0.1149 |
| 1606 | DGKA | P16T-E | Human | Esophagus | ESCC | 3.68e-10 | 2.02e-01 | 0.1153 |
| Page: 1 2 3 4 5 |
| Tissue | Expression Dynamics | Abbreviation |
| Esophagus | 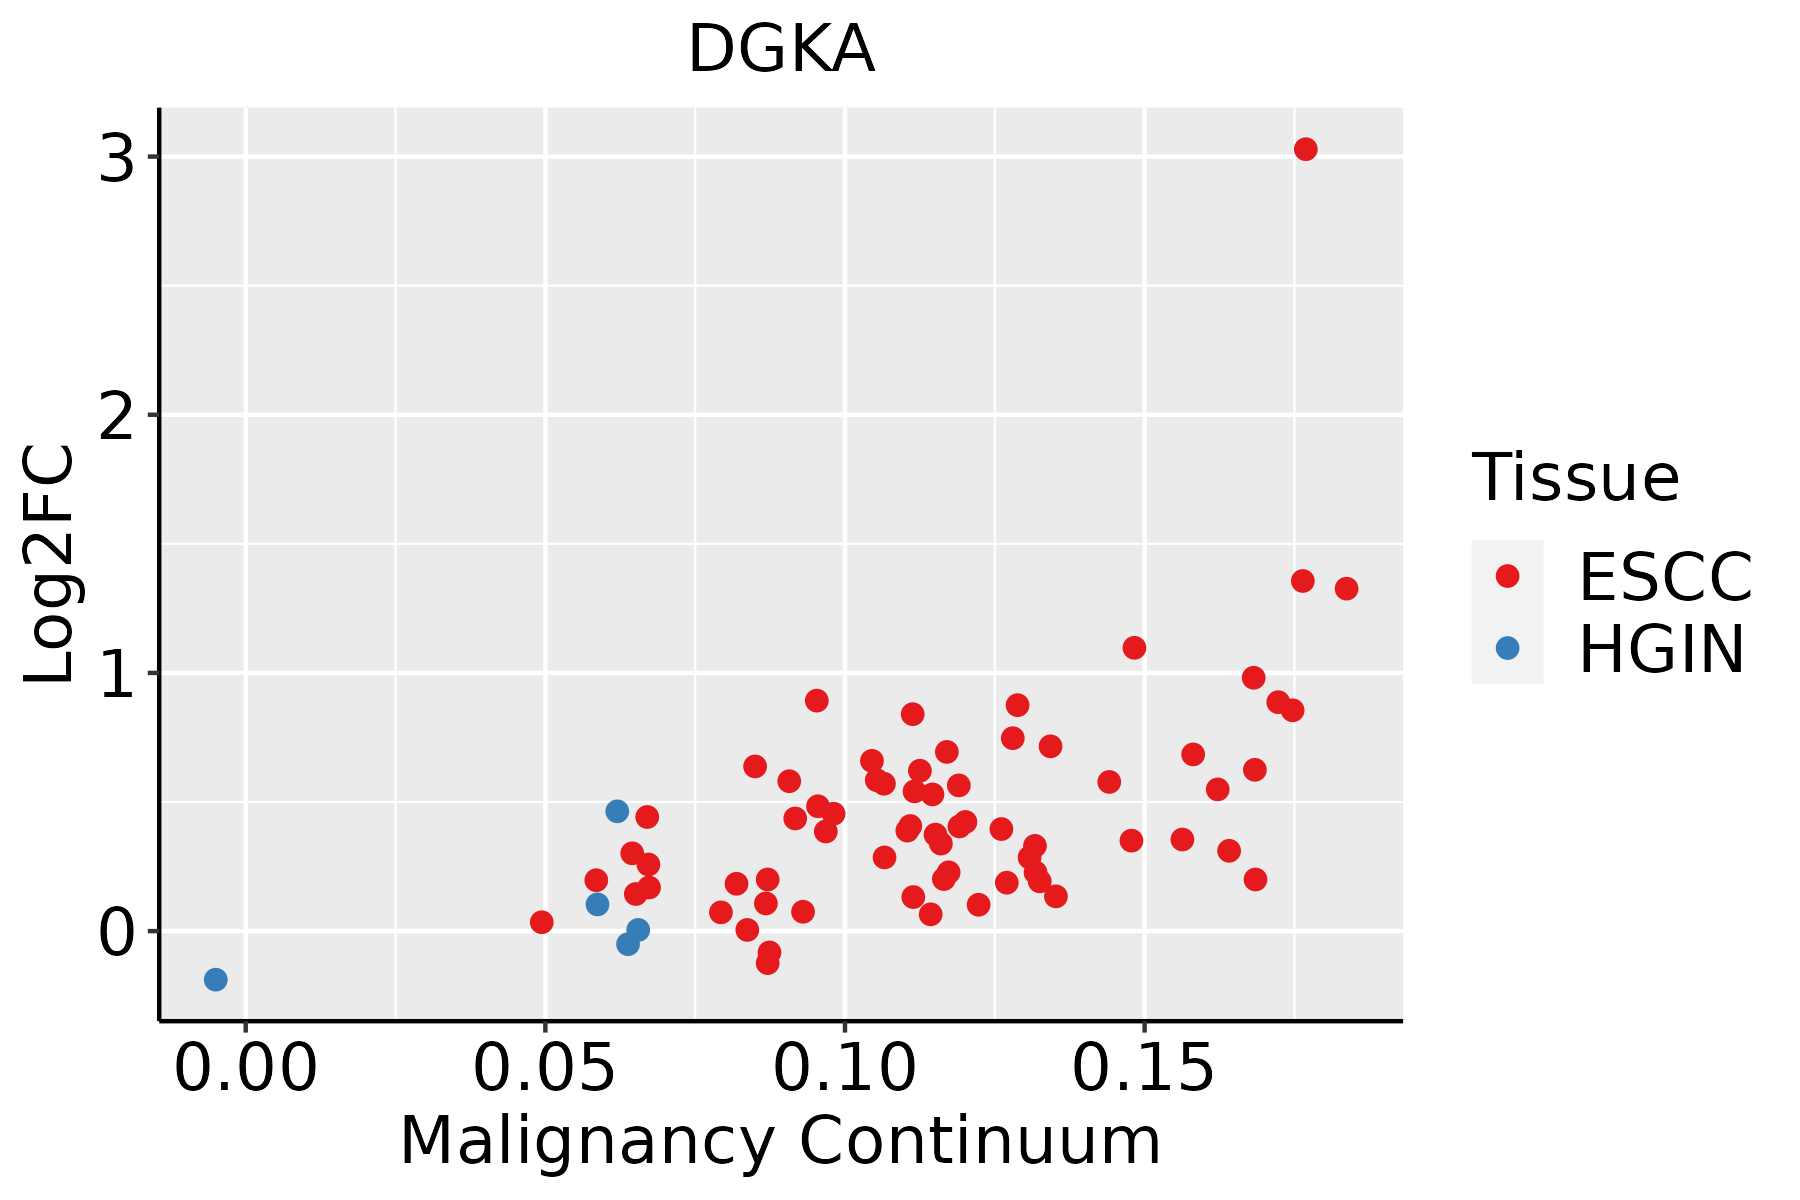 | ESCC: Esophageal squamous cell carcinoma |
| HGIN: High-grade intraepithelial neoplasias | ||
| LGIN: Low-grade intraepithelial neoplasias | ||
| Oral Cavity |  | EOLP: Erosive Oral lichen planus |
| LP: leukoplakia | ||
| NEOLP: Non-erosive oral lichen planus | ||
| OSCC: Oral squamous cell carcinoma | ||
| Skin | 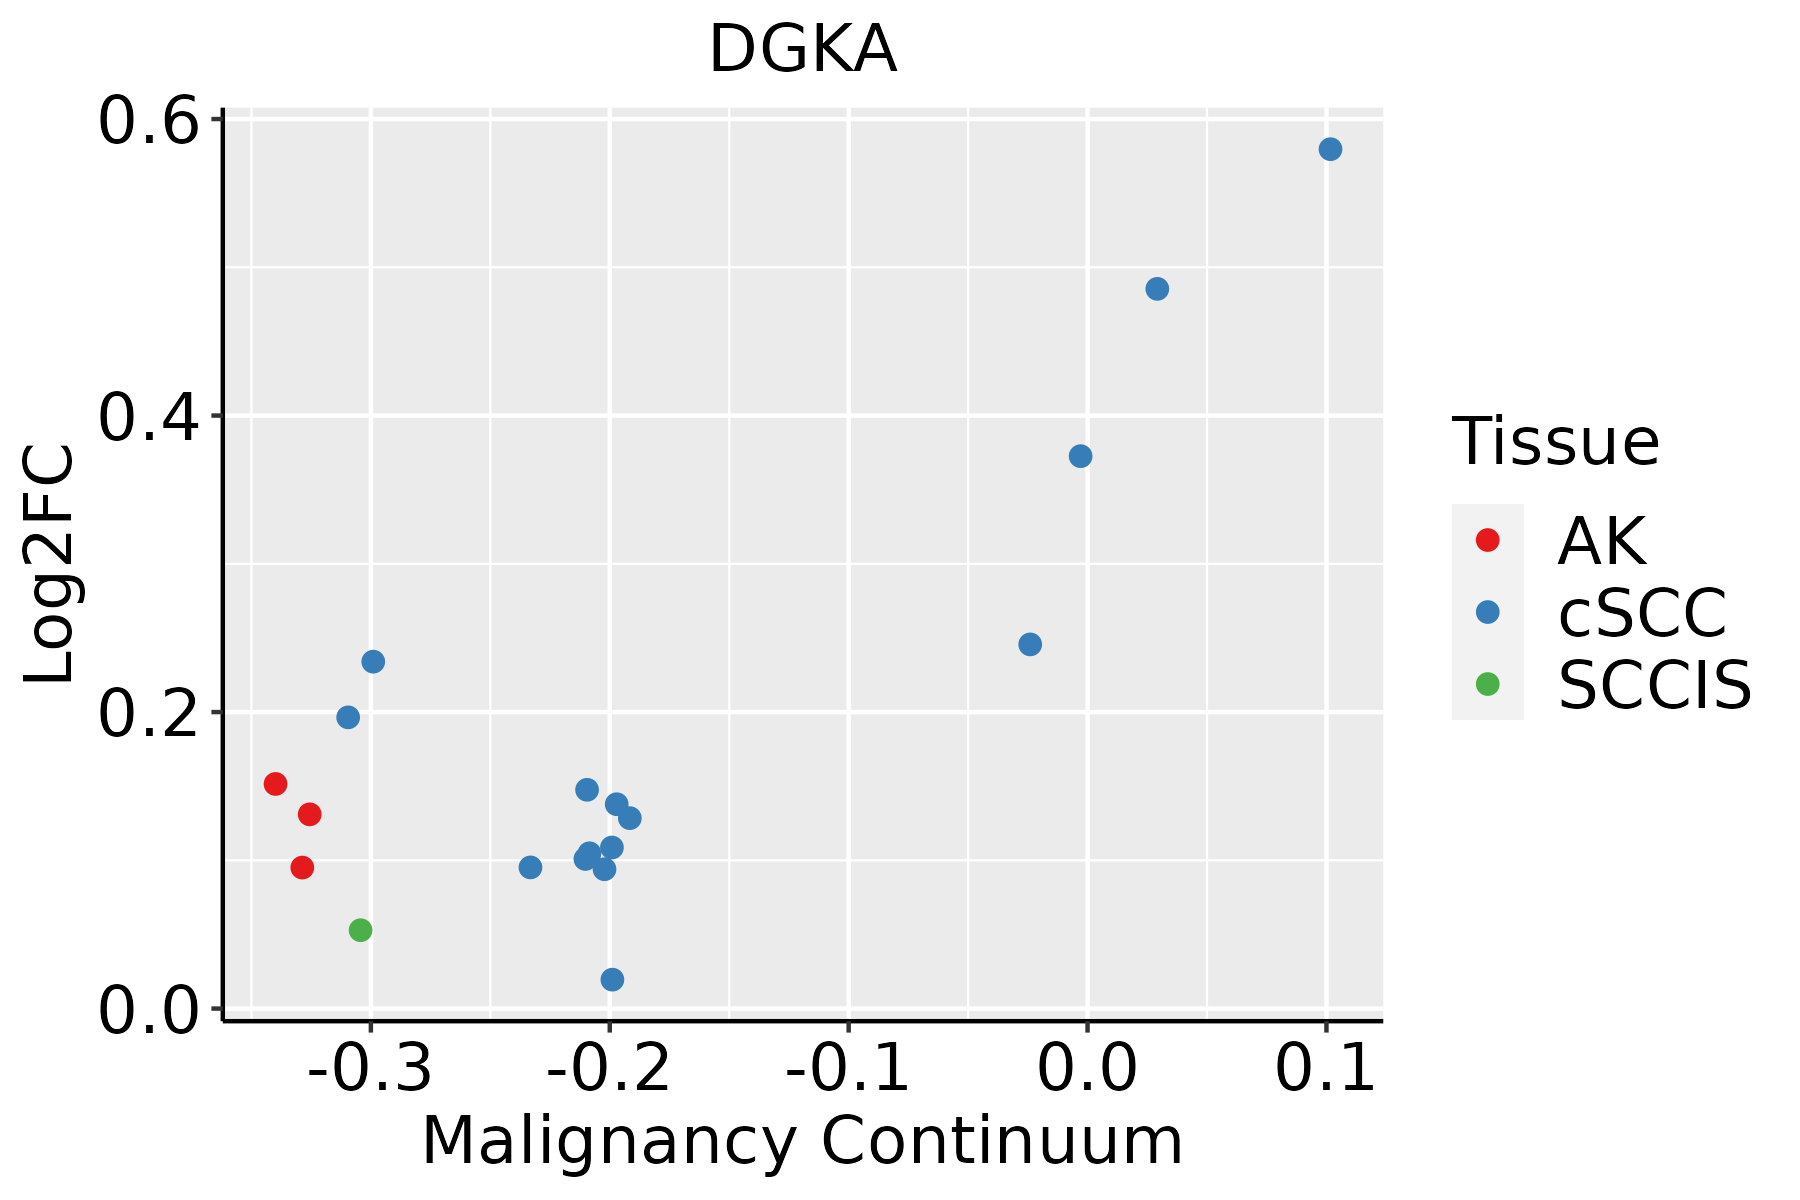 | AK: Actinic keratosis |
| cSCC: Cutaneous squamous cell carcinoma | ||
| SCCIS:squamous cell carcinoma in situ |
| ∗log2FC in expression of this searched gene in stem-like cells from each diseased tissue sample relative to stem-like cells in normal samples in each tissue plotted against the malignancy continuum. Samples are colored based on if they are from different disease stage. |
Top |
Malignant transformation related pathway analysis |
| Find out the enriched GO biological processes and KEGG pathways involved in transition from healthy to precancer to cancer |
| Tissue | Disease Stage | Enriched GO biological Processes |
| Colorectum | AD |  |
| Colorectum | SER |  |
| Colorectum | MSS |  |
| Colorectum | MSI-H |  |
| Colorectum | FAP |  |
| ∗Top 15 enriched GO BP terms are showed in the bar plot of each disease state in each tissue. Each row represents a significant GO biological process which is colored according to the -log10(p.adjust). |
| Page: 1 2 3 4 5 6 7 8 9 |
| GO ID | Tissue | Disease Stage | Description | Gene Ratio | Bg Ratio | pvalue | p.adjust | Count |
| GO:00086544 | Esophagus | ESCC | phospholipid biosynthetic process | 162/8552 | 253/18723 | 2.59e-09 | 5.73e-08 | 162 |
| GO:00464744 | Esophagus | ESCC | glycerophospholipid biosynthetic process | 135/8552 | 211/18723 | 5.75e-08 | 1.02e-06 | 135 |
| GO:004206027 | Esophagus | ESCC | wound healing | 243/8552 | 422/18723 | 4.62e-07 | 6.25e-06 | 243 |
| GO:00450175 | Esophagus | ESCC | glycerolipid biosynthetic process | 154/8552 | 252/18723 | 5.20e-07 | 6.96e-06 | 154 |
| GO:00066446 | Esophagus | ESCC | phospholipid metabolic process | 218/8552 | 383/18723 | 5.37e-06 | 5.59e-05 | 218 |
| GO:00066505 | Esophagus | ESCC | glycerophospholipid metabolic process | 174/8552 | 306/18723 | 4.92e-05 | 3.85e-04 | 174 |
| GO:00066541 | Esophagus | ESCC | phosphatidic acid biosynthetic process | 26/8552 | 33/18723 | 1.06e-04 | 7.43e-04 | 26 |
| GO:00464733 | Esophagus | ESCC | phosphatidic acid metabolic process | 28/8552 | 37/18723 | 2.00e-04 | 1.26e-03 | 28 |
| GO:00464864 | Esophagus | ESCC | glycerolipid metabolic process | 211/8552 | 392/18723 | 6.51e-04 | 3.46e-03 | 211 |
| GO:00302586 | Esophagus | ESCC | lipid modification | 116/8552 | 212/18723 | 4.90e-03 | 1.89e-02 | 116 |
| GO:004206020 | Oral cavity | OSCC | wound healing | 237/7305 | 422/18723 | 4.51e-13 | 2.18e-11 | 237 |
| GO:00086543 | Oral cavity | OSCC | phospholipid biosynthetic process | 130/7305 | 253/18723 | 3.96e-05 | 3.46e-04 | 130 |
| GO:005087819 | Oral cavity | OSCC | regulation of body fluid levels | 179/7305 | 379/18723 | 6.19e-04 | 3.50e-03 | 179 |
| GO:00464743 | Oral cavity | OSCC | glycerophospholipid biosynthetic process | 102/7305 | 211/18723 | 3.50e-03 | 1.48e-02 | 102 |
| GO:00066445 | Oral cavity | OSCC | phospholipid metabolic process | 175/7305 | 383/18723 | 4.21e-03 | 1.71e-02 | 175 |
| GO:00075969 | Oral cavity | OSCC | blood coagulation | 102/7305 | 217/18723 | 9.69e-03 | 3.43e-02 | 102 |
| GO:00075999 | Oral cavity | OSCC | hemostasis | 103/7305 | 222/18723 | 1.45e-02 | 4.73e-02 | 103 |
| GO:00508179 | Oral cavity | OSCC | coagulation | 103/7305 | 222/18723 | 1.45e-02 | 4.73e-02 | 103 |
| GO:0042060110 | Oral cavity | LP | wound healing | 139/4623 | 422/18723 | 7.10e-05 | 9.48e-04 | 139 |
| GO:004206029 | Skin | cSCC | wound healing | 152/4864 | 422/18723 | 2.66e-06 | 4.26e-05 | 152 |
| Page: 1 |
| Pathway ID | Tissue | Disease Stage | Description | Gene Ratio | Bg Ratio | pvalue | p.adjust | qvalue | Count |
| hsa052319 | Esophagus | ESCC | Choline metabolism in cancer | 61/4205 | 98/8465 | 7.97e-03 | 1.92e-02 | 9.84e-03 | 61 |
| hsa0523114 | Esophagus | ESCC | Choline metabolism in cancer | 61/4205 | 98/8465 | 7.97e-03 | 1.92e-02 | 9.84e-03 | 61 |
| Page: 1 |
Top |
Cell-cell communication analysis |
| Identification of potential cell-cell interactions between two cell types and their ligand-receptor pairs for different disease states |
| Ligand | Receptor | LRpair | Pathway | Tissue | Disease Stage |
| Page: 1 |
Top |
Single-cell gene regulatory network inference analysis |
| Find out the significant the regulons (TFs) and the target genes of each regulon across cell types for different disease states |
| TF | Cell Type | Tissue | Disease Stage | Target Gene | RSS | Regulon Activity |
| ∗The dot plots of a searched regulon are shown for all cell subpopulations in each disease state of each tissue based on the regulon specific score inferred using pySCENIC and by calculating the average expression. |
| Page: 1 |
Top |
Somatic mutation of malignant transformation related genes |
| Annotation of somatic variants for genes involved in malignant transformation |
| Hugo Symbol | Variant Class | Variant Classification | dbSNP RS | HGVSc | HGVSp | HGVSp Short | SWISSPROT | BIOTYPE | SIFT | PolyPhen | Tumor Sample Barcode | Tissue | Histology | Sex | Age | Stage | Therapy Types | Drugs | Outcome |
| DGKA | SNV | Missense_Mutation | c.1697N>T | p.Ser566Phe | p.S566F | P23743 | protein_coding | deleterious(0) | possibly_damaging(0.808) | TCGA-A8-A0A1-01 | Breast | breast invasive carcinoma | Female | >=65 | I/II | Hormone Therapy | tamoxiphen | SD | |
| DGKA | SNV | Missense_Mutation | rs199767962 | c.2127N>G | p.Ile709Met | p.I709M | P23743 | protein_coding | deleterious(0.01) | possibly_damaging(0.744) | TCGA-BH-A0H9-01 | Breast | breast invasive carcinoma | Female | >=65 | I/II | Hormone Therapy | arimidex | SD |
| DGKA | insertion | In_Frame_Ins | novel | c.771_772insATATCCCTCTCCACACCCTTTCTCCCTTTTCAGGATCCA | p.Thr257_Tyr258insIleSerLeuSerThrProPheLeuProPheGlnAspPro | p.T257_Y258insISLSTPFLPFQDP | P23743 | protein_coding | TCGA-A8-A08O-01 | Breast | breast invasive carcinoma | Female | <65 | III/IV | Chemotherapy | docetaxel | PD | ||
| DGKA | insertion | Nonsense_Mutation | novel | c.873_874insACATCACTTCTTTAAGCCTTAGTTTCCTCAACTGAAAATGAGGTAAT | p.Tyr292ThrfsTer5 | p.Y292Tfs*5 | P23743 | protein_coding | TCGA-BH-A0HX-01 | Breast | breast invasive carcinoma | Female | <65 | I/II | Chemotherapy | adrimycin | SD | ||
| DGKA | SNV | Missense_Mutation | rs760712689 | c.2114C>T | p.Thr705Met | p.T705M | P23743 | protein_coding | deleterious(0.01) | benign(0.011) | TCGA-EK-A2PL-01 | Cervix | cervical & endocervical cancer | Female | <65 | III/IV | Unknown | Unknown | SD |
| DGKA | SNV | Missense_Mutation | c.682C>G | p.Leu228Val | p.L228V | P23743 | protein_coding | tolerated(0.63) | benign(0.1) | TCGA-EK-A3GJ-01 | Cervix | cervical & endocervical cancer | Female | <65 | I/II | Unknown | Unknown | SD | |
| DGKA | SNV | Missense_Mutation | c.481N>G | p.Gln161Glu | p.Q161E | P23743 | protein_coding | tolerated(0.26) | benign(0.009) | TCGA-IR-A3LK-01 | Cervix | cervical & endocervical cancer | Female | >=65 | I/II | Chemotherapy | cisplatin | PD | |
| DGKA | SNV | Missense_Mutation | novel | c.789N>T | p.Lys263Asn | p.K263N | P23743 | protein_coding | deleterious(0.03) | possibly_damaging(0.71) | TCGA-A6-2672-01 | Colorectum | colon adenocarcinoma | Female | >=65 | III/IV | Unknown | Unknown | SD |
| DGKA | SNV | Missense_Mutation | c.166N>G | p.Phe56Val | p.F56V | P23743 | protein_coding | deleterious(0) | probably_damaging(0.998) | TCGA-A6-6141-01 | Colorectum | colon adenocarcinoma | Male | <65 | I/II | Chemotherapy | 5-fu | SD | |
| DGKA | SNV | Missense_Mutation | c.2199N>A | p.Phe733Leu | p.F733L | P23743 | protein_coding | tolerated(0.46) | benign(0) | TCGA-AA-3510-01 | Colorectum | colon adenocarcinoma | Male | >=65 | I/II | Unknown | Unknown | SD |
| Page: 1 2 3 4 5 6 7 8 |
Top |
Related drugs of malignant transformation related genes |
| Identification of chemicals and drugs interact with genes involved in malignant transfromation |
| (DGIdb 4.0) |
| Entrez ID | Symbol | Category | Interaction Types | Drug Claim Name | Drug Name | PMIDs |
| Page: 1 |

Copyright 2023-Present -The University of Texas Health Science Center at Houston |