
|
|||||
|
 | |
| |
| |
| |
| |
| |
|
Gene: DGCR6L |
Gene summary for DGCR6L |
| Gene information | Species | Human | Gene symbol | DGCR6L | Gene ID | 85359 |
| Gene name | DiGeorge syndrome critical region gene 6 like | |
| Gene Alias | DGCR6 | |
| Cytomap | 22q11.21 | |
| Gene Type | protein-coding | GO ID | GO:0005575 | UniProtAcc | Q9BY27 |
Top |
Malignant transformation analysis |
| Identification of the aberrant gene expression in precancerous and cancerous lesions by comparing the gene expression of stem-like cells in diseased tissues with normal stem cells |
| Entrez ID | Symbol | Replicates | Species | Organ | Tissue | Adj P-value | Log2FC | Malignancy |
| 85359 | DGCR6L | GSM4909281 | Human | Breast | IDC | 2.78e-12 | 4.41e-01 | 0.21 |
| 85359 | DGCR6L | GSM4909286 | Human | Breast | IDC | 1.38e-02 | 1.26e-01 | 0.1081 |
| 85359 | DGCR6L | GSM4909291 | Human | Breast | IDC | 5.34e-09 | 5.00e-01 | 0.1753 |
| 85359 | DGCR6L | GSM4909298 | Human | Breast | IDC | 2.10e-09 | 3.30e-01 | 0.1551 |
| 85359 | DGCR6L | GSM4909306 | Human | Breast | IDC | 4.15e-02 | 2.96e-01 | 0.1564 |
| 85359 | DGCR6L | GSM4909311 | Human | Breast | IDC | 3.65e-09 | -1.51e-03 | 0.1534 |
| 85359 | DGCR6L | GSM4909318 | Human | Breast | IDC | 1.76e-03 | 5.77e-01 | 0.2031 |
| 85359 | DGCR6L | GSM4909319 | Human | Breast | IDC | 2.05e-14 | 1.88e-01 | 0.1563 |
| 85359 | DGCR6L | GSM4909320 | Human | Breast | IDC | 1.83e-04 | 2.80e-01 | 0.1575 |
| 85359 | DGCR6L | GSM4909321 | Human | Breast | IDC | 1.33e-03 | 2.43e-01 | 0.1559 |
| 85359 | DGCR6L | NCCBC5 | Human | Breast | DCIS | 5.04e-04 | 2.26e-01 | 0.2046 |
| 85359 | DGCR6L | P1 | Human | Breast | IDC | 1.98e-04 | -9.24e-02 | 0.1527 |
| 85359 | DGCR6L | DCIS2 | Human | Breast | DCIS | 3.40e-35 | 6.78e-02 | 0.0085 |
| 85359 | DGCR6L | LZE2T | Human | Esophagus | ESCC | 2.94e-05 | 8.42e-01 | 0.082 |
| 85359 | DGCR6L | LZE4T | Human | Esophagus | ESCC | 1.96e-16 | 5.43e-01 | 0.0811 |
| 85359 | DGCR6L | LZE5T | Human | Esophagus | ESCC | 1.97e-03 | 4.98e-01 | 0.0514 |
| 85359 | DGCR6L | LZE7T | Human | Esophagus | ESCC | 1.21e-16 | 9.74e-01 | 0.0667 |
| 85359 | DGCR6L | LZE8T | Human | Esophagus | ESCC | 2.20e-12 | 4.37e-01 | 0.067 |
| 85359 | DGCR6L | LZE20T | Human | Esophagus | ESCC | 2.26e-07 | 1.84e-01 | 0.0662 |
| 85359 | DGCR6L | LZE21D1 | Human | Esophagus | HGIN | 2.31e-02 | 7.61e-01 | 0.0632 |
| Page: 1 2 3 4 5 6 7 8 |
| Tissue | Expression Dynamics | Abbreviation |
| Breast | 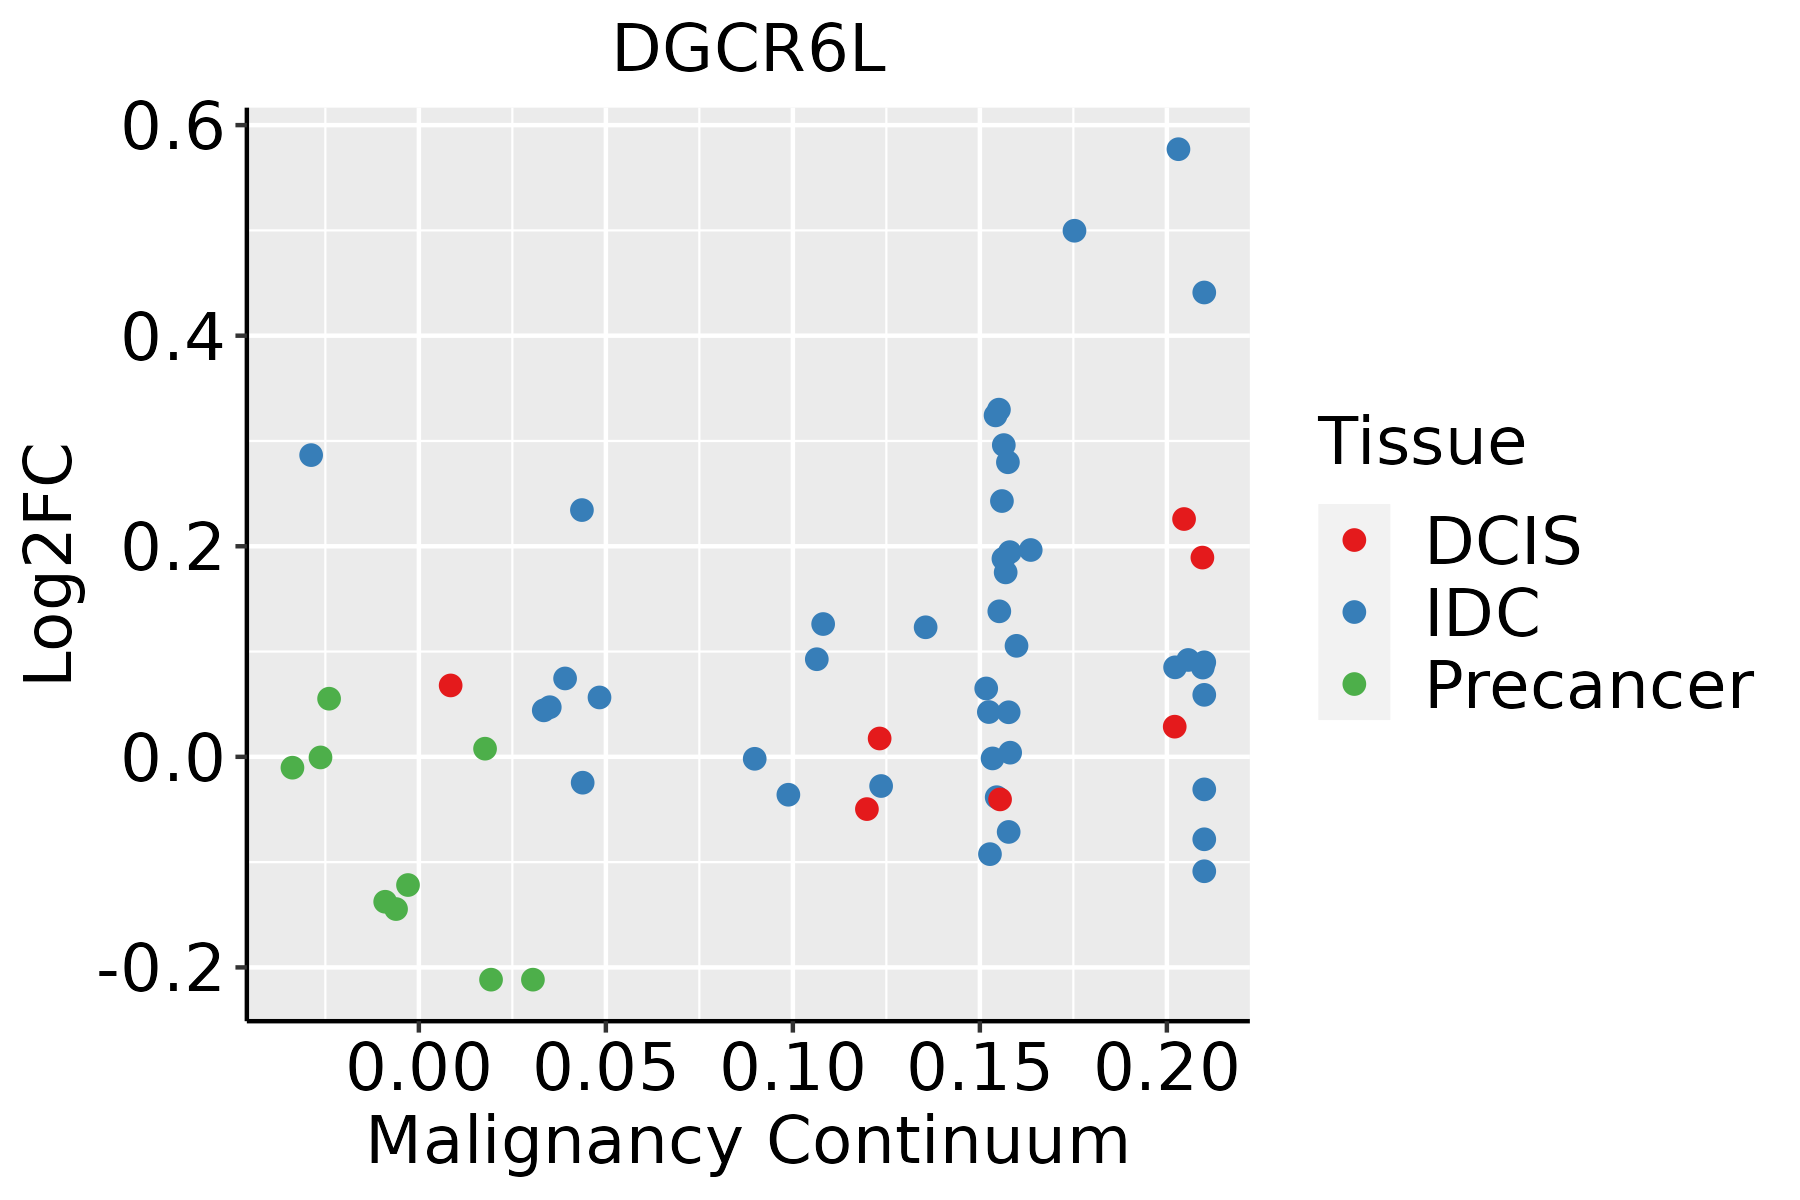 | IDC: Invasive ductal carcinoma |
| DCIS: Ductal carcinoma in situ | ||
| Precancer(BRCA1-mut): Precancerous lesion from BRCA1 mutation carriers | ||
| Esophagus | 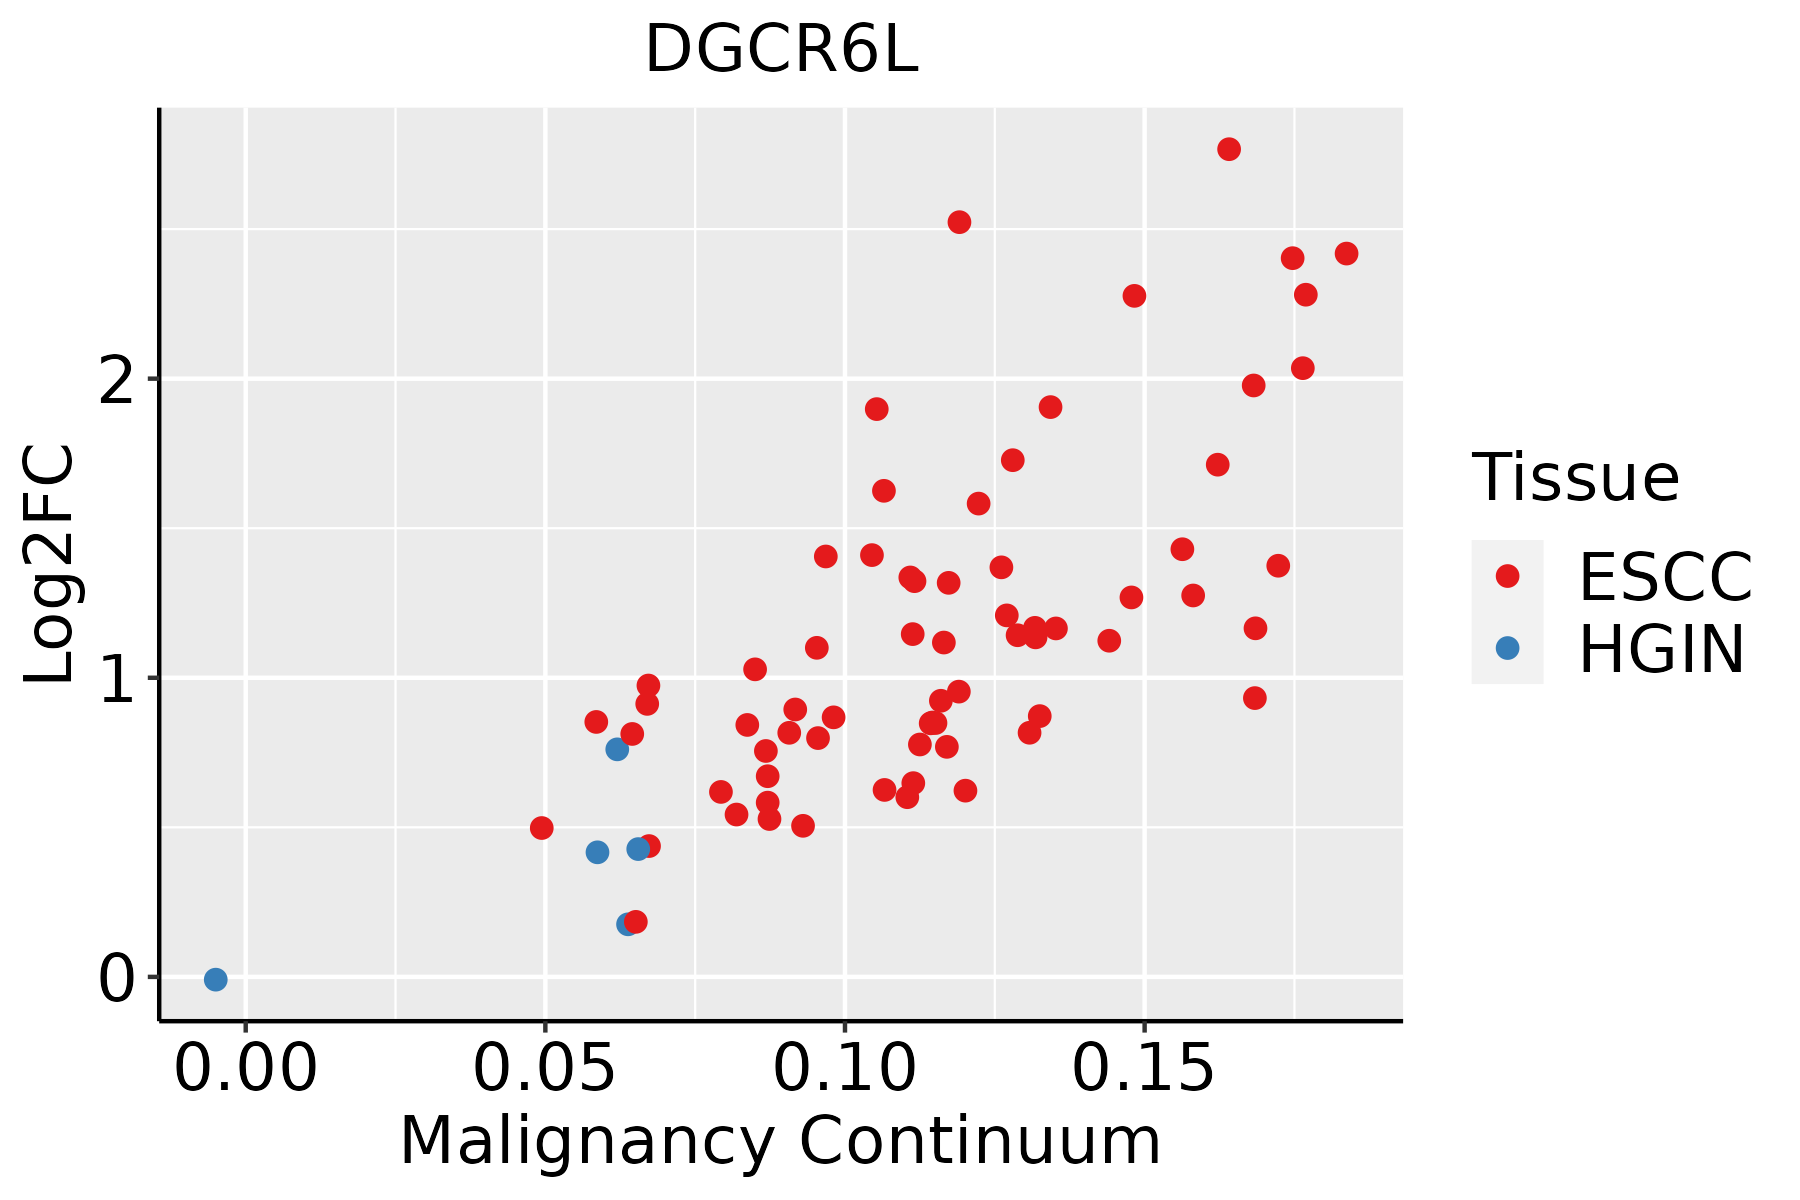 | ESCC: Esophageal squamous cell carcinoma |
| HGIN: High-grade intraepithelial neoplasias | ||
| LGIN: Low-grade intraepithelial neoplasias | ||
| Liver | 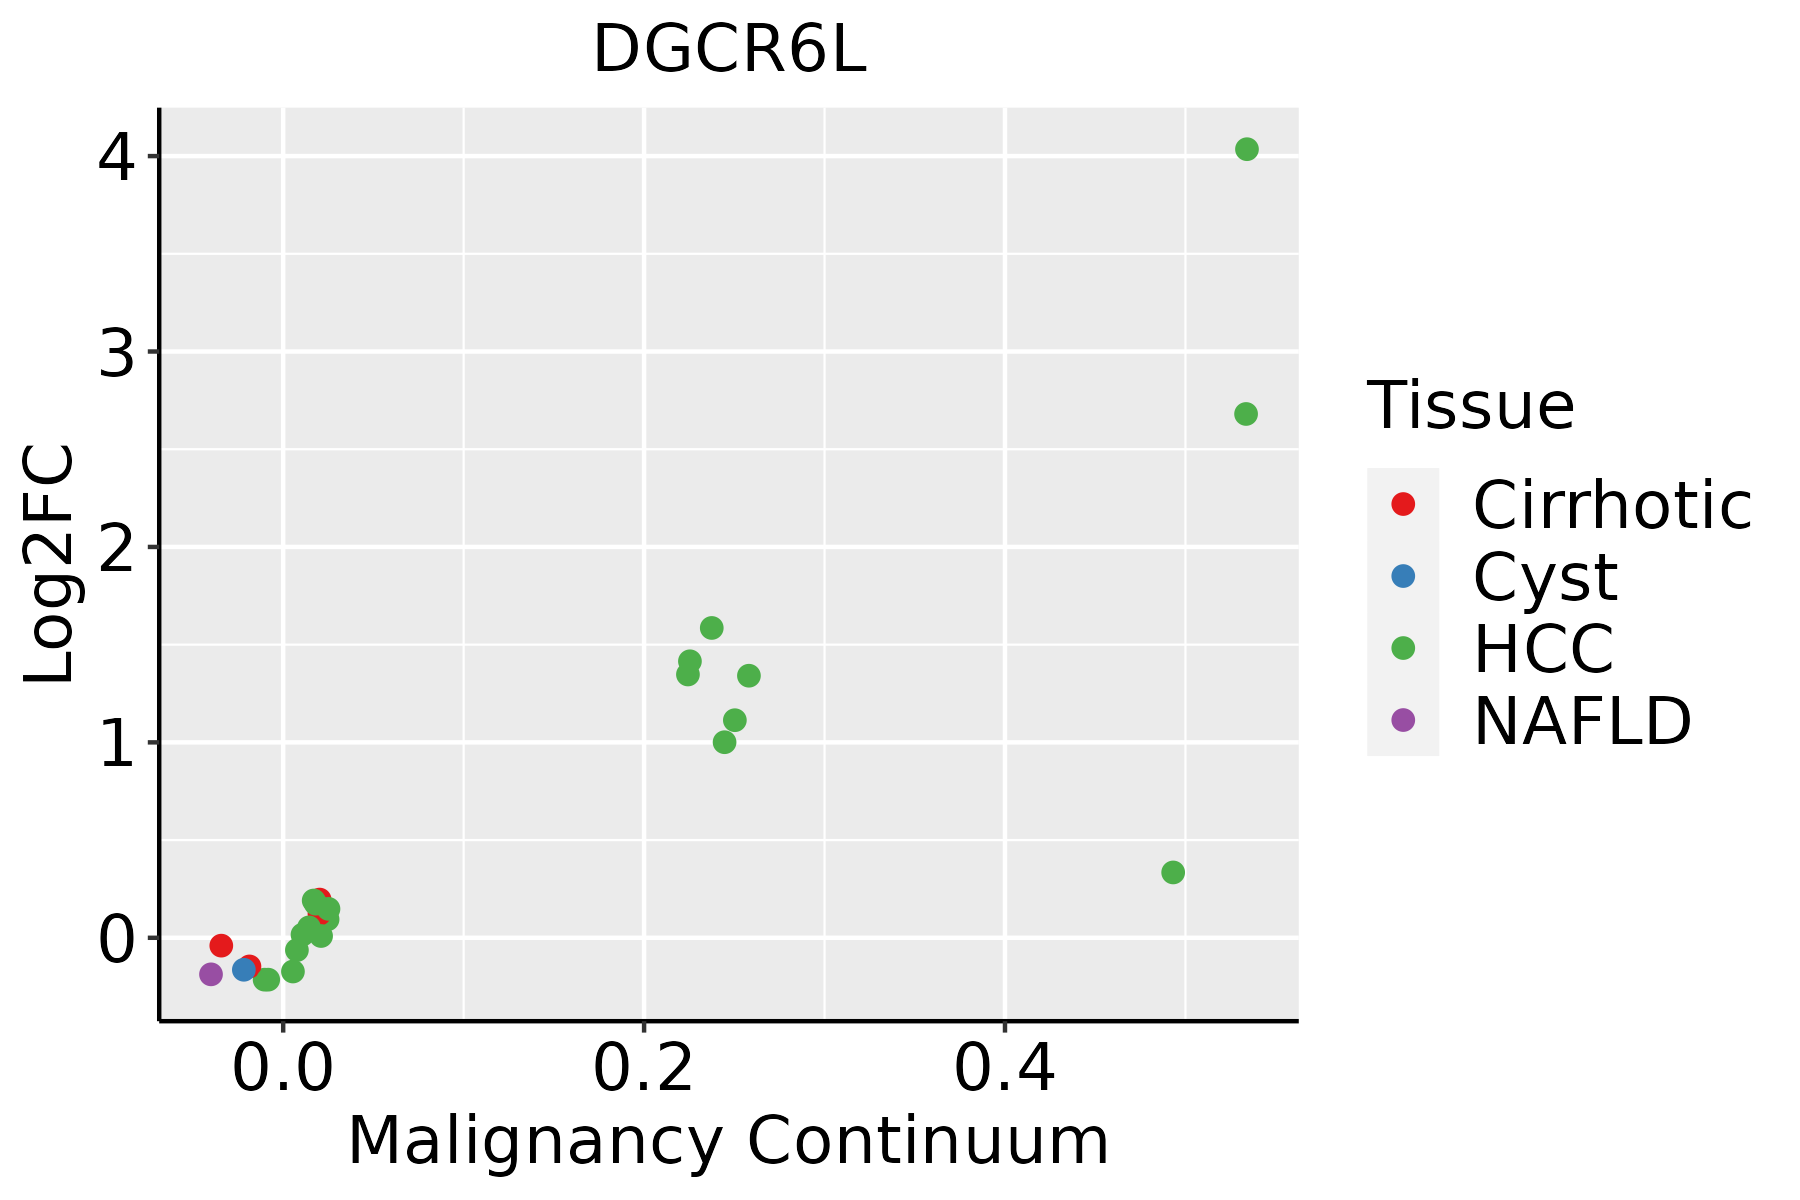 | HCC: Hepatocellular carcinoma |
| NAFLD: Non-alcoholic fatty liver disease | ||
| Oral Cavity | 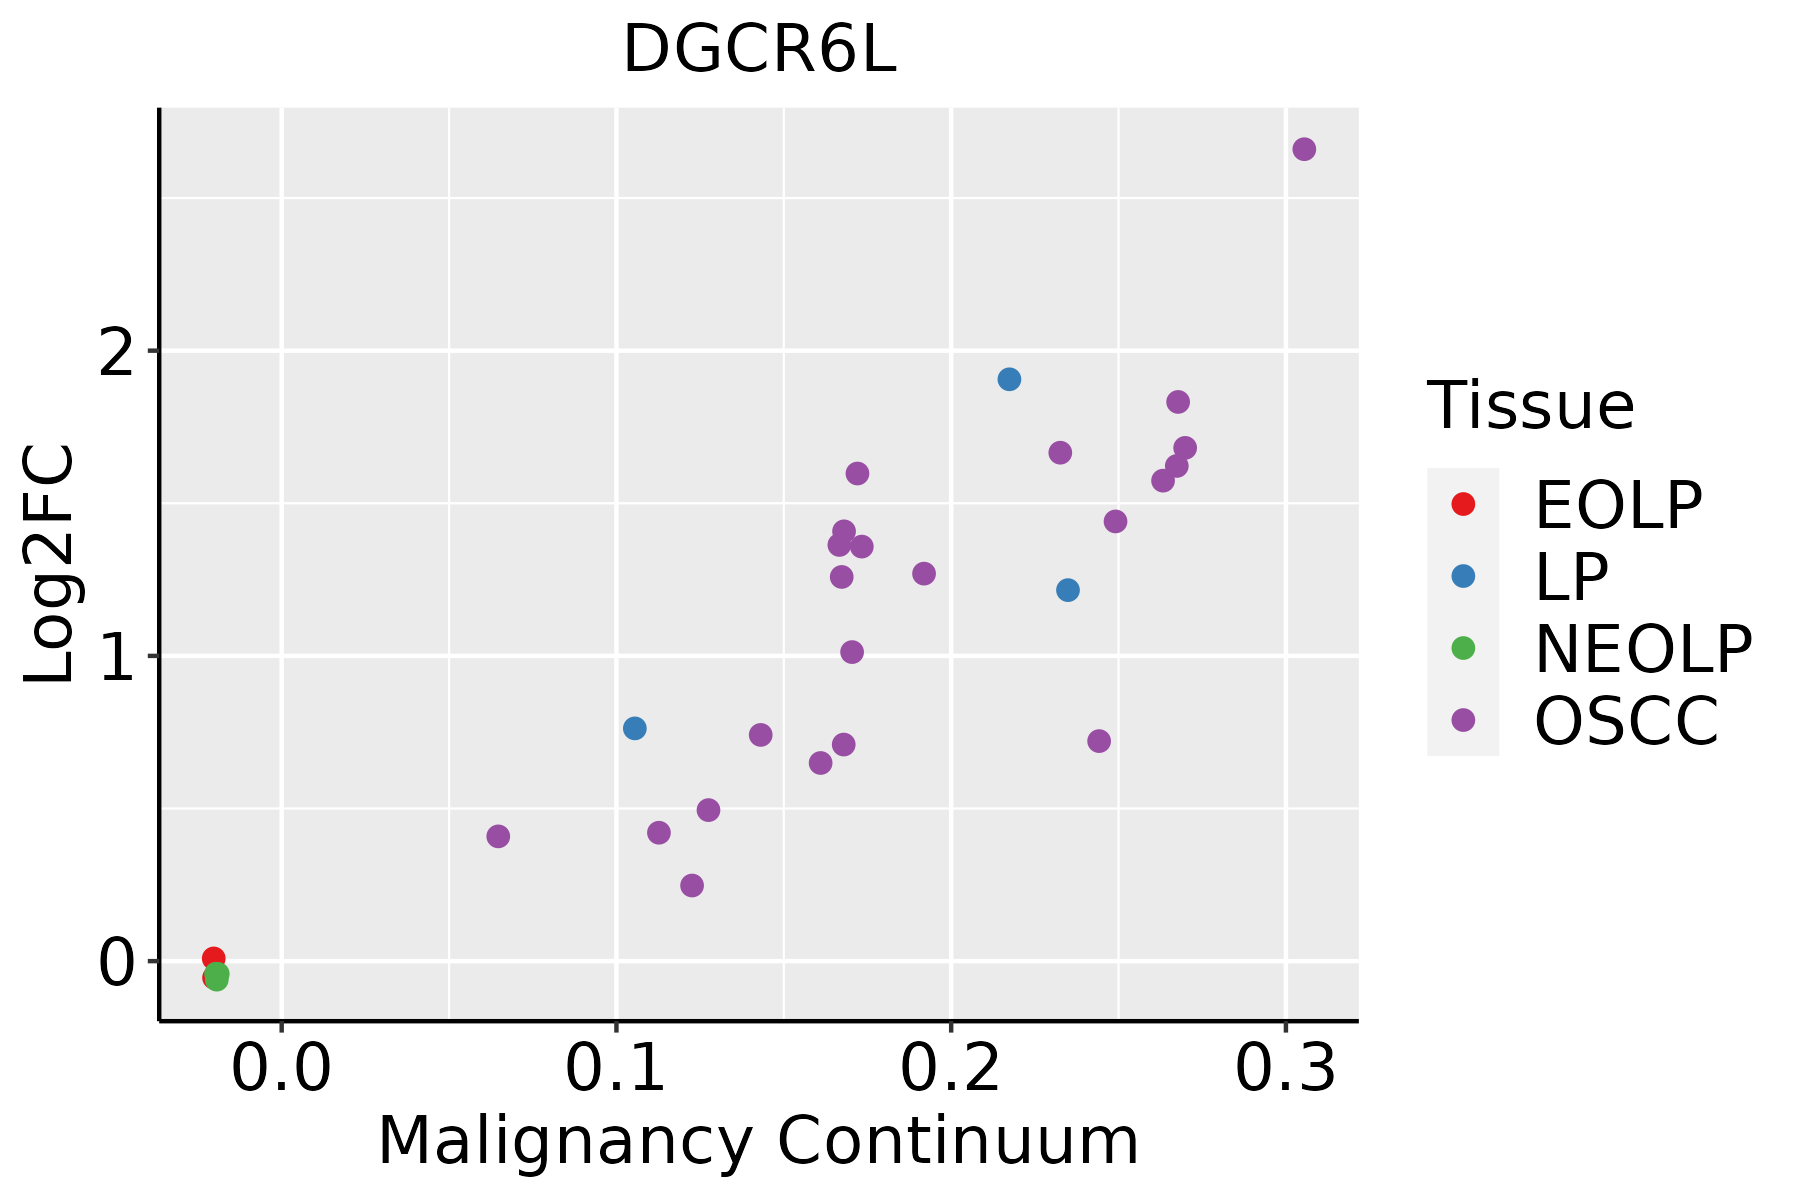 | EOLP: Erosive Oral lichen planus |
| LP: leukoplakia | ||
| NEOLP: Non-erosive oral lichen planus | ||
| OSCC: Oral squamous cell carcinoma | ||
| Prostate |  | BPH: Benign Prostatic Hyperplasia |
| Skin | 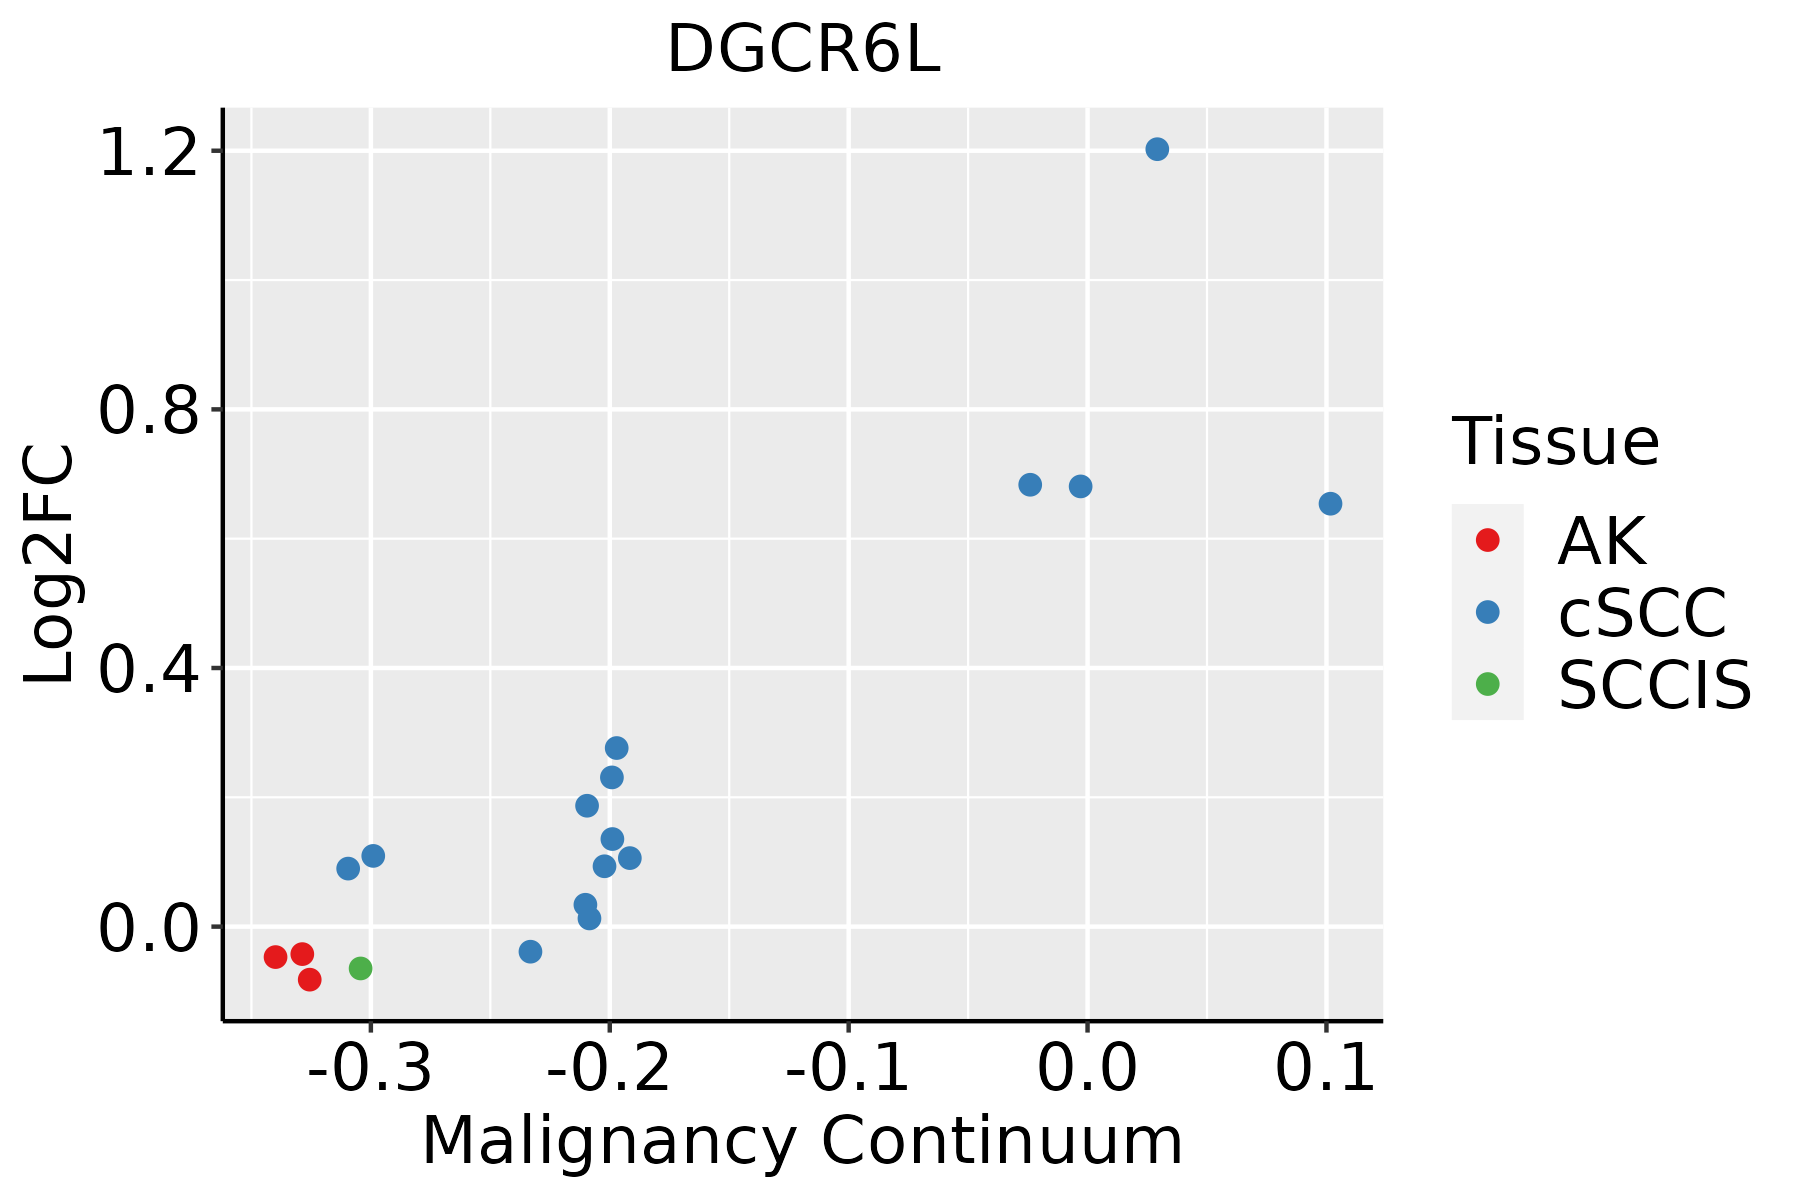 | AK: Actinic keratosis |
| cSCC: Cutaneous squamous cell carcinoma | ||
| SCCIS:squamous cell carcinoma in situ | ||
| Thyroid | 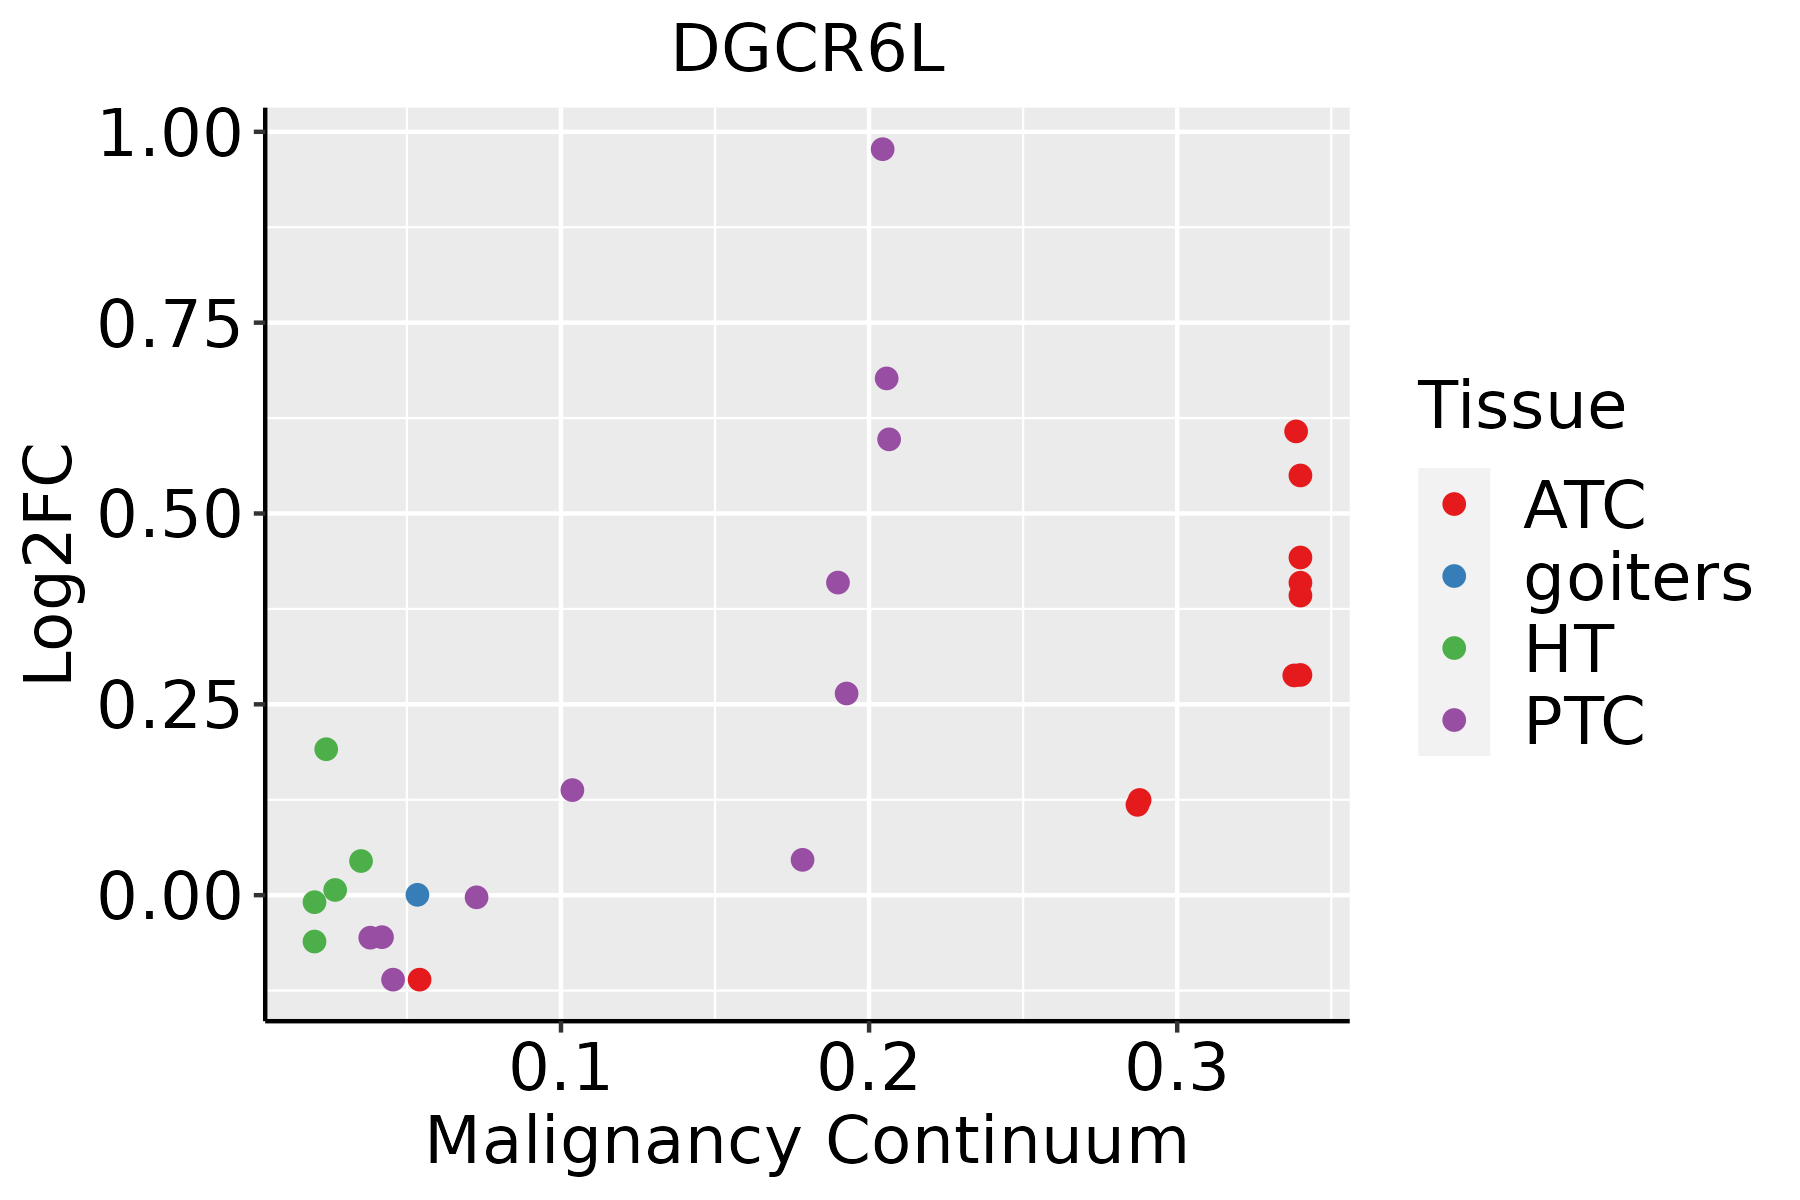 | ATC: Anaplastic thyroid cancer |
| HT: Hashimoto's thyroiditis | ||
| PTC: Papillary thyroid cancer |
| ∗log2FC in expression of this searched gene in stem-like cells from each diseased tissue sample relative to stem-like cells in normal samples in each tissue plotted against the malignancy continuum. Samples are colored based on if they are from different disease stage. |
Top |
Malignant transformation related pathway analysis |
| Find out the enriched GO biological processes and KEGG pathways involved in transition from healthy to precancer to cancer |
| Tissue | Disease Stage | Enriched GO biological Processes |
| Colorectum | AD |  |
| Colorectum | SER |  |
| Colorectum | MSS |  |
| Colorectum | MSI-H |  |
| Colorectum | FAP |  |
| ∗Top 15 enriched GO BP terms are showed in the bar plot of each disease state in each tissue. Each row represents a significant GO biological process which is colored according to the -log10(p.adjust). |
| Page: 1 2 3 4 5 6 7 8 9 |
| GO ID | Tissue | Disease Stage | Description | Gene Ratio | Bg Ratio | pvalue | p.adjust | Count |
| Page: 1 |
| Pathway ID | Tissue | Disease Stage | Description | Gene Ratio | Bg Ratio | pvalue | p.adjust | qvalue | Count |
| Page: 1 |
Top |
Cell-cell communication analysis |
| Identification of potential cell-cell interactions between two cell types and their ligand-receptor pairs for different disease states |
| Ligand | Receptor | LRpair | Pathway | Tissue | Disease Stage |
| Page: 1 |
Top |
Single-cell gene regulatory network inference analysis |
| Find out the significant the regulons (TFs) and the target genes of each regulon across cell types for different disease states |
| TF | Cell Type | Tissue | Disease Stage | Target Gene | RSS | Regulon Activity |
| ∗The dot plots of a searched regulon are shown for all cell subpopulations in each disease state of each tissue based on the regulon specific score inferred using pySCENIC and by calculating the average expression. |
| Page: 1 |
Top |
Somatic mutation of malignant transformation related genes |
| Annotation of somatic variants for genes involved in malignant transformation |
| Hugo Symbol | Variant Class | Variant Classification | dbSNP RS | HGVSc | HGVSp | HGVSp Short | SWISSPROT | BIOTYPE | SIFT | PolyPhen | Tumor Sample Barcode | Tissue | Histology | Sex | Age | Stage | Therapy Types | Drugs | Outcome |
| DGCR6L | SNV | Missense_Mutation | novel | c.492N>A | p.Phe164Leu | p.F164L | Q9BY27 | protein_coding | deleterious(0) | probably_damaging(0.95) | TCGA-2W-A8YY-01 | Cervix | cervical & endocervical cancer | Female | <65 | I/II | Chemotherapy | cisplatin | CR |
| DGCR6L | SNV | Missense_Mutation | novel | c.485N>T | p.Ala162Val | p.A162V | Q9BY27 | protein_coding | deleterious(0) | probably_damaging(0.983) | TCGA-A5-A2K3-01 | Endometrium | uterine corpus endometrioid carcinoma | Female | >=65 | I/II | Chemotherapy | carboplatin | SD |
| DGCR6L | SNV | Missense_Mutation | novel | c.492N>A | p.Phe164Leu | p.F164L | Q9BY27 | protein_coding | deleterious(0) | probably_damaging(0.95) | TCGA-AJ-A5DW-01 | Endometrium | uterine corpus endometrioid carcinoma | Female | <65 | I/II | Unknown | Unknown | SD |
| DGCR6L | SNV | Missense_Mutation | rs758170132 | c.476C>T | p.Ala159Val | p.A159V | Q9BY27 | protein_coding | deleterious(0.02) | probably_damaging(0.984) | TCGA-AP-A059-01 | Endometrium | uterine corpus endometrioid carcinoma | Female | >=65 | I/II | Unknown | Unknown | SD |
| DGCR6L | SNV | Missense_Mutation | rs143957631 | c.575N>A | p.Arg192Gln | p.R192Q | Q9BY27 | protein_coding | tolerated(1) | benign(0) | TCGA-B5-A0K9-01 | Endometrium | uterine corpus endometrioid carcinoma | Female | >=65 | I/II | Unknown | Unknown | SD |
| DGCR6L | SNV | Missense_Mutation | rs145876189 | c.439N>T | p.Arg147Trp | p.R147W | Q9BY27 | protein_coding | deleterious(0.03) | probably_damaging(0.993) | TCGA-EY-A1GU-01 | Endometrium | uterine corpus endometrioid carcinoma | Female | >=65 | I/II | Unknown | Unknown | SD |
| DGCR6L | SNV | Missense_Mutation | rs758170132 | c.476N>T | p.Ala159Val | p.A159V | Q9BY27 | protein_coding | deleterious(0.02) | probably_damaging(0.984) | TCGA-FI-A2D5-01 | Endometrium | uterine corpus endometrioid carcinoma | Female | <65 | III/IV | Chemotherapy | carboplatinum | PD |
| DGCR6L | SNV | Missense_Mutation | rs573329481 | c.461N>A | p.Ser154Asn | p.S154N | Q9BY27 | protein_coding | tolerated(0.24) | probably_damaging(0.95) | TCGA-CC-5261-01 | Liver | liver hepatocellular carcinoma | Male | <65 | I/II | Unknown | Unknown | SD |
| DGCR6L | SNV | Missense_Mutation | c.394G>A | p.Glu132Lys | p.E132K | Q9BY27 | protein_coding | tolerated(0.16) | probably_damaging(0.973) | TCGA-50-6590-01 | Lung | lung adenocarcinoma | Female | >=65 | I/II | Chemotherapy | paclitaxel | CR |
| Page: 1 |
Top |
Related drugs of malignant transformation related genes |
| Identification of chemicals and drugs interact with genes involved in malignant transfromation |
| (DGIdb 4.0) |
| Entrez ID | Symbol | Category | Interaction Types | Drug Claim Name | Drug Name | PMIDs |
| Page: 1 |

Copyright 2023-Present -The University of Texas Health Science Center at Houston |