
|
|||||
|
 | |
| |
| |
| |
| |
| |
|
Gene: DGCR14 |
Gene summary for DGCR14 |
| Gene information | Species | Human | Gene symbol | DGCR14 | Gene ID | 8220 |
| Gene name | ess-2 splicing factor homolog | |
| Gene Alias | DGCR13 | |
| Cytomap | 22q11.21 | |
| Gene Type | protein-coding | GO ID | GO:0000375 | UniProtAcc | Q96DF8 |
Top |
Malignant transformation analysis |
| Identification of the aberrant gene expression in precancerous and cancerous lesions by comparing the gene expression of stem-like cells in diseased tissues with normal stem cells |
| Entrez ID | Symbol | Replicates | Species | Organ | Tissue | Adj P-value | Log2FC | Malignancy |
| 8220 | DGCR14 | P1T-E | Human | Esophagus | ESCC | 4.47e-02 | 1.23e-01 | 0.0875 |
| 8220 | DGCR14 | P2T-E | Human | Esophagus | ESCC | 5.27e-12 | 1.02e-01 | 0.1177 |
| 8220 | DGCR14 | P4T-E | Human | Esophagus | ESCC | 3.42e-10 | 2.79e-01 | 0.1323 |
| 8220 | DGCR14 | P5T-E | Human | Esophagus | ESCC | 3.61e-16 | 2.30e-01 | 0.1327 |
| 8220 | DGCR14 | P8T-E | Human | Esophagus | ESCC | 1.75e-19 | 1.58e-01 | 0.0889 |
| 8220 | DGCR14 | P9T-E | Human | Esophagus | ESCC | 2.20e-09 | 1.86e-01 | 0.1131 |
| 8220 | DGCR14 | P10T-E | Human | Esophagus | ESCC | 1.83e-13 | 1.74e-01 | 0.116 |
| 8220 | DGCR14 | P11T-E | Human | Esophagus | ESCC | 2.15e-08 | 3.28e-01 | 0.1426 |
| 8220 | DGCR14 | P12T-E | Human | Esophagus | ESCC | 3.26e-20 | 2.38e-01 | 0.1122 |
| 8220 | DGCR14 | P15T-E | Human | Esophagus | ESCC | 1.24e-13 | 1.64e-01 | 0.1149 |
| 8220 | DGCR14 | P16T-E | Human | Esophagus | ESCC | 3.47e-19 | 2.48e-01 | 0.1153 |
| 8220 | DGCR14 | P17T-E | Human | Esophagus | ESCC | 1.10e-12 | 3.12e-01 | 0.1278 |
| 8220 | DGCR14 | P19T-E | Human | Esophagus | ESCC | 1.13e-02 | 2.21e-01 | 0.1662 |
| 8220 | DGCR14 | P20T-E | Human | Esophagus | ESCC | 3.56e-08 | 1.04e-01 | 0.1124 |
| 8220 | DGCR14 | P21T-E | Human | Esophagus | ESCC | 5.33e-34 | 5.57e-01 | 0.1617 |
| 8220 | DGCR14 | P22T-E | Human | Esophagus | ESCC | 8.66e-13 | 2.19e-01 | 0.1236 |
| 8220 | DGCR14 | P23T-E | Human | Esophagus | ESCC | 2.64e-14 | 3.52e-01 | 0.108 |
| 8220 | DGCR14 | P24T-E | Human | Esophagus | ESCC | 2.90e-15 | 1.75e-01 | 0.1287 |
| 8220 | DGCR14 | P26T-E | Human | Esophagus | ESCC | 5.73e-25 | 3.87e-01 | 0.1276 |
| 8220 | DGCR14 | P27T-E | Human | Esophagus | ESCC | 5.27e-20 | 1.67e-01 | 0.1055 |
| Page: 1 2 3 4 |
| Tissue | Expression Dynamics | Abbreviation |
| Esophagus | 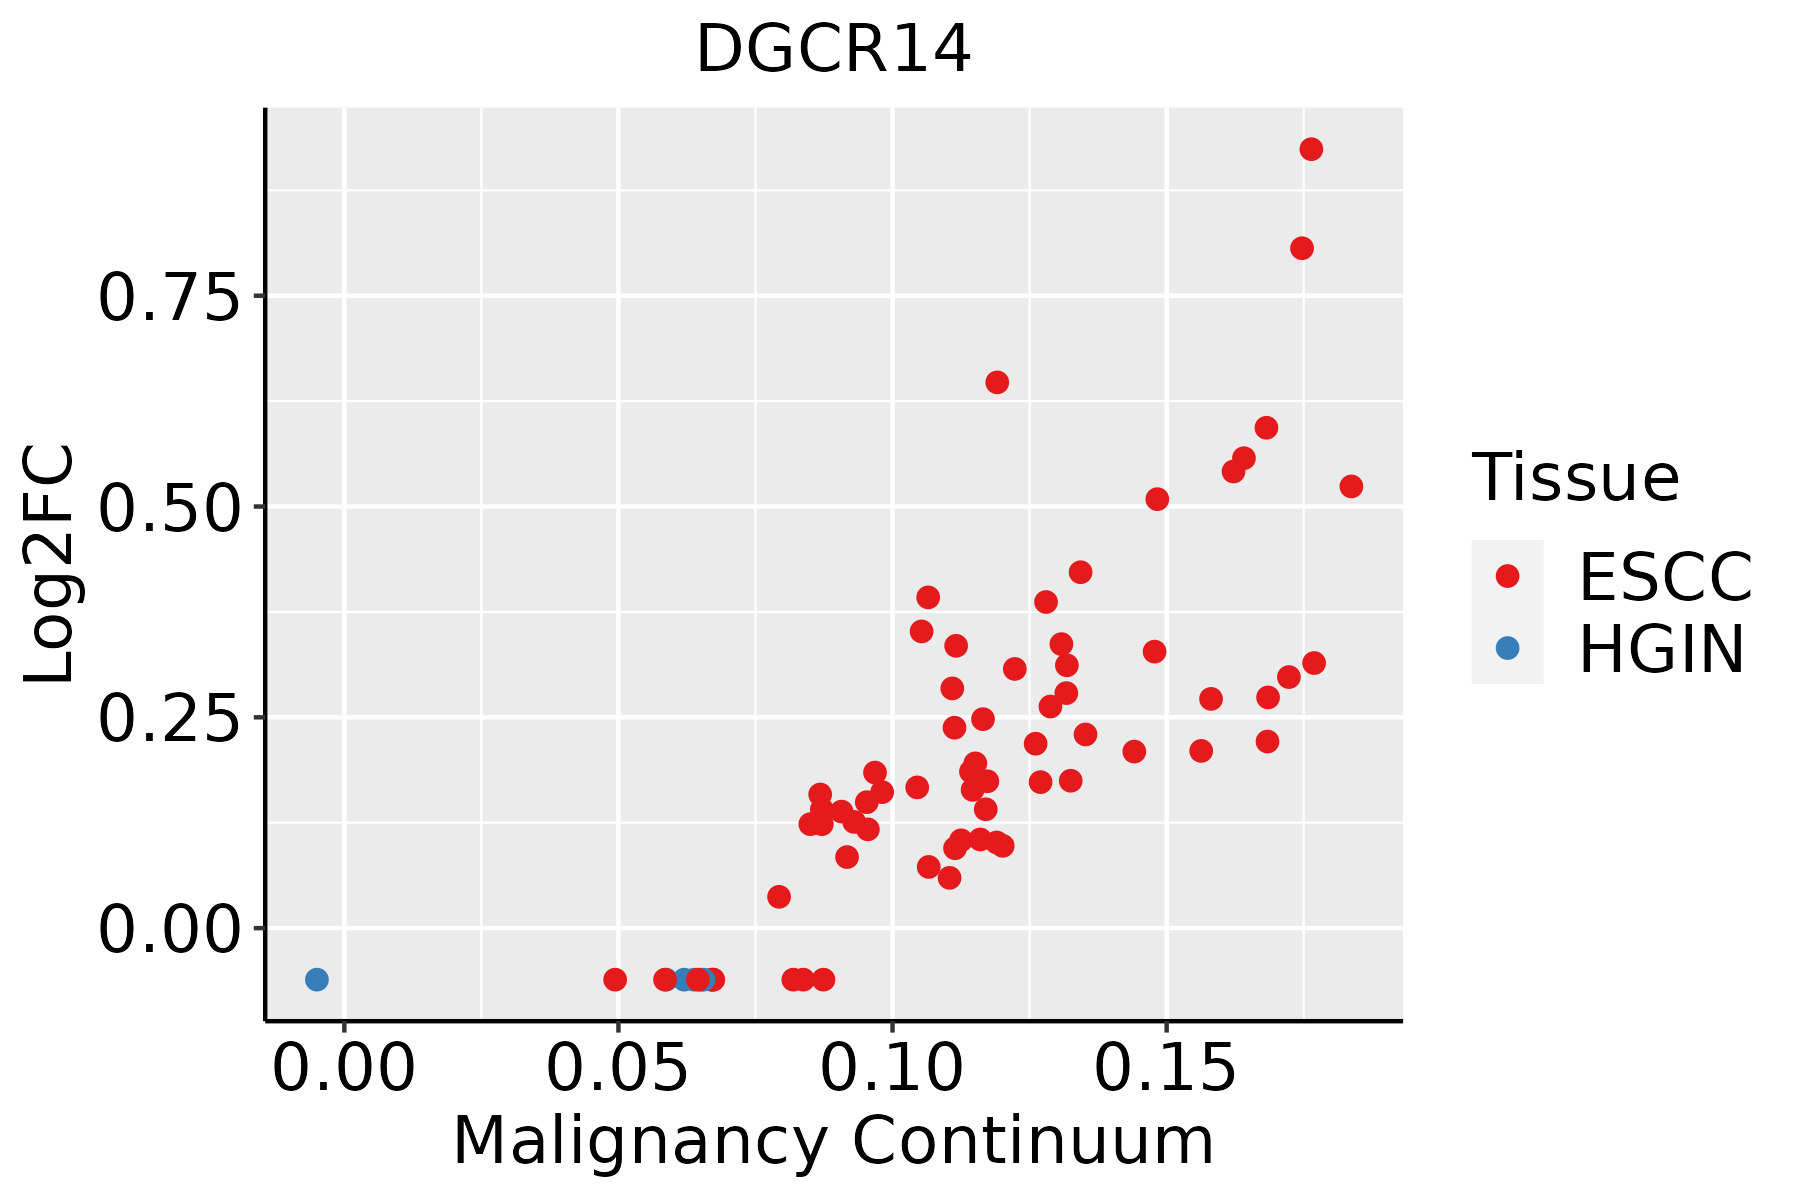 | ESCC: Esophageal squamous cell carcinoma |
| HGIN: High-grade intraepithelial neoplasias | ||
| LGIN: Low-grade intraepithelial neoplasias | ||
| Oral Cavity | 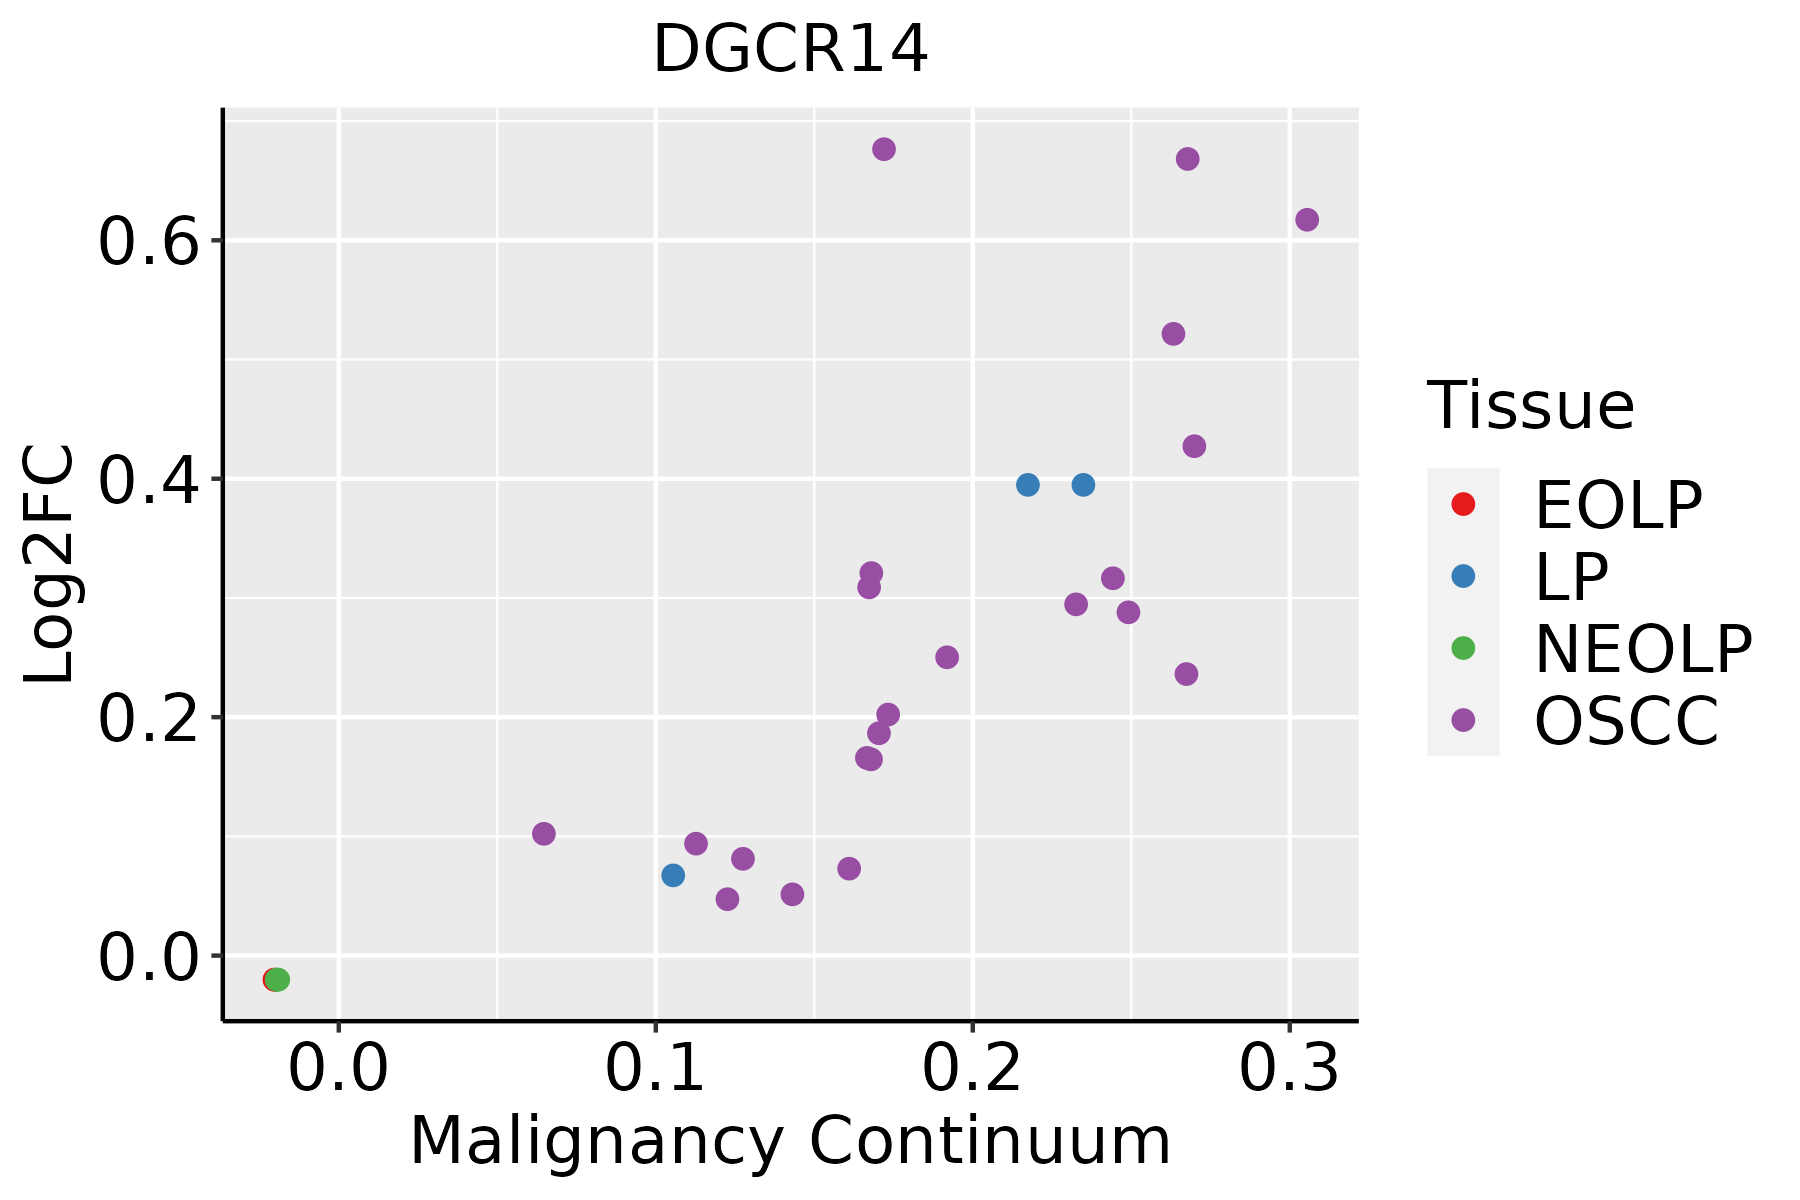 | EOLP: Erosive Oral lichen planus |
| LP: leukoplakia | ||
| NEOLP: Non-erosive oral lichen planus | ||
| OSCC: Oral squamous cell carcinoma |
| ∗log2FC in expression of this searched gene in stem-like cells from each diseased tissue sample relative to stem-like cells in normal samples in each tissue plotted against the malignancy continuum. Samples are colored based on if they are from different disease stage. |
Top |
Malignant transformation related pathway analysis |
| Find out the enriched GO biological processes and KEGG pathways involved in transition from healthy to precancer to cancer |
| Tissue | Disease Stage | Enriched GO biological Processes |
| Colorectum | AD |  |
| Colorectum | SER |  |
| Colorectum | MSS |  |
| Colorectum | MSI-H |  |
| Colorectum | FAP |  |
| ∗Top 15 enriched GO BP terms are showed in the bar plot of each disease state in each tissue. Each row represents a significant GO biological process which is colored according to the -log10(p.adjust). |
| Page: 1 2 3 4 5 6 7 8 9 |
| GO ID | Tissue | Disease Stage | Description | Gene Ratio | Bg Ratio | pvalue | p.adjust | Count |
| Page: 1 |
| Pathway ID | Tissue | Disease Stage | Description | Gene Ratio | Bg Ratio | pvalue | p.adjust | qvalue | Count |
| Page: 1 |
Top |
Cell-cell communication analysis |
| Identification of potential cell-cell interactions between two cell types and their ligand-receptor pairs for different disease states |
| Ligand | Receptor | LRpair | Pathway | Tissue | Disease Stage |
| Page: 1 |
Top |
Single-cell gene regulatory network inference analysis |
| Find out the significant the regulons (TFs) and the target genes of each regulon across cell types for different disease states |
| TF | Cell Type | Tissue | Disease Stage | Target Gene | RSS | Regulon Activity |
| ∗The dot plots of a searched regulon are shown for all cell subpopulations in each disease state of each tissue based on the regulon specific score inferred using pySCENIC and by calculating the average expression. |
| Page: 1 |
Top |
Somatic mutation of malignant transformation related genes |
| Annotation of somatic variants for genes involved in malignant transformation |
| Hugo Symbol | Variant Class | Variant Classification | dbSNP RS | HGVSc | HGVSp | HGVSp Short | SWISSPROT | BIOTYPE | SIFT | PolyPhen | Tumor Sample Barcode | Tissue | Histology | Sex | Age | Stage | Therapy Types | Drugs | Outcome |
| DGCR14 | SNV | Missense_Mutation | c.741N>C | p.Lys247Asn | p.K247N | Q96DF8 | protein_coding | tolerated(0.13) | possibly_damaging(0.505) | TCGA-A2-A0YK-01 | Breast | breast invasive carcinoma | Female | <65 | I/II | Chemotherapy | cytoxan | SD | |
| DGCR14 | SNV | Missense_Mutation | c.565G>C | p.Glu189Gln | p.E189Q | Q96DF8 | protein_coding | tolerated(0.25) | benign(0.253) | TCGA-A8-A09G-01 | Breast | breast invasive carcinoma | Female | >=65 | III/IV | Unknown | Unknown | SD | |
| DGCR14 | SNV | Missense_Mutation | rs549848339 | c.286C>T | p.Arg96Trp | p.R96W | Q96DF8 | protein_coding | deleterious(0.01) | possibly_damaging(0.812) | TCGA-A8-A09G-01 | Breast | breast invasive carcinoma | Female | >=65 | III/IV | Unknown | Unknown | SD |
| DGCR14 | SNV | Missense_Mutation | rs142803658 | c.1346N>A | p.Arg449His | p.R449H | Q96DF8 | protein_coding | tolerated(0.08) | benign(0) | TCGA-AO-A128-01 | Breast | breast invasive carcinoma | Female | <65 | I/II | Chemotherapy | doxorubicin | SD |
| DGCR14 | SNV | Missense_Mutation | c.1168N>A | p.Leu390Met | p.L390M | Q96DF8 | protein_coding | tolerated(0.09) | probably_damaging(0.999) | TCGA-AO-A128-01 | Breast | breast invasive carcinoma | Female | <65 | I/II | Chemotherapy | doxorubicin | SD | |
| DGCR14 | SNV | Missense_Mutation | rs780144981 | c.1328N>T | p.Ala443Val | p.A443V | Q96DF8 | protein_coding | tolerated(0.11) | benign(0.003) | TCGA-AR-A2LQ-01 | Breast | breast invasive carcinoma | Female | <65 | I/II | Chemotherapy | docetaxel | SD |
| DGCR14 | SNV | Missense_Mutation | rs534119591 | c.518N>A | p.Arg173Lys | p.R173K | Q96DF8 | protein_coding | tolerated(1) | benign(0) | TCGA-D8-A27G-01 | Breast | breast invasive carcinoma | Female | >=65 | I/II | Unknown | Unknown | SD |
| DGCR14 | SNV | Missense_Mutation | novel | c.584A>C | p.Asn195Thr | p.N195T | Q96DF8 | protein_coding | tolerated(0.5) | benign(0.089) | TCGA-FU-A3HZ-01 | Cervix | cervical & endocervical cancer | Female | <65 | I/II | Chemotherapy | cisplatin | CR |
| DGCR14 | SNV | Missense_Mutation | c.1204G>A | p.Val402Met | p.V402M | Q96DF8 | protein_coding | deleterious(0.01) | probably_damaging(0.995) | TCGA-IR-A3LH-01 | Cervix | cervical & endocervical cancer | Female | <65 | I/II | Chemotherapy | cisplatin | CR | |
| DGCR14 | SNV | Missense_Mutation | novel | c.508N>A | p.Ala170Thr | p.A170T | Q96DF8 | protein_coding | tolerated(0.05) | possibly_damaging(0.778) | TCGA-AA-3811-01 | Colorectum | colon adenocarcinoma | Female | >=65 | III/IV | Unknown | Unknown | PD |
| Page: 1 2 3 4 5 6 |
Top |
Related drugs of malignant transformation related genes |
| Identification of chemicals and drugs interact with genes involved in malignant transfromation |
| (DGIdb 4.0) |
| Entrez ID | Symbol | Category | Interaction Types | Drug Claim Name | Drug Name | PMIDs |
| Page: 1 |

Copyright 2023-Present -The University of Texas Health Science Center at Houston |