
|
|||||
|
 | |
| |
| |
| |
| |
| |
|
Gene: DGAT2 |
Gene summary for DGAT2 |
| Gene information | Species | Human | Gene symbol | DGAT2 | Gene ID | 84649 |
| Gene name | diacylglycerol O-acyltransferase 2 | |
| Gene Alias | ARAT | |
| Cytomap | 11q13.5 | |
| Gene Type | protein-coding | GO ID | GO:0001523 | UniProtAcc | Q96PD7 |
Top |
Malignant transformation analysis |
| Identification of the aberrant gene expression in precancerous and cancerous lesions by comparing the gene expression of stem-like cells in diseased tissues with normal stem cells |
| Entrez ID | Symbol | Replicates | Species | Organ | Tissue | Adj P-value | Log2FC | Malignancy |
| 84649 | DGAT2 | LZE24T | Human | Esophagus | ESCC | 2.87e-10 | 1.96e-01 | 0.0596 |
| 84649 | DGAT2 | P2T-E | Human | Esophagus | ESCC | 1.74e-33 | 7.39e-01 | 0.1177 |
| 84649 | DGAT2 | P4T-E | Human | Esophagus | ESCC | 2.17e-08 | 1.93e-01 | 0.1323 |
| 84649 | DGAT2 | P10T-E | Human | Esophagus | ESCC | 1.71e-04 | 8.55e-02 | 0.116 |
| 84649 | DGAT2 | P15T-E | Human | Esophagus | ESCC | 7.46e-06 | 7.13e-02 | 0.1149 |
| 84649 | DGAT2 | P16T-E | Human | Esophagus | ESCC | 3.57e-04 | 1.61e-01 | 0.1153 |
| 84649 | DGAT2 | P21T-E | Human | Esophagus | ESCC | 2.35e-04 | 1.14e-01 | 0.1617 |
| 84649 | DGAT2 | P26T-E | Human | Esophagus | ESCC | 1.85e-03 | 1.66e-01 | 0.1276 |
| 84649 | DGAT2 | P27T-E | Human | Esophagus | ESCC | 2.48e-02 | 9.49e-02 | 0.1055 |
| 84649 | DGAT2 | P37T-E | Human | Esophagus | ESCC | 2.48e-05 | 9.84e-02 | 0.1371 |
| 84649 | DGAT2 | P52T-E | Human | Esophagus | ESCC | 7.14e-04 | 1.07e-01 | 0.1555 |
| 84649 | DGAT2 | P62T-E | Human | Esophagus | ESCC | 7.23e-15 | 1.85e-01 | 0.1302 |
| 84649 | DGAT2 | P75T-E | Human | Esophagus | ESCC | 6.19e-08 | 1.64e-01 | 0.1125 |
| 84649 | DGAT2 | P76T-E | Human | Esophagus | ESCC | 2.83e-02 | 9.13e-02 | 0.1207 |
| 84649 | DGAT2 | P79T-E | Human | Esophagus | ESCC | 3.24e-03 | 6.31e-02 | 0.1154 |
| 84649 | DGAT2 | P80T-E | Human | Esophagus | ESCC | 7.41e-21 | 5.84e-01 | 0.155 |
| 84649 | DGAT2 | P82T-E | Human | Esophagus | ESCC | 2.55e-02 | 1.58e-01 | 0.1072 |
| 84649 | DGAT2 | P83T-E | Human | Esophagus | ESCC | 4.72e-13 | 4.49e-01 | 0.1738 |
| 84649 | DGAT2 | P107T-E | Human | Esophagus | ESCC | 1.69e-04 | 1.36e-01 | 0.171 |
| 84649 | DGAT2 | P128T-E | Human | Esophagus | ESCC | 2.02e-05 | 2.16e-01 | 0.1241 |
| Page: 1 2 |
| Tissue | Expression Dynamics | Abbreviation |
| Esophagus |  | ESCC: Esophageal squamous cell carcinoma |
| HGIN: High-grade intraepithelial neoplasias | ||
| LGIN: Low-grade intraepithelial neoplasias | ||
| Liver | 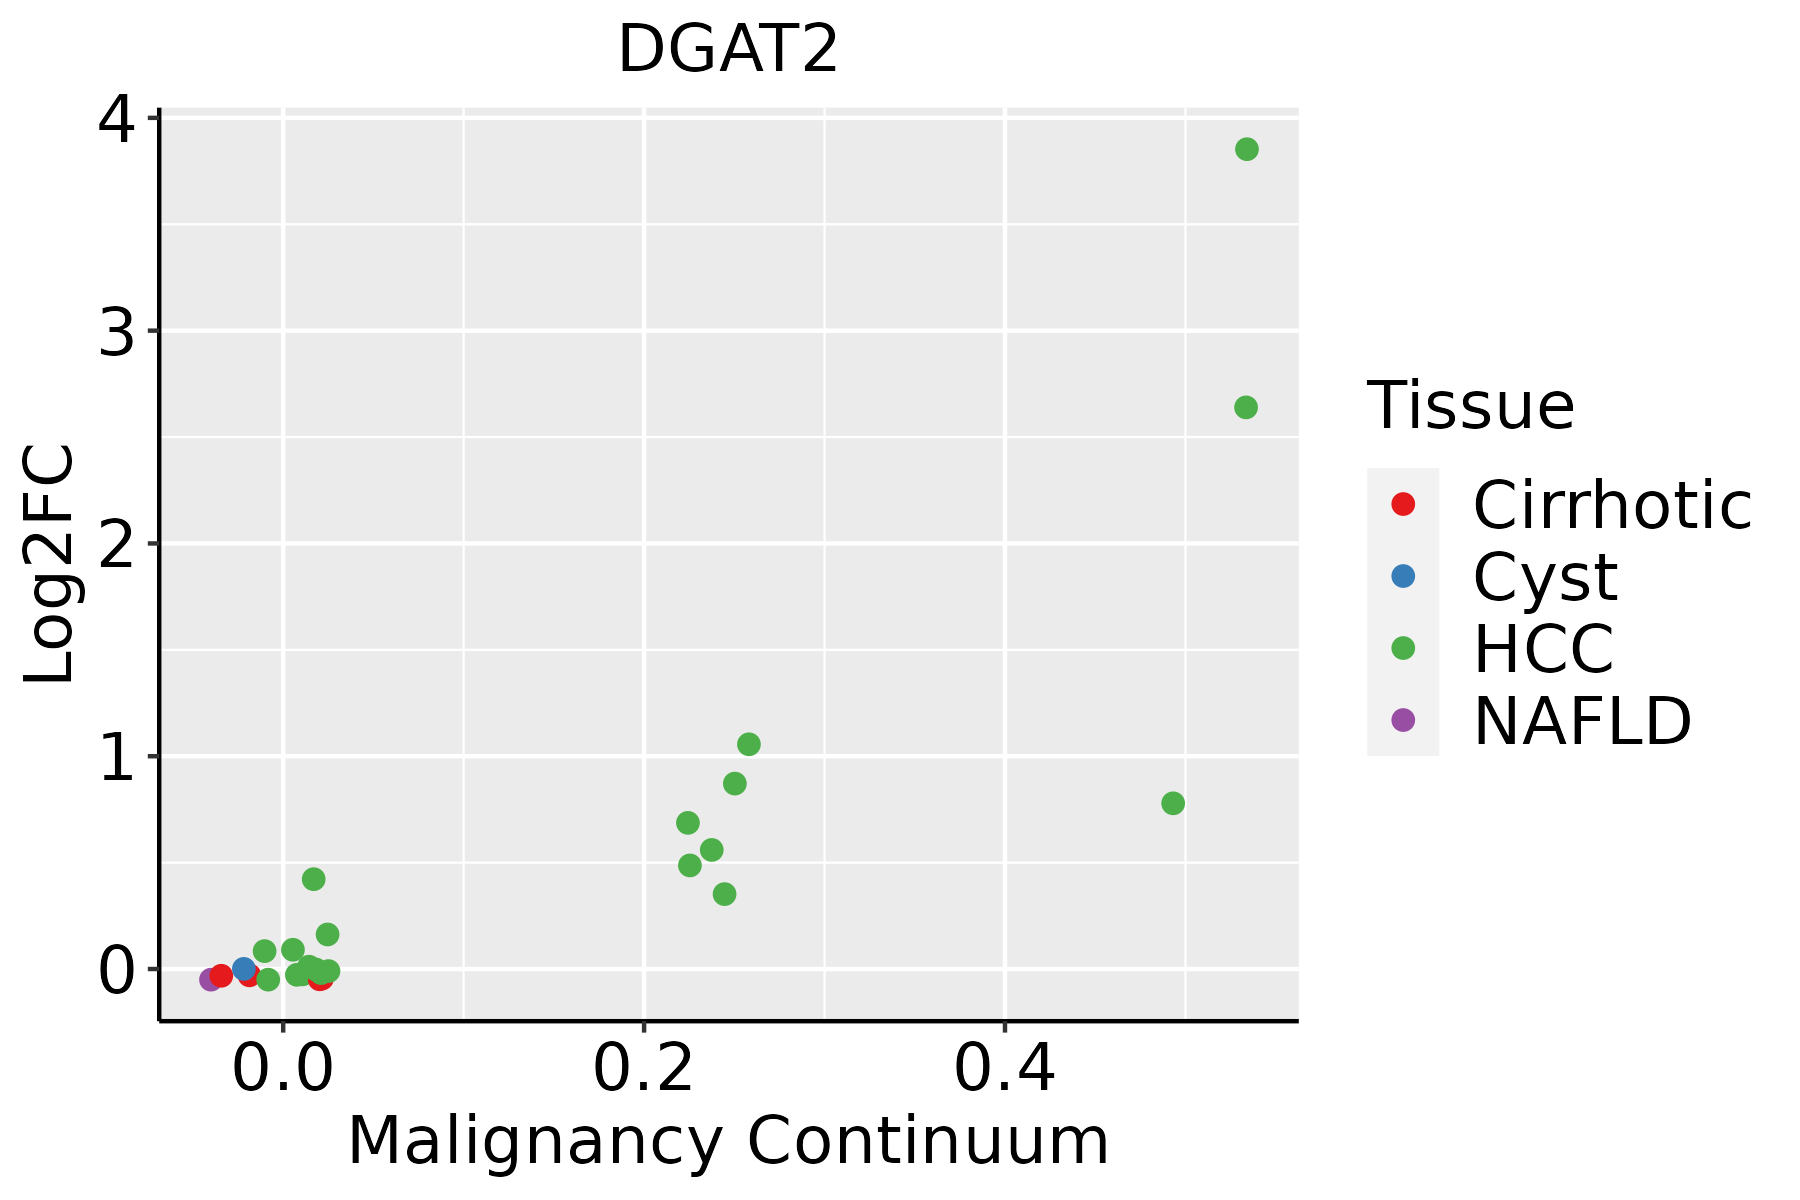 | HCC: Hepatocellular carcinoma |
| NAFLD: Non-alcoholic fatty liver disease |
| ∗log2FC in expression of this searched gene in stem-like cells from each diseased tissue sample relative to stem-like cells in normal samples in each tissue plotted against the malignancy continuum. Samples are colored based on if they are from different disease stage. |
Top |
Malignant transformation related pathway analysis |
| Find out the enriched GO biological processes and KEGG pathways involved in transition from healthy to precancer to cancer |
| Tissue | Disease Stage | Enriched GO biological Processes |
| Colorectum | AD |  |
| Colorectum | SER |  |
| Colorectum | MSS |  |
| Colorectum | MSI-H |  |
| Colorectum | FAP |  |
| ∗Top 15 enriched GO BP terms are showed in the bar plot of each disease state in each tissue. Each row represents a significant GO biological process which is colored according to the -log10(p.adjust). |
| Page: 1 2 3 4 5 6 7 8 9 |
| GO ID | Tissue | Disease Stage | Description | Gene Ratio | Bg Ratio | pvalue | p.adjust | Count |
| GO:0051235110 | Esophagus | ESCC | maintenance of location | 200/8552 | 327/18723 | 1.01e-08 | 2.02e-07 | 200 |
| GO:0006753110 | Esophagus | ESCC | nucleoside phosphate metabolic process | 288/8552 | 497/18723 | 1.80e-08 | 3.50e-07 | 288 |
| GO:0019693111 | Esophagus | ESCC | ribose phosphate metabolic process | 234/8552 | 396/18723 | 4.24e-08 | 7.76e-07 | 234 |
| GO:0009117111 | Esophagus | ESCC | nucleotide metabolic process | 282/8552 | 489/18723 | 4.70e-08 | 8.50e-07 | 282 |
| GO:00059969 | Esophagus | ESCC | monosaccharide metabolic process | 159/8552 | 257/18723 | 1.11e-07 | 1.81e-06 | 159 |
| GO:00193189 | Esophagus | ESCC | hexose metabolic process | 147/8552 | 237/18723 | 2.63e-07 | 3.94e-06 | 147 |
| GO:00067906 | Esophagus | ESCC | sulfur compound metabolic process | 201/8552 | 339/18723 | 2.64e-07 | 3.94e-06 | 201 |
| GO:0009259111 | Esophagus | ESCC | ribonucleotide metabolic process | 224/8552 | 385/18723 | 4.41e-07 | 6.00e-06 | 224 |
| GO:00450175 | Esophagus | ESCC | glycerolipid biosynthetic process | 154/8552 | 252/18723 | 5.20e-07 | 6.96e-06 | 154 |
| GO:0072521111 | Esophagus | ESCC | purine-containing compound metabolic process | 238/8552 | 416/18723 | 1.20e-06 | 1.49e-05 | 238 |
| GO:0009150111 | Esophagus | ESCC | purine ribonucleotide metabolic process | 213/8552 | 368/18723 | 1.40e-06 | 1.69e-05 | 213 |
| GO:0006163111 | Esophagus | ESCC | purine nucleotide metabolic process | 226/8552 | 396/18723 | 2.81e-06 | 3.21e-05 | 226 |
| GO:00060668 | Esophagus | ESCC | alcohol metabolic process | 202/8552 | 353/18723 | 7.32e-06 | 7.26e-05 | 202 |
| GO:00193958 | Esophagus | ESCC | fatty acid oxidation | 69/8552 | 103/18723 | 9.95e-06 | 9.44e-05 | 69 |
| GO:00060069 | Esophagus | ESCC | glucose metabolic process | 119/8552 | 196/18723 | 1.51e-05 | 1.36e-04 | 119 |
| GO:00421573 | Esophagus | ESCC | lipoprotein metabolic process | 86/8552 | 135/18723 | 1.78e-05 | 1.57e-04 | 86 |
| GO:00344407 | Esophagus | ESCC | lipid oxidation | 71/8552 | 108/18723 | 2.00e-05 | 1.74e-04 | 71 |
| GO:00066318 | Esophagus | ESCC | fatty acid metabolic process | 217/8552 | 390/18723 | 4.21e-05 | 3.39e-04 | 217 |
| GO:00199155 | Esophagus | ESCC | lipid storage | 58/8552 | 87/18723 | 6.15e-05 | 4.72e-04 | 58 |
| GO:00442626 | Esophagus | ESCC | cellular carbohydrate metabolic process | 160/8552 | 283/18723 | 1.43e-04 | 9.66e-04 | 160 |
| Page: 1 2 3 4 5 6 |
| Pathway ID | Tissue | Disease Stage | Description | Gene Ratio | Bg Ratio | pvalue | p.adjust | qvalue | Count |
| hsa005615 | Liver | HCC | Glycerolipid metabolism | 41/4020 | 63/8465 | 3.59e-03 | 1.12e-02 | 6.22e-03 | 41 |
| hsa0056112 | Liver | HCC | Glycerolipid metabolism | 41/4020 | 63/8465 | 3.59e-03 | 1.12e-02 | 6.22e-03 | 41 |
| Page: 1 |
Top |
Cell-cell communication analysis |
| Identification of potential cell-cell interactions between two cell types and their ligand-receptor pairs for different disease states |
| Ligand | Receptor | LRpair | Pathway | Tissue | Disease Stage |
| Page: 1 |
Top |
Single-cell gene regulatory network inference analysis |
| Find out the significant the regulons (TFs) and the target genes of each regulon across cell types for different disease states |
| TF | Cell Type | Tissue | Disease Stage | Target Gene | RSS | Regulon Activity |
| ∗The dot plots of a searched regulon are shown for all cell subpopulations in each disease state of each tissue based on the regulon specific score inferred using pySCENIC and by calculating the average expression. |
| Page: 1 |
Top |
Somatic mutation of malignant transformation related genes |
| Annotation of somatic variants for genes involved in malignant transformation |
| Hugo Symbol | Variant Class | Variant Classification | dbSNP RS | HGVSc | HGVSp | HGVSp Short | SWISSPROT | BIOTYPE | SIFT | PolyPhen | Tumor Sample Barcode | Tissue | Histology | Sex | Age | Stage | Therapy Types | Drugs | Outcome |
| DGAT2 | SNV | Missense_Mutation | rs139005829 | c.871G>A | p.Glu291Lys | p.E291K | Q96PD7 | protein_coding | tolerated(0.53) | benign(0.427) | TCGA-B6-A0IK-01 | Breast | breast invasive carcinoma | Female | <65 | III/IV | Unknown | Unknown | PD |
| DGAT2 | SNV | Missense_Mutation | c.280N>G | p.Ile94Val | p.I94V | Q96PD7 | protein_coding | deleterious(0.05) | benign(0.026) | TCGA-E2-A1LK-01 | Breast | breast invasive carcinoma | Female | >=65 | III/IV | Unknown | Unknown | PD | |
| DGAT2 | SNV | Missense_Mutation | novel | c.814G>C | p.Asp272His | p.D272H | Q96PD7 | protein_coding | tolerated(0.48) | probably_damaging(0.969) | TCGA-DS-A1OB-01 | Cervix | cervical & endocervical cancer | Female | <65 | I/II | Chemotherapy | carboplatin | PD |
| DGAT2 | SNV | Missense_Mutation | c.103N>C | p.Glu35Gln | p.E35Q | Q96PD7 | protein_coding | tolerated_low_confidence(0.63) | benign(0.018) | TCGA-EK-A2R8-01 | Cervix | cervical & endocervical cancer | Female | <65 | I/II | Unknown | Unknown | SD | |
| DGAT2 | SNV | Missense_Mutation | rs201842357 | c.967N>A | p.Asp323Asn | p.D323N | Q96PD7 | protein_coding | tolerated(1) | benign(0) | TCGA-AA-3655-01 | Colorectum | colon adenocarcinoma | Male | >=65 | I/II | Unknown | Unknown | SD |
| DGAT2 | SNV | Missense_Mutation | c.438G>T | p.Lys146Asn | p.K146N | Q96PD7 | protein_coding | deleterious(0) | probably_damaging(0.986) | TCGA-AA-3977-01 | Colorectum | colon adenocarcinoma | Male | >=65 | I/II | Unknown | Unknown | SD | |
| DGAT2 | SNV | Missense_Mutation | rs140088423 | c.802N>T | p.Arg268Cys | p.R268C | Q96PD7 | protein_coding | deleterious(0) | possibly_damaging(0.825) | TCGA-AG-3892-01 | Colorectum | rectum adenocarcinoma | Female | <65 | I/II | Unknown | Unknown | SD |
| DGAT2 | insertion | Nonsense_Mutation | novel | c.778_779insAGGGCTTTGTGAAGCTGGCCCTGCGTCATGGGTGAGTGC | p.Gly270_Ala271insTer | p.G270_A271ins* | Q96PD7 | protein_coding | TCGA-CM-6676-01 | Colorectum | colon adenocarcinoma | Male | >=65 | I/II | Unknown | Unknown | SD | ||
| DGAT2 | SNV | Missense_Mutation | novel | c.491N>T | p.Gly164Val | p.G164V | Q96PD7 | protein_coding | deleterious(0) | probably_damaging(1) | TCGA-A5-A0G2-01 | Endometrium | uterine corpus endometrioid carcinoma | Female | <65 | III/IV | Unknown | Unknown | SD |
| DGAT2 | SNV | Missense_Mutation | novel | c.19N>A | p.Ala7Thr | p.A7T | Q96PD7 | protein_coding | deleterious_low_confidence(0) | benign(0.318) | TCGA-AJ-A3BG-01 | Endometrium | uterine corpus endometrioid carcinoma | Female | >=65 | I/II | Chemotherapy | carboplatin | PD |
| Page: 1 2 3 4 |
Top |
Related drugs of malignant transformation related genes |
| Identification of chemicals and drugs interact with genes involved in malignant transfromation |
| (DGIdb 4.0) |
| Entrez ID | Symbol | Category | Interaction Types | Drug Claim Name | Drug Name | PMIDs |
| 84649 | DGAT2 | ENZYME | Vitamin B3 | |||
| 84649 | DGAT2 | ENZYME | PMID25470667-Compound-roselipins | |||
| 84649 | DGAT2 | ENZYME | PMID25470667-Compound-Figure4-1A | |||
| 84649 | DGAT2 | ENZYME | ARI-3037MO | |||
| 84649 | DGAT2 | ENZYME | PF-06427878 |
| Page: 1 |

Copyright 2023-Present -The University of Texas Health Science Center at Houston |