
|
|||||
|
 | |
| |
| |
| |
| |
| |
|
Gene: DGAT1 |
Gene summary for DGAT1 |
| Gene information | Species | Human | Gene symbol | DGAT1 | Gene ID | 8694 |
| Gene name | diacylglycerol O-acyltransferase 1 | |
| Gene Alias | ARAT | |
| Cytomap | 8q24.3 | |
| Gene Type | protein-coding | GO ID | GO:0001523 | UniProtAcc | O75907 |
Top |
Malignant transformation analysis |
| Identification of the aberrant gene expression in precancerous and cancerous lesions by comparing the gene expression of stem-like cells in diseased tissues with normal stem cells |
| Entrez ID | Symbol | Replicates | Species | Organ | Tissue | Adj P-value | Log2FC | Malignancy |
| 8694 | DGAT1 | HTA11_2487_2000001011 | Human | Colorectum | SER | 5.35e-12 | 7.04e-01 | -0.1808 |
| 8694 | DGAT1 | HTA11_1938_2000001011 | Human | Colorectum | AD | 7.13e-04 | 1.79e-01 | -0.0811 |
| 8694 | DGAT1 | HTA11_78_2000001011 | Human | Colorectum | AD | 3.12e-02 | 2.72e-01 | -0.1088 |
| 8694 | DGAT1 | HTA11_347_2000001011 | Human | Colorectum | AD | 4.55e-13 | 3.92e-01 | -0.1954 |
| 8694 | DGAT1 | HTA11_411_2000001011 | Human | Colorectum | SER | 9.76e-05 | 9.20e-01 | -0.2602 |
| 8694 | DGAT1 | HTA11_2112_2000001011 | Human | Colorectum | SER | 2.82e-07 | 8.06e-01 | -0.2196 |
| 8694 | DGAT1 | HTA11_696_2000001011 | Human | Colorectum | AD | 1.29e-04 | 3.44e-01 | -0.1464 |
| 8694 | DGAT1 | HTA11_1391_2000001011 | Human | Colorectum | AD | 1.74e-03 | 3.40e-01 | -0.059 |
| 8694 | DGAT1 | HTA11_5216_2000001011 | Human | Colorectum | SER | 3.20e-02 | 3.95e-01 | -0.1462 |
| 8694 | DGAT1 | HTA11_99999971662_82457 | Human | Colorectum | MSS | 6.49e-07 | 3.99e-01 | 0.3859 |
| 8694 | DGAT1 | CRC-3-11773 | Human | Colorectum | CRC | 1.13e-11 | 5.77e-01 | 0.2564 |
| 8694 | DGAT1 | LZE20T | Human | Esophagus | ESCC | 3.74e-07 | 2.01e-01 | 0.0662 |
| 8694 | DGAT1 | LZE24T | Human | Esophagus | ESCC | 5.73e-04 | 1.95e-01 | 0.0596 |
| 8694 | DGAT1 | P1T-E | Human | Esophagus | ESCC | 1.57e-03 | 1.89e-01 | 0.0875 |
| 8694 | DGAT1 | P2T-E | Human | Esophagus | ESCC | 4.67e-11 | 1.11e-01 | 0.1177 |
| 8694 | DGAT1 | P4T-E | Human | Esophagus | ESCC | 7.48e-07 | 1.39e-01 | 0.1323 |
| 8694 | DGAT1 | P5T-E | Human | Esophagus | ESCC | 6.14e-12 | 1.42e-01 | 0.1327 |
| 8694 | DGAT1 | P8T-E | Human | Esophagus | ESCC | 4.14e-05 | 4.24e-02 | 0.0889 |
| 8694 | DGAT1 | P9T-E | Human | Esophagus | ESCC | 1.75e-09 | 1.70e-01 | 0.1131 |
| 8694 | DGAT1 | P10T-E | Human | Esophagus | ESCC | 4.50e-06 | 5.20e-02 | 0.116 |
| Page: 1 2 3 4 5 6 |
| Tissue | Expression Dynamics | Abbreviation |
| Colorectum (GSE201348) |  | FAP: Familial adenomatous polyposis |
| CRC: Colorectal cancer | ||
| Colorectum (HTA11) | 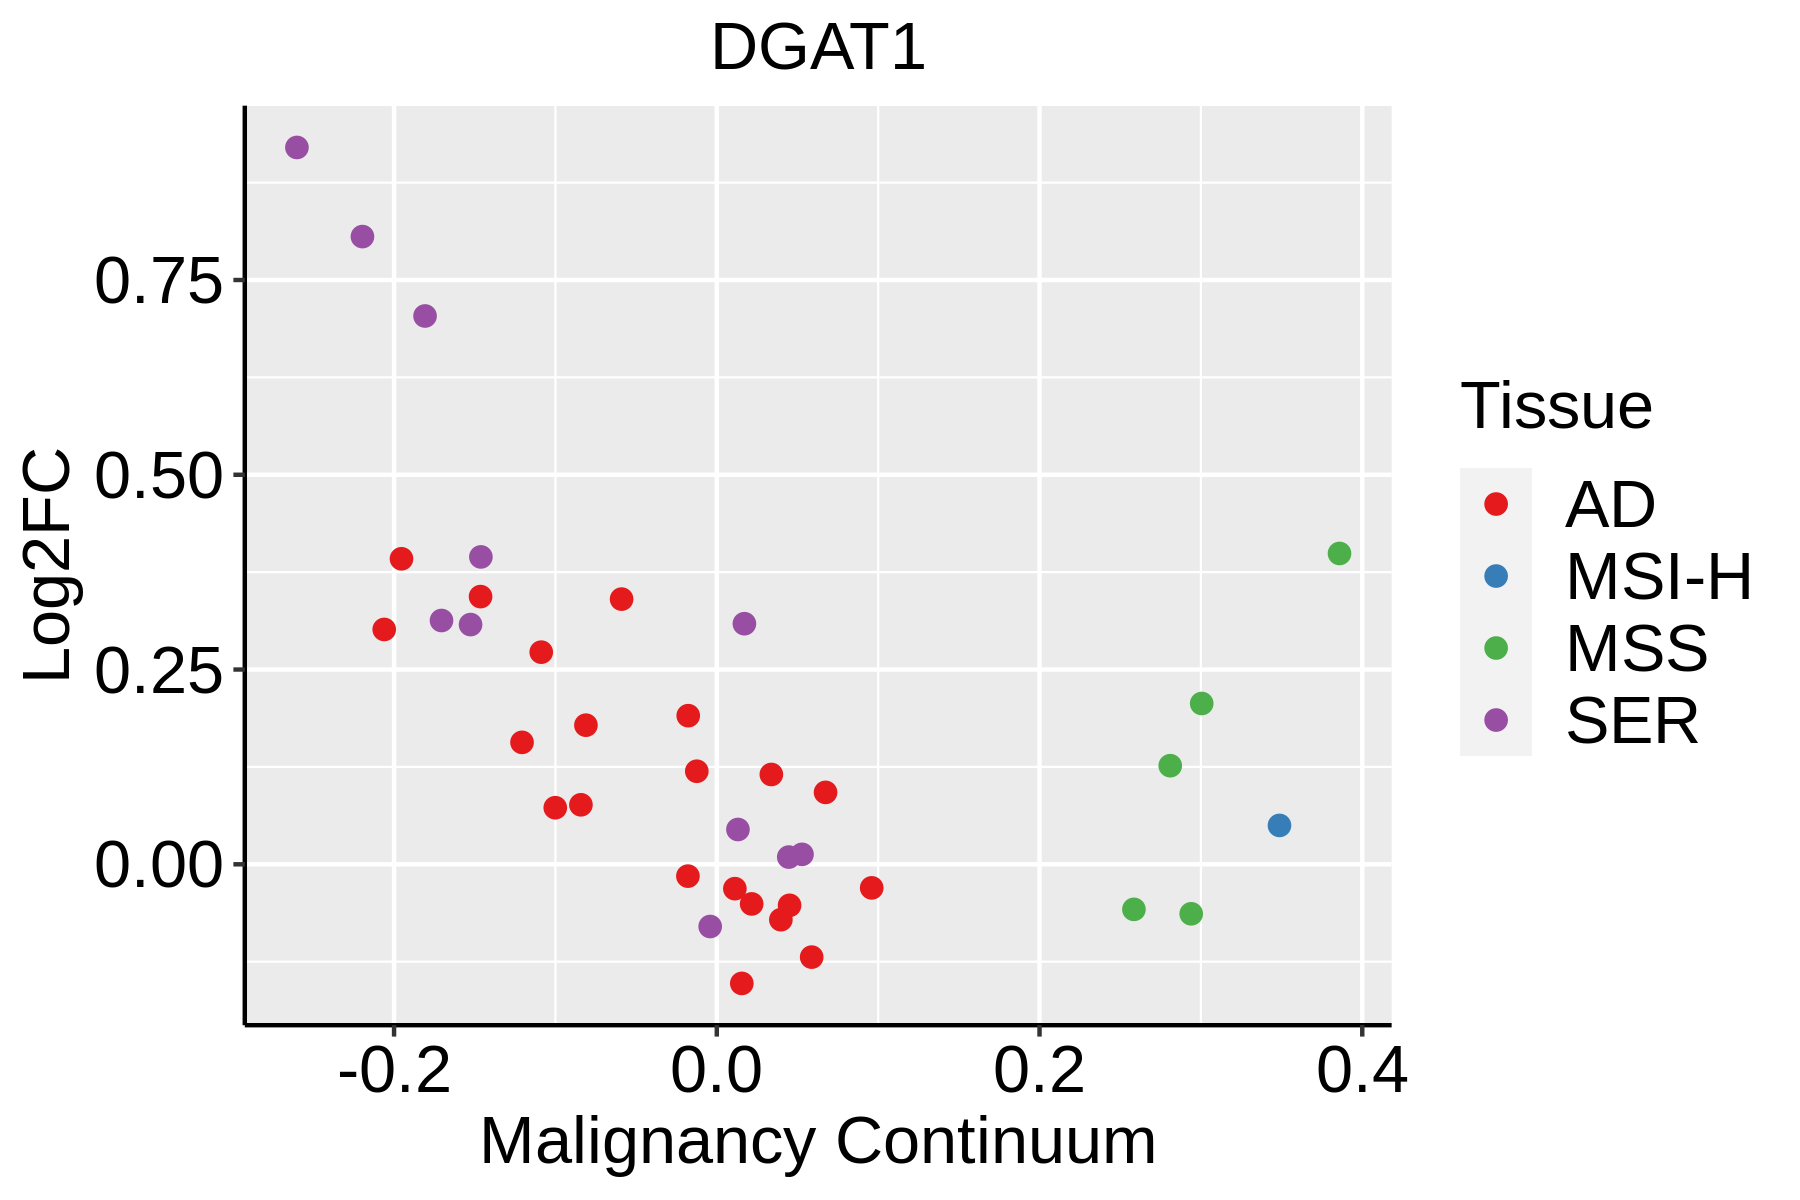 | AD: Adenomas |
| SER: Sessile serrated lesions | ||
| MSI-H: Microsatellite-high colorectal cancer | ||
| MSS: Microsatellite stable colorectal cancer | ||
| Esophagus | 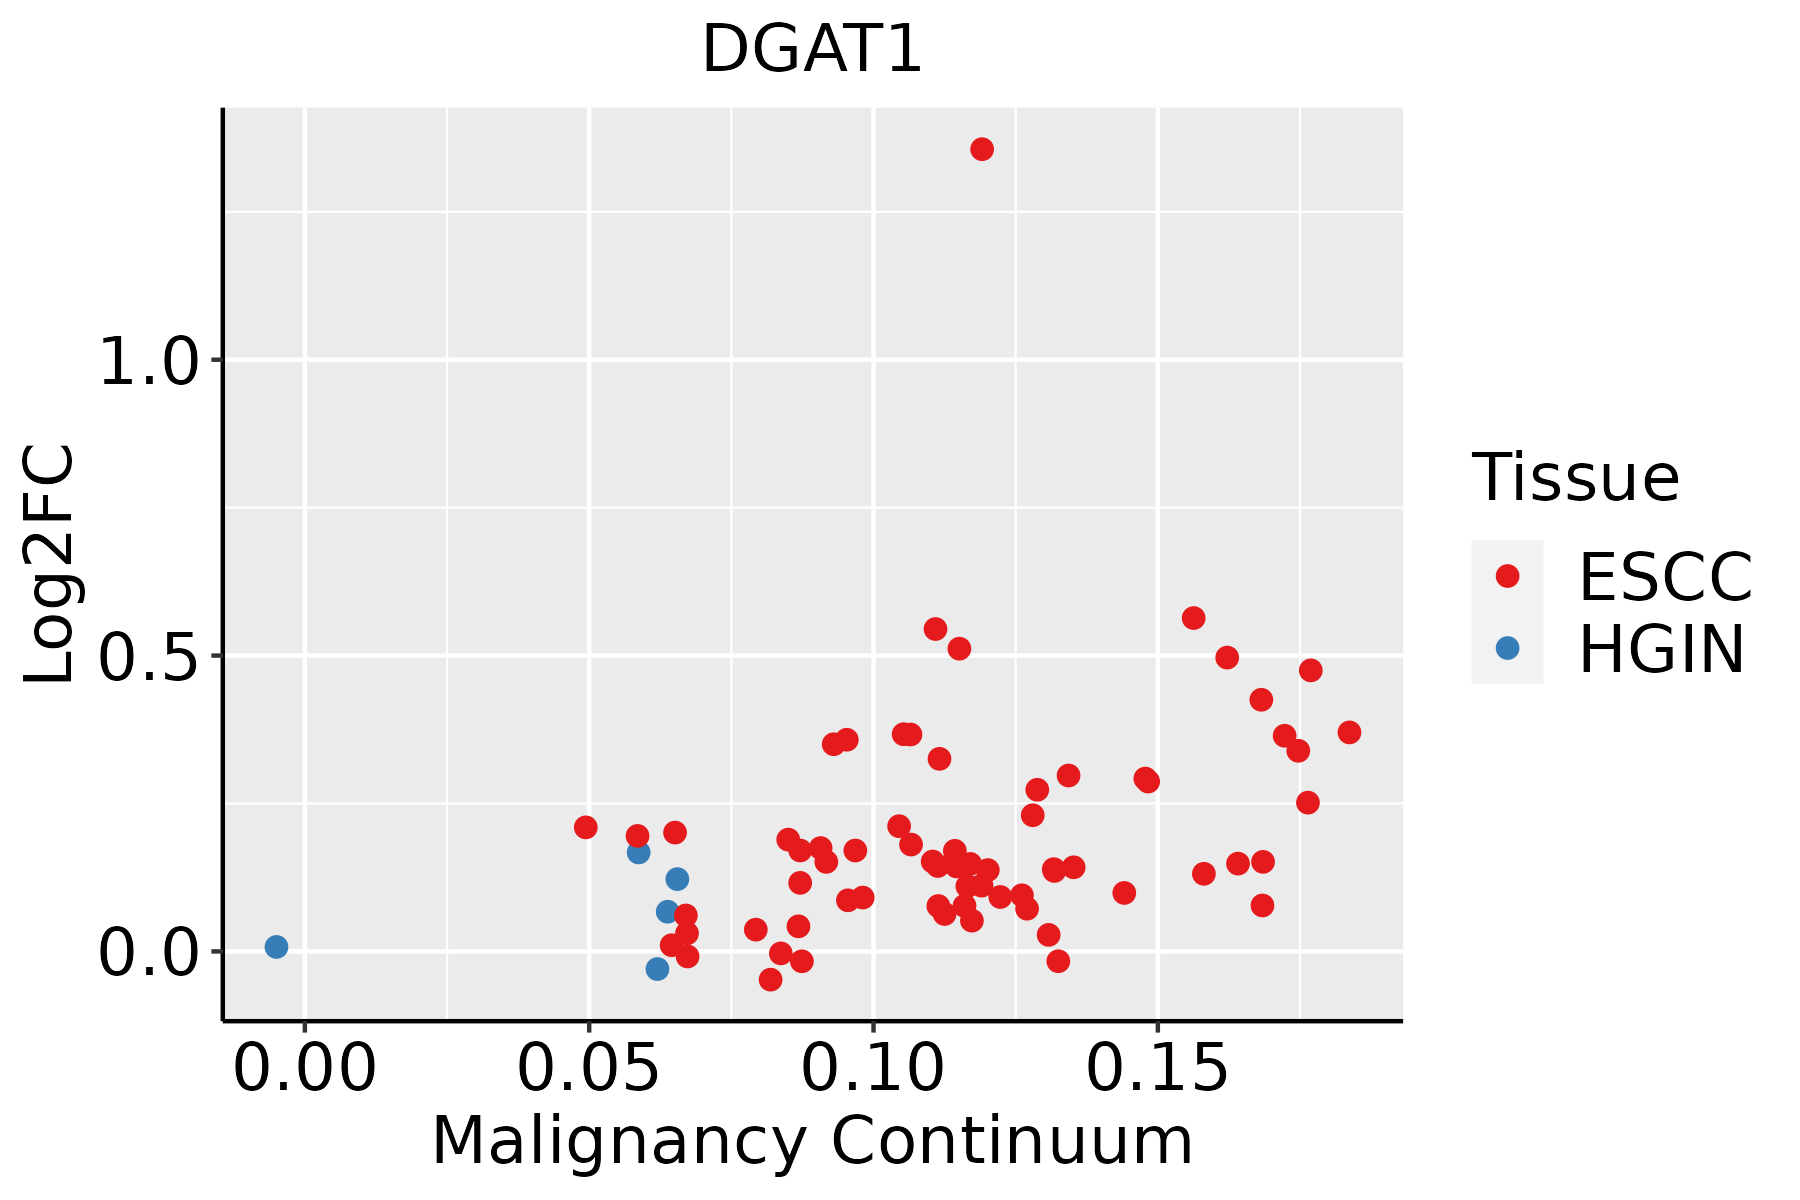 | ESCC: Esophageal squamous cell carcinoma |
| HGIN: High-grade intraepithelial neoplasias | ||
| LGIN: Low-grade intraepithelial neoplasias | ||
| GC | 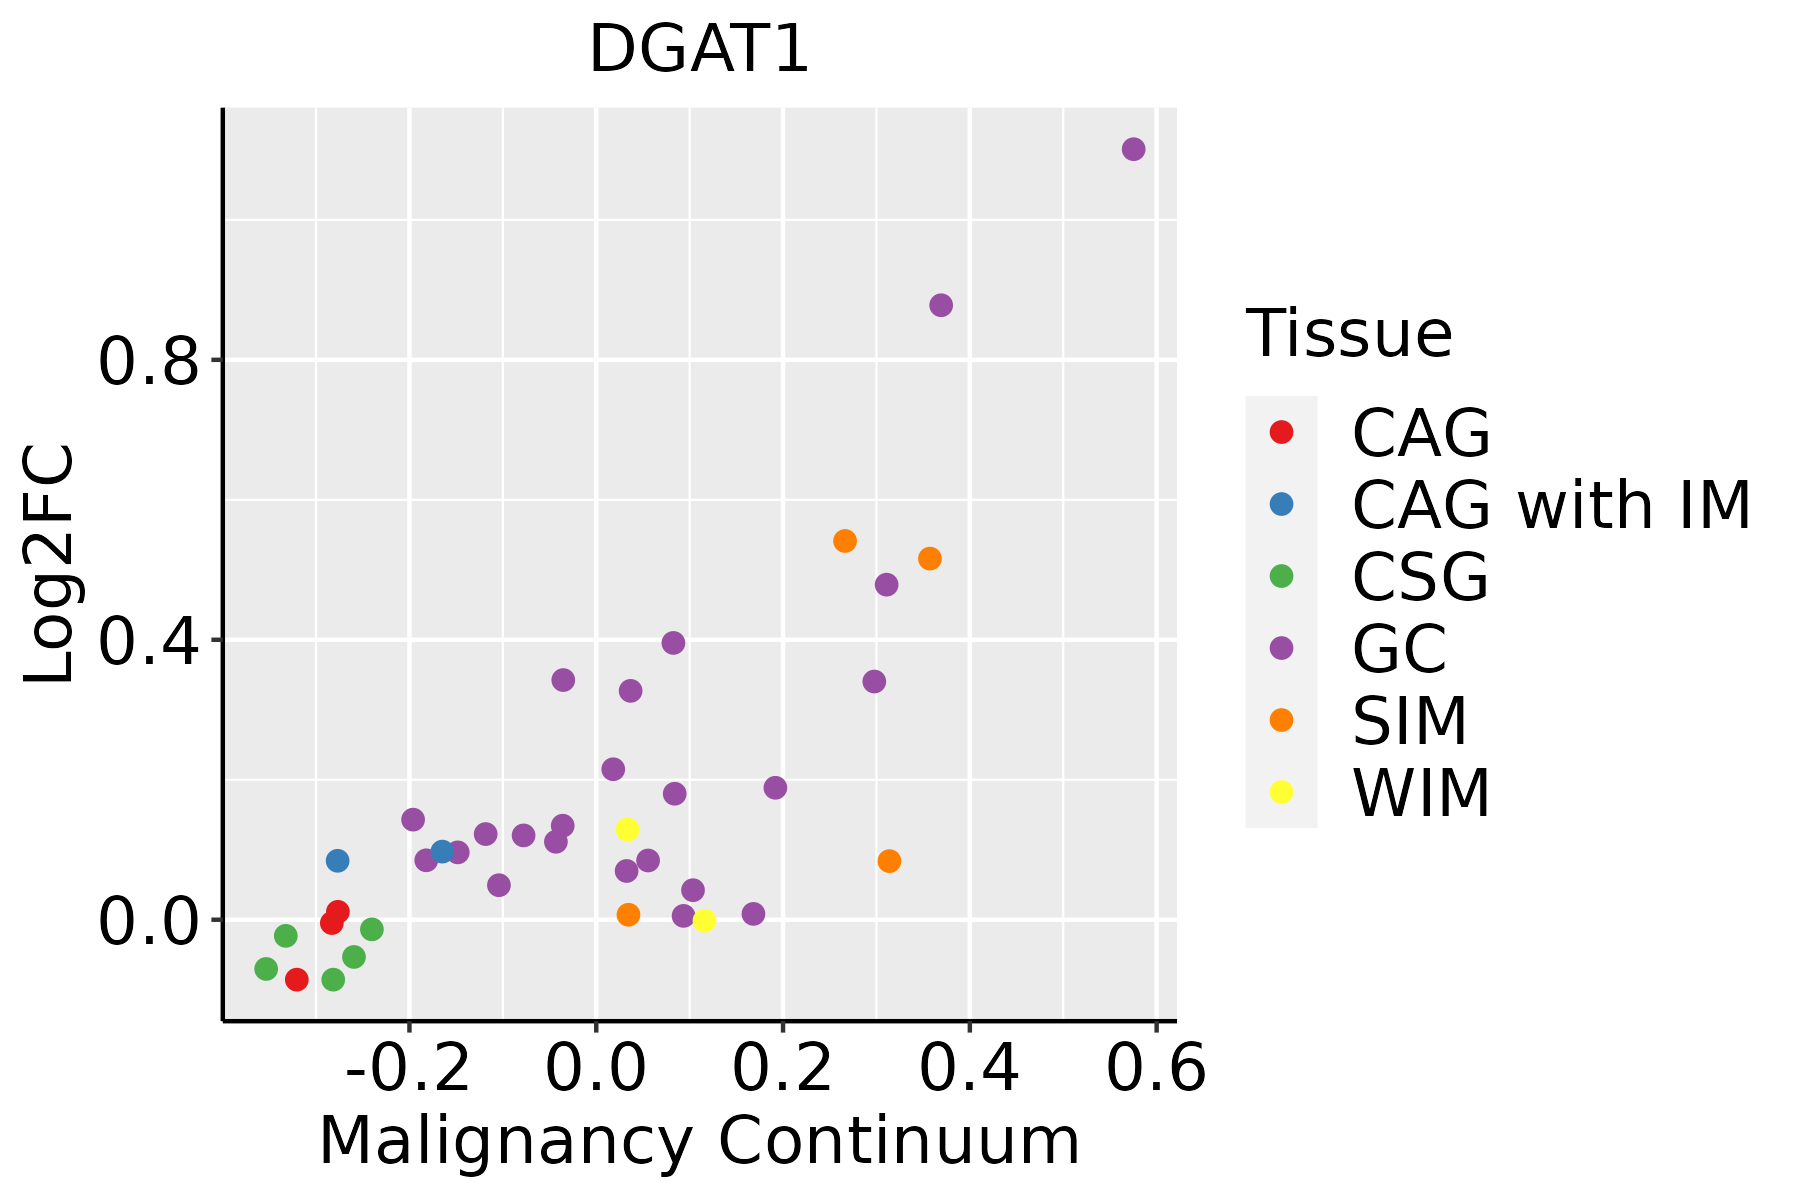 | CAG: Chronic atrophic gastritis |
| CAG with IM: Chronic atrophic gastritis with intestinal metaplasia | ||
| CSG: Chronic superficial gastritis | ||
| GC: Gastric cancer | ||
| SIM: Severe intestinal metaplasia | ||
| WIM: Wild intestinal metaplasia | ||
| Liver | 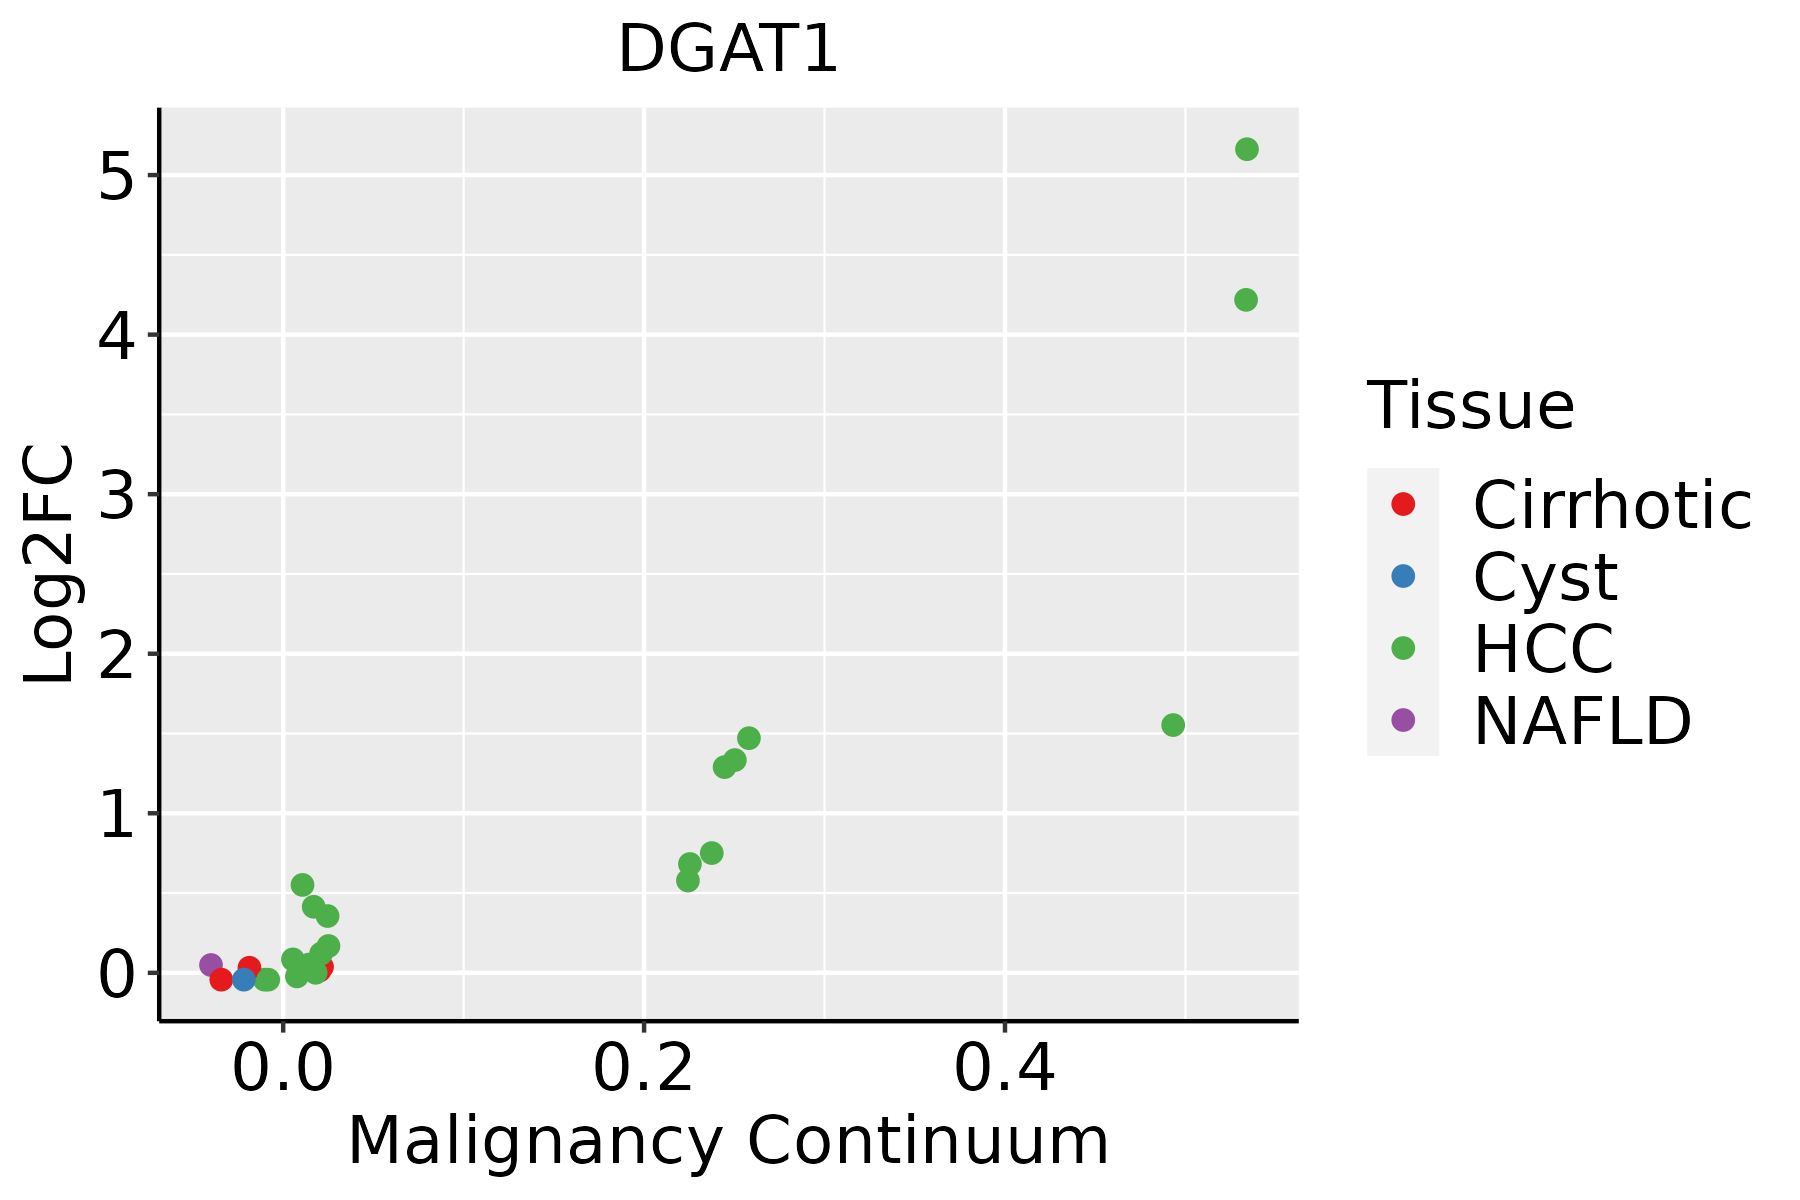 | HCC: Hepatocellular carcinoma |
| NAFLD: Non-alcoholic fatty liver disease | ||
| Oral Cavity |  | EOLP: Erosive Oral lichen planus |
| LP: leukoplakia | ||
| NEOLP: Non-erosive oral lichen planus | ||
| OSCC: Oral squamous cell carcinoma | ||
| Thyroid | 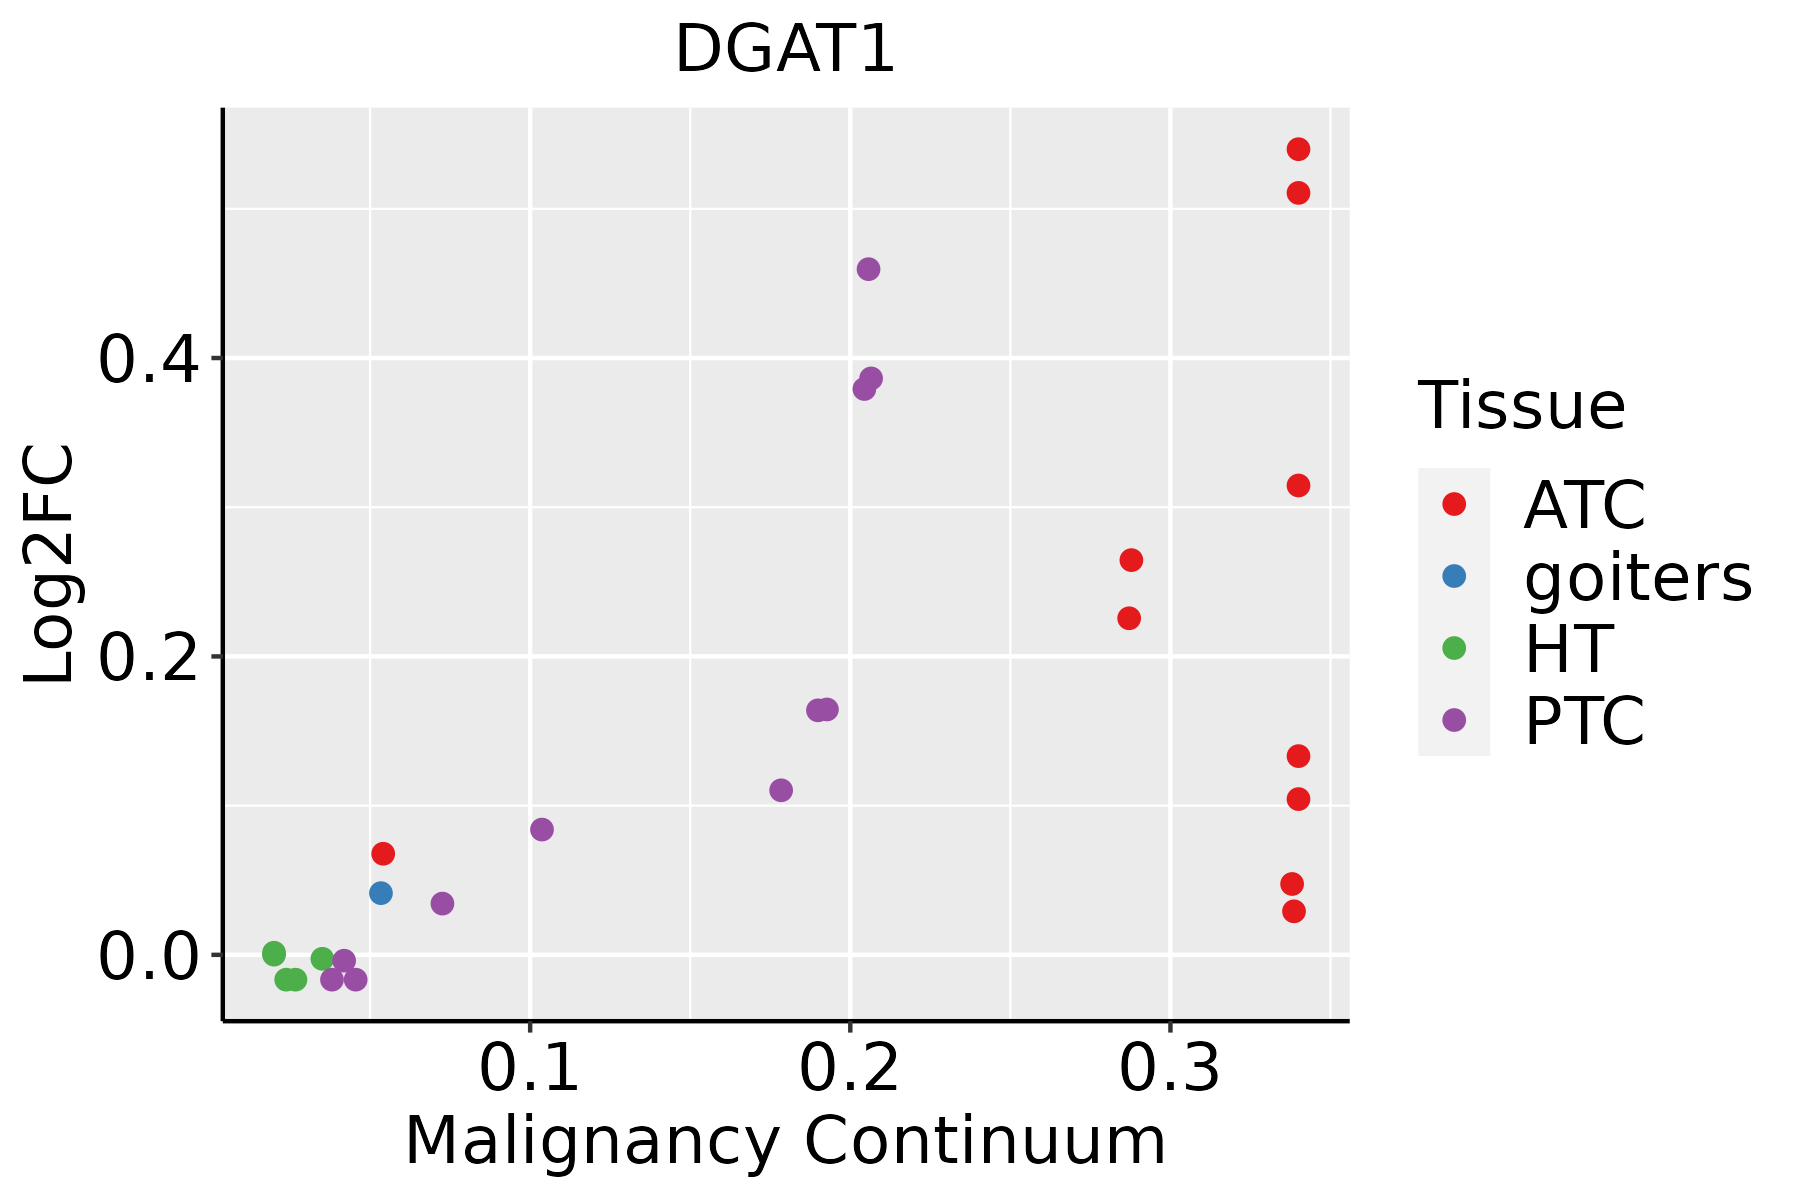 | ATC: Anaplastic thyroid cancer |
| HT: Hashimoto's thyroiditis | ||
| PTC: Papillary thyroid cancer |
| ∗log2FC in expression of this searched gene in stem-like cells from each diseased tissue sample relative to stem-like cells in normal samples in each tissue plotted against the malignancy continuum. Samples are colored based on if they are from different disease stage. |
Top |
Malignant transformation related pathway analysis |
| Find out the enriched GO biological processes and KEGG pathways involved in transition from healthy to precancer to cancer |
| Tissue | Disease Stage | Enriched GO biological Processes |
| Colorectum | AD |  |
| Colorectum | SER |  |
| Colorectum | MSS |  |
| Colorectum | MSI-H |  |
| Colorectum | FAP |  |
| ∗Top 15 enriched GO BP terms are showed in the bar plot of each disease state in each tissue. Each row represents a significant GO biological process which is colored according to the -log10(p.adjust). |
| Page: 1 2 3 4 5 6 7 8 9 |
| GO ID | Tissue | Disease Stage | Description | Gene Ratio | Bg Ratio | pvalue | p.adjust | Count |
| GO:0009150 | Colorectum | AD | purine ribonucleotide metabolic process | 142/3918 | 368/18723 | 4.29e-15 | 1.17e-12 | 142 |
| GO:0006163 | Colorectum | AD | purine nucleotide metabolic process | 149/3918 | 396/18723 | 1.08e-14 | 2.80e-12 | 149 |
| GO:0072521 | Colorectum | AD | purine-containing compound metabolic process | 153/3918 | 416/18723 | 4.34e-14 | 1.01e-11 | 153 |
| GO:0009259 | Colorectum | AD | ribonucleotide metabolic process | 144/3918 | 385/18723 | 5.25e-14 | 1.13e-11 | 144 |
| GO:0019693 | Colorectum | AD | ribose phosphate metabolic process | 145/3918 | 396/18723 | 3.01e-13 | 5.71e-11 | 145 |
| GO:0009117 | Colorectum | AD | nucleotide metabolic process | 168/3918 | 489/18723 | 2.20e-12 | 3.36e-10 | 168 |
| GO:0006753 | Colorectum | AD | nucleoside phosphate metabolic process | 169/3918 | 497/18723 | 4.99e-12 | 6.98e-10 | 169 |
| GO:0006066 | Colorectum | AD | alcohol metabolic process | 106/3918 | 353/18723 | 3.02e-05 | 5.57e-04 | 106 |
| GO:0006790 | Colorectum | AD | sulfur compound metabolic process | 101/3918 | 339/18723 | 6.46e-05 | 1.07e-03 | 101 |
| GO:0033865 | Colorectum | AD | nucleoside bisphosphate metabolic process | 42/3918 | 128/18723 | 1.12e-03 | 1.02e-02 | 42 |
| GO:0033875 | Colorectum | AD | ribonucleoside bisphosphate metabolic process | 42/3918 | 128/18723 | 1.12e-03 | 1.02e-02 | 42 |
| GO:0034032 | Colorectum | AD | purine nucleoside bisphosphate metabolic process | 42/3918 | 128/18723 | 1.12e-03 | 1.02e-02 | 42 |
| GO:0034308 | Colorectum | AD | primary alcohol metabolic process | 35/3918 | 102/18723 | 1.16e-03 | 1.05e-02 | 35 |
| GO:0010876 | Colorectum | AD | lipid localization | 120/3918 | 448/18723 | 1.59e-03 | 1.33e-02 | 120 |
| GO:0045017 | Colorectum | AD | glycerolipid biosynthetic process | 69/3918 | 252/18723 | 8.33e-03 | 4.88e-02 | 69 |
| GO:00061631 | Colorectum | SER | purine nucleotide metabolic process | 109/2897 | 396/18723 | 4.26e-10 | 5.44e-08 | 109 |
| GO:00091501 | Colorectum | SER | purine ribonucleotide metabolic process | 103/2897 | 368/18723 | 4.69e-10 | 5.68e-08 | 103 |
| GO:00725211 | Colorectum | SER | purine-containing compound metabolic process | 113/2897 | 416/18723 | 4.80e-10 | 5.68e-08 | 113 |
| GO:00092591 | Colorectum | SER | ribonucleotide metabolic process | 104/2897 | 385/18723 | 3.27e-09 | 3.04e-07 | 104 |
| GO:00196931 | Colorectum | SER | ribose phosphate metabolic process | 105/2897 | 396/18723 | 8.15e-09 | 7.14e-07 | 105 |
| Page: 1 2 3 4 5 6 7 8 9 10 |
| Pathway ID | Tissue | Disease Stage | Description | Gene Ratio | Bg Ratio | pvalue | p.adjust | qvalue | Count |
| hsa00561 | Colorectum | AD | Glycerolipid metabolism | 24/2092 | 63/8465 | 1.25e-02 | 4.54e-02 | 2.90e-02 | 24 |
| hsa005611 | Colorectum | AD | Glycerolipid metabolism | 24/2092 | 63/8465 | 1.25e-02 | 4.54e-02 | 2.90e-02 | 24 |
| hsa005612 | Colorectum | MSS | Glycerolipid metabolism | 23/1875 | 63/8465 | 6.55e-03 | 2.64e-02 | 1.62e-02 | 23 |
| hsa005613 | Colorectum | MSS | Glycerolipid metabolism | 23/1875 | 63/8465 | 6.55e-03 | 2.64e-02 | 1.62e-02 | 23 |
| hsa005615 | Liver | HCC | Glycerolipid metabolism | 41/4020 | 63/8465 | 3.59e-03 | 1.12e-02 | 6.22e-03 | 41 |
| hsa0056112 | Liver | HCC | Glycerolipid metabolism | 41/4020 | 63/8465 | 3.59e-03 | 1.12e-02 | 6.22e-03 | 41 |
| hsa04975 | Stomach | GC | Fat digestion and absorption | 14/708 | 43/8465 | 5.71e-06 | 8.30e-05 | 5.84e-05 | 14 |
| hsa005614 | Stomach | GC | Glycerolipid metabolism | 12/708 | 63/8465 | 5.36e-03 | 3.01e-02 | 2.12e-02 | 12 |
| hsa049751 | Stomach | GC | Fat digestion and absorption | 14/708 | 43/8465 | 5.71e-06 | 8.30e-05 | 5.84e-05 | 14 |
| hsa0056111 | Stomach | GC | Glycerolipid metabolism | 12/708 | 63/8465 | 5.36e-03 | 3.01e-02 | 2.12e-02 | 12 |
| hsa049752 | Stomach | SIM | Fat digestion and absorption | 12/465 | 43/8465 | 2.11e-06 | 3.05e-05 | 2.45e-05 | 12 |
| hsa0056121 | Stomach | SIM | Glycerolipid metabolism | 9/465 | 63/8465 | 7.07e-03 | 4.30e-02 | 3.45e-02 | 9 |
| hsa049753 | Stomach | SIM | Fat digestion and absorption | 12/465 | 43/8465 | 2.11e-06 | 3.05e-05 | 2.45e-05 | 12 |
| hsa0056131 | Stomach | SIM | Glycerolipid metabolism | 9/465 | 63/8465 | 7.07e-03 | 4.30e-02 | 3.45e-02 | 9 |
| Page: 1 |
Top |
Cell-cell communication analysis |
| Identification of potential cell-cell interactions between two cell types and their ligand-receptor pairs for different disease states |
| Ligand | Receptor | LRpair | Pathway | Tissue | Disease Stage |
| Page: 1 |
Top |
Single-cell gene regulatory network inference analysis |
| Find out the significant the regulons (TFs) and the target genes of each regulon across cell types for different disease states |
| TF | Cell Type | Tissue | Disease Stage | Target Gene | RSS | Regulon Activity |
| ∗The dot plots of a searched regulon are shown for all cell subpopulations in each disease state of each tissue based on the regulon specific score inferred using pySCENIC and by calculating the average expression. |
| Page: 1 |
Top |
Somatic mutation of malignant transformation related genes |
| Annotation of somatic variants for genes involved in malignant transformation |
| Hugo Symbol | Variant Class | Variant Classification | dbSNP RS | HGVSc | HGVSp | HGVSp Short | SWISSPROT | BIOTYPE | SIFT | PolyPhen | Tumor Sample Barcode | Tissue | Histology | Sex | Age | Stage | Therapy Types | Drugs | Outcome |
| DGAT1 | SNV | Missense_Mutation | rs573410614 | c.1232N>T | p.Ser411Leu | p.S411L | O75907 | protein_coding | deleterious(0) | probably_damaging(1) | TCGA-AC-A23H-01 | Breast | breast invasive carcinoma | Female | >=65 | I/II | Unknown | Unknown | PD |
| DGAT1 | insertion | Nonsense_Mutation | novel | c.1111_1112insGTACCTGGTGAGCGTCCCTCTGCGAATGTTCCG | p.Thr371delinsSerThrTrpTerAlaSerLeuCysGluCysSerAla | p.T371delinsSTW*ASLCECSA | O75907 | protein_coding | TCGA-A8-A09E-01 | Breast | breast invasive carcinoma | Female | >=65 | III/IV | Hormone Therapy | anastrozole | SD | ||
| DGAT1 | deletion | In_Frame_Del | c.1000_1005delNNNNNN | p.Trp334_Leu335del | p.W334_L335del | O75907 | protein_coding | TCGA-B6-A0IJ-01 | Breast | breast invasive carcinoma | Female | <65 | I/II | Unknown | Unknown | SD | |||
| DGAT1 | deletion | Frame_Shift_Del | novel | c.1420delN | p.His474ThrfsTer240 | p.H474Tfs*240 | O75907 | protein_coding | TCGA-D8-A27V-01 | Breast | breast invasive carcinoma | Female | <65 | I/II | Hormone Therapy | tamoxiphen | SD | ||
| DGAT1 | SNV | Missense_Mutation | rs573410614 | c.1232N>T | p.Ser411Leu | p.S411L | O75907 | protein_coding | deleterious(0) | probably_damaging(1) | TCGA-EK-A3GK-01 | Cervix | cervical & endocervical cancer | Female | <65 | I/II | Unknown | Unknown | SD |
| DGAT1 | SNV | Missense_Mutation | c.593N>C | p.Leu198Pro | p.L198P | O75907 | protein_coding | deleterious(0) | probably_damaging(0.997) | TCGA-AA-3663-01 | Colorectum | colon adenocarcinoma | Male | <65 | I/II | Unknown | Unknown | SD | |
| DGAT1 | SNV | Missense_Mutation | novel | c.965N>A | p.Arg322His | p.R322H | O75907 | protein_coding | deleterious(0) | probably_damaging(0.996) | TCGA-AA-3947-01 | Colorectum | colon adenocarcinoma | Female | <65 | I/II | Unknown | Unknown | SD |
| DGAT1 | SNV | Missense_Mutation | rs782726552 | c.1427A>G | p.Tyr476Cys | p.Y476C | O75907 | protein_coding | deleterious(0) | probably_damaging(0.987) | TCGA-AA-A010-01 | Colorectum | colon adenocarcinoma | Female | <65 | I/II | Chemotherapy | folinic | CR |
| DGAT1 | SNV | Missense_Mutation | c.803N>A | p.Pro268His | p.P268H | O75907 | protein_coding | deleterious(0) | probably_damaging(0.993) | TCGA-AD-6964-01 | Colorectum | colon adenocarcinoma | Male | <65 | III/IV | Chemotherapy | folfox | PD | |
| DGAT1 | SNV | Missense_Mutation | c.589N>A | p.Ala197Thr | p.A197T | O75907 | protein_coding | tolerated(0.16) | possibly_damaging(0.883) | TCGA-AZ-6598-01 | Colorectum | colon adenocarcinoma | Female | >=65 | I/II | Unknown | Unknown | SD |
| Page: 1 2 3 4 5 |
Top |
Related drugs of malignant transformation related genes |
| Identification of chemicals and drugs interact with genes involved in malignant transfromation |
| (DGIdb 4.0) |
| Entrez ID | Symbol | Category | Interaction Types | Drug Claim Name | Drug Name | PMIDs |
| 8694 | DGAT1 | ENZYME, DRUGGABLE GENOME | Pyrazolo[1,5-a]pyrimidine derivative 29 | |||
| 8694 | DGAT1 | ENZYME, DRUGGABLE GENOME | inhibitor | 223366160 | PF-04620110 | |
| 8694 | DGAT1 | ENZYME, DRUGGABLE GENOME | PMID25470667-Compound-Figure4-1A | |||
| 8694 | DGAT1 | ENZYME, DRUGGABLE GENOME | Pyridine-amide derivative 1 | |||
| 8694 | DGAT1 | ENZYME, DRUGGABLE GENOME | Pyrazolo[1,5-a]pyrimidine derivative 28 | |||
| 8694 | DGAT1 | ENZYME, DRUGGABLE GENOME | Lactam derivative 2 | |||
| 8694 | DGAT1 | ENZYME, DRUGGABLE GENOME | Hesperetin | HESPERETIN | ||
| 8694 | DGAT1 | ENZYME, DRUGGABLE GENOME | LCQ908 | |||
| 8694 | DGAT1 | ENZYME, DRUGGABLE GENOME | Lactam derivative 1 | |||
| 8694 | DGAT1 | ENZYME, DRUGGABLE GENOME | amidepsines |
| Page: 1 2 3 4 |

Copyright 2023-Present -The University of Texas Health Science Center at Houston |