
|
|||||
|
 | |
| |
| |
| |
| |
| |
|
Gene: DFFA |
Gene summary for DFFA |
| Gene information | Species | Human | Gene symbol | DFFA | Gene ID | 1676 |
| Gene name | DNA fragmentation factor subunit alpha | |
| Gene Alias | DFF-45 | |
| Cytomap | 1p36.22 | |
| Gene Type | protein-coding | GO ID | GO:0000737 | UniProtAcc | O00273 |
Top |
Malignant transformation analysis |
| Identification of the aberrant gene expression in precancerous and cancerous lesions by comparing the gene expression of stem-like cells in diseased tissues with normal stem cells |
| Entrez ID | Symbol | Replicates | Species | Organ | Tissue | Adj P-value | Log2FC | Malignancy |
| 1676 | DFFA | LZE4T | Human | Esophagus | ESCC | 1.37e-05 | 2.12e-01 | 0.0811 |
| 1676 | DFFA | LZE5T | Human | Esophagus | ESCC | 3.33e-02 | 4.17e-01 | 0.0514 |
| 1676 | DFFA | LZE8T | Human | Esophagus | ESCC | 1.92e-13 | 2.09e-01 | 0.067 |
| 1676 | DFFA | LZE24T | Human | Esophagus | ESCC | 4.02e-09 | 4.25e-01 | 0.0596 |
| 1676 | DFFA | P1T-E | Human | Esophagus | ESCC | 7.99e-06 | 4.02e-01 | 0.0875 |
| 1676 | DFFA | P2T-E | Human | Esophagus | ESCC | 6.42e-45 | 8.70e-01 | 0.1177 |
| 1676 | DFFA | P4T-E | Human | Esophagus | ESCC | 4.07e-19 | 6.61e-01 | 0.1323 |
| 1676 | DFFA | P5T-E | Human | Esophagus | ESCC | 2.79e-32 | 8.90e-01 | 0.1327 |
| 1676 | DFFA | P8T-E | Human | Esophagus | ESCC | 3.49e-09 | 2.59e-01 | 0.0889 |
| 1676 | DFFA | P9T-E | Human | Esophagus | ESCC | 2.12e-11 | 3.94e-01 | 0.1131 |
| 1676 | DFFA | P10T-E | Human | Esophagus | ESCC | 7.08e-23 | 5.28e-01 | 0.116 |
| 1676 | DFFA | P11T-E | Human | Esophagus | ESCC | 2.34e-03 | 3.22e-01 | 0.1426 |
| 1676 | DFFA | P12T-E | Human | Esophagus | ESCC | 2.34e-15 | 2.45e-01 | 0.1122 |
| 1676 | DFFA | P15T-E | Human | Esophagus | ESCC | 6.13e-21 | 4.74e-01 | 0.1149 |
| 1676 | DFFA | P16T-E | Human | Esophagus | ESCC | 1.15e-25 | 4.51e-01 | 0.1153 |
| 1676 | DFFA | P17T-E | Human | Esophagus | ESCC | 3.12e-04 | 4.05e-01 | 0.1278 |
| 1676 | DFFA | P19T-E | Human | Esophagus | ESCC | 4.08e-02 | 7.10e-01 | 0.1662 |
| 1676 | DFFA | P20T-E | Human | Esophagus | ESCC | 2.81e-22 | 4.99e-01 | 0.1124 |
| 1676 | DFFA | P21T-E | Human | Esophagus | ESCC | 5.32e-44 | 1.06e+00 | 0.1617 |
| 1676 | DFFA | P22T-E | Human | Esophagus | ESCC | 5.41e-25 | 3.62e-01 | 0.1236 |
| Page: 1 2 3 4 5 6 |
| Tissue | Expression Dynamics | Abbreviation |
| Esophagus | 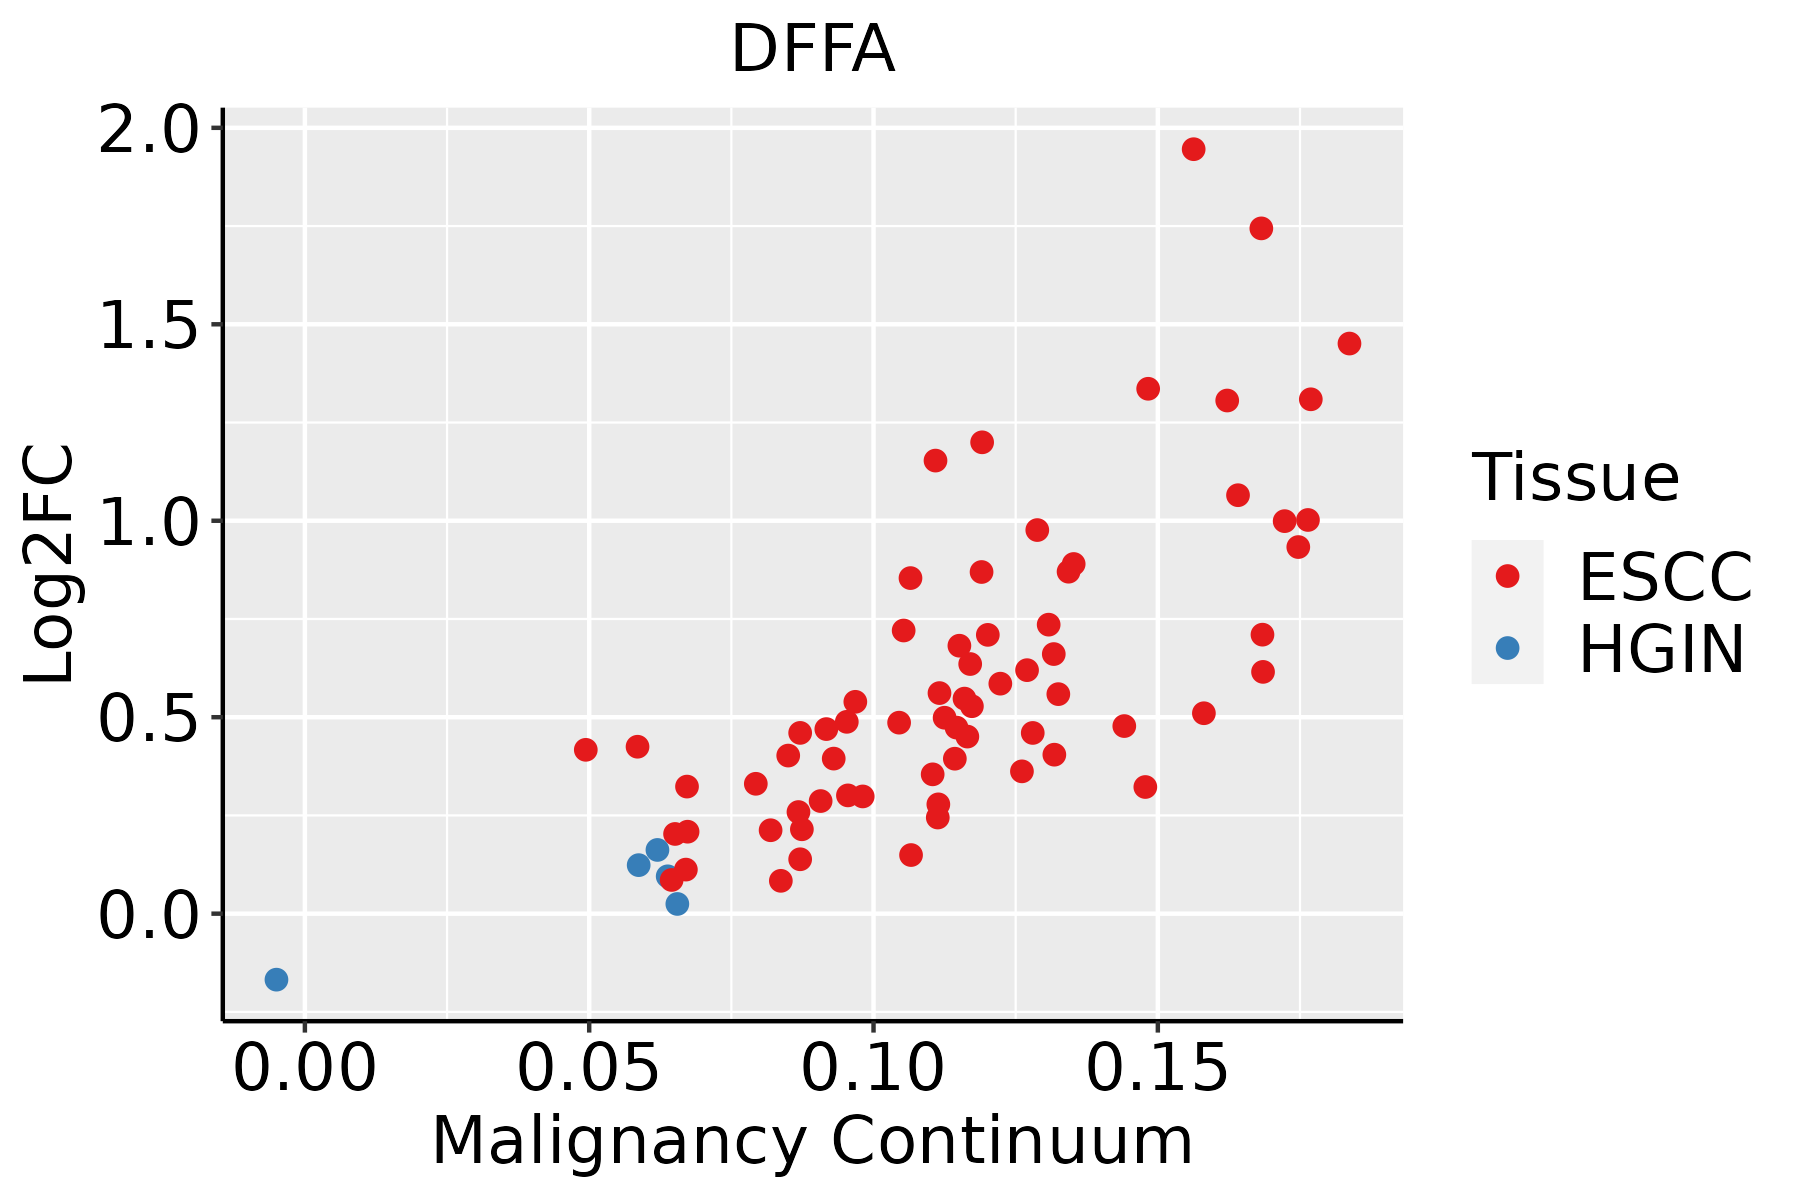 | ESCC: Esophageal squamous cell carcinoma |
| HGIN: High-grade intraepithelial neoplasias | ||
| LGIN: Low-grade intraepithelial neoplasias | ||
| Liver | 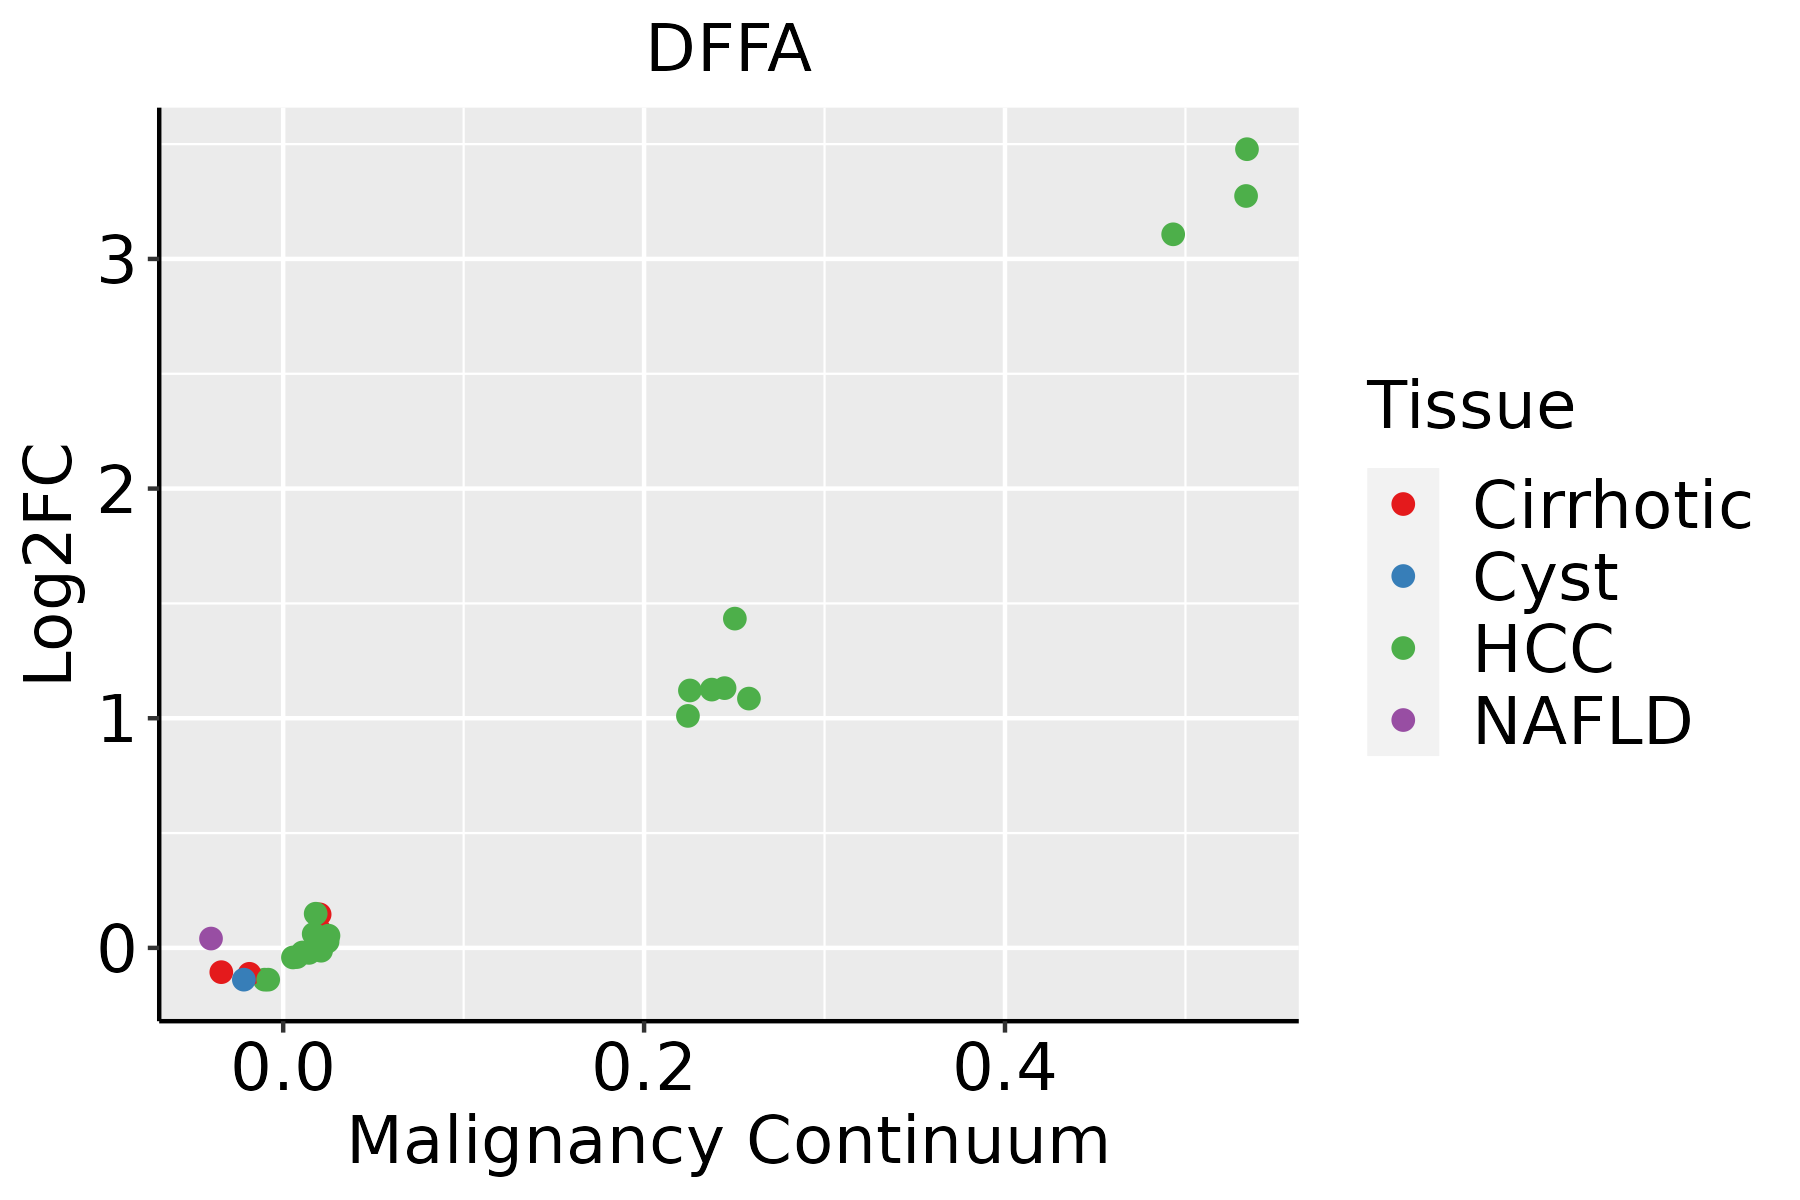 | HCC: Hepatocellular carcinoma |
| NAFLD: Non-alcoholic fatty liver disease | ||
| Oral Cavity | 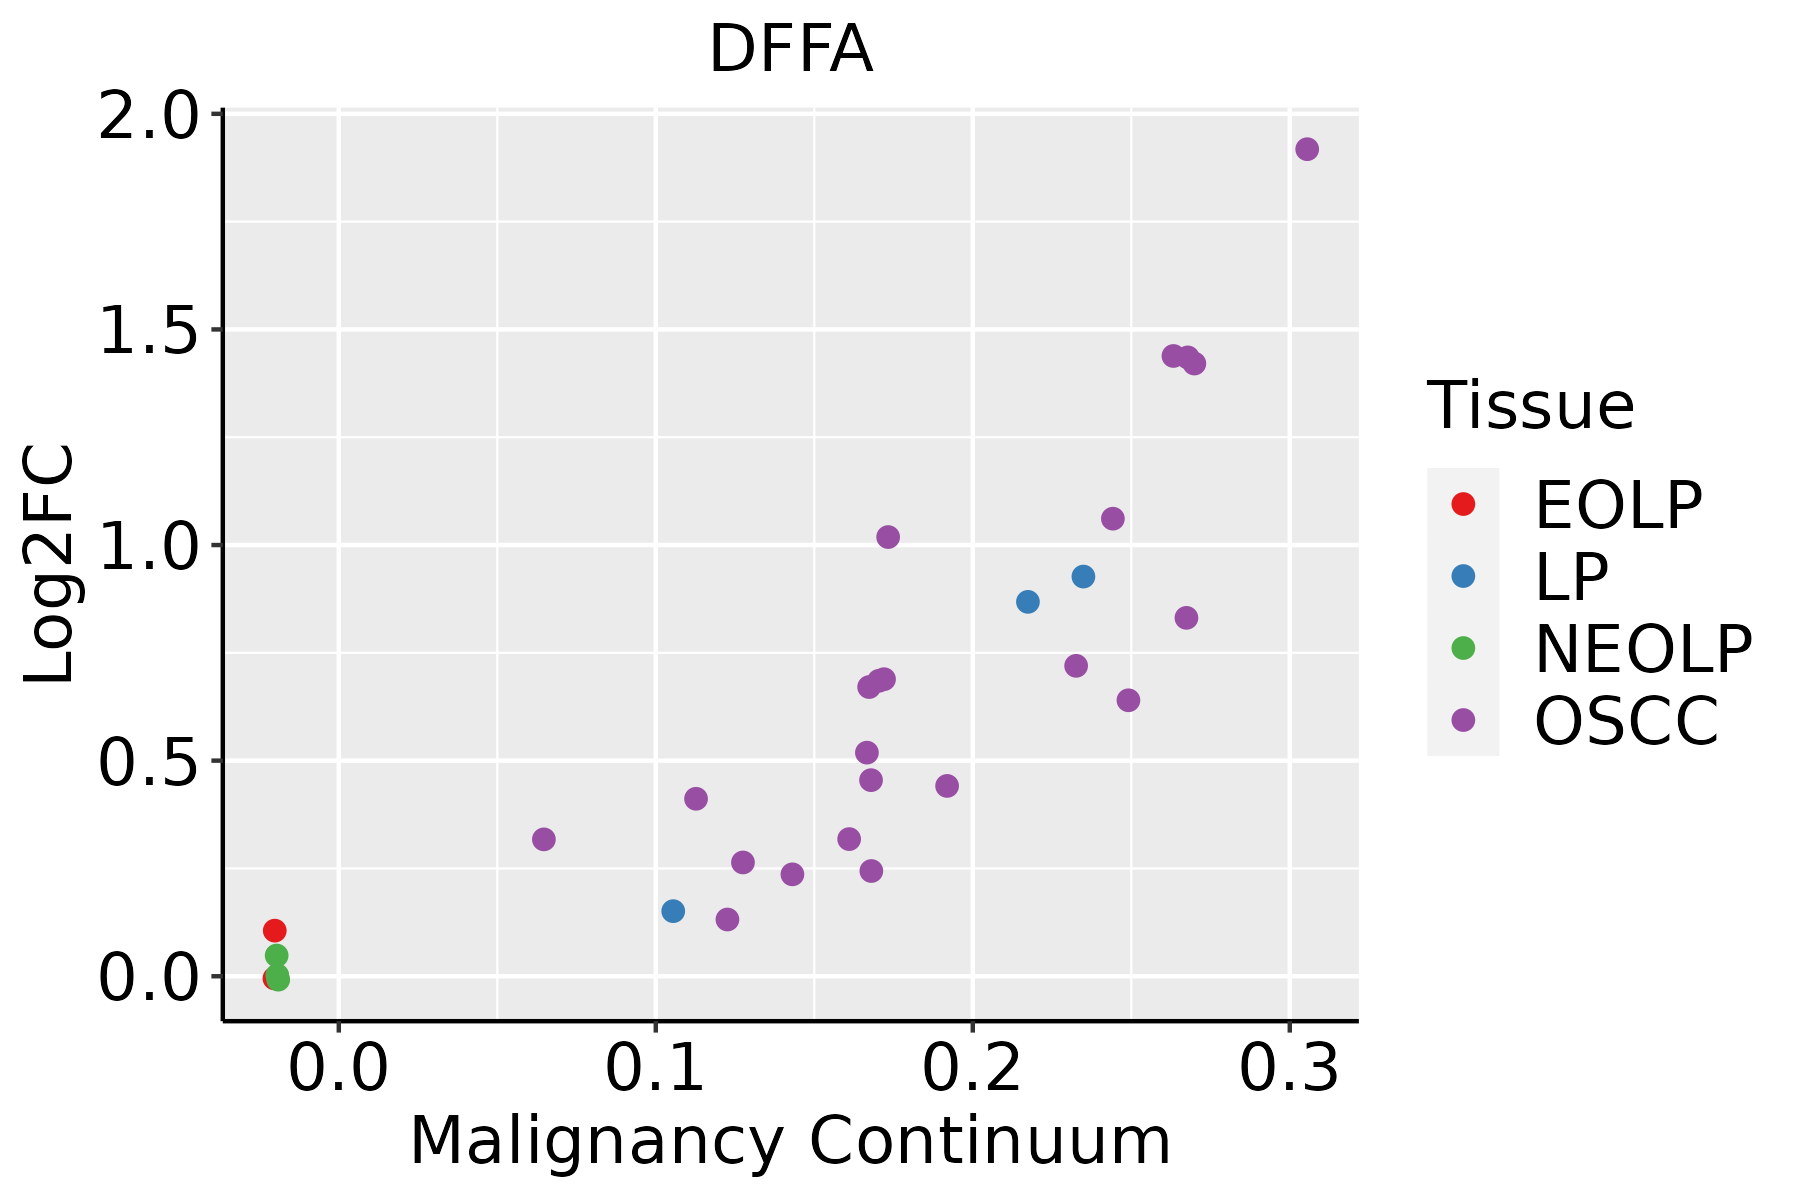 | EOLP: Erosive Oral lichen planus |
| LP: leukoplakia | ||
| NEOLP: Non-erosive oral lichen planus | ||
| OSCC: Oral squamous cell carcinoma | ||
| Skin | 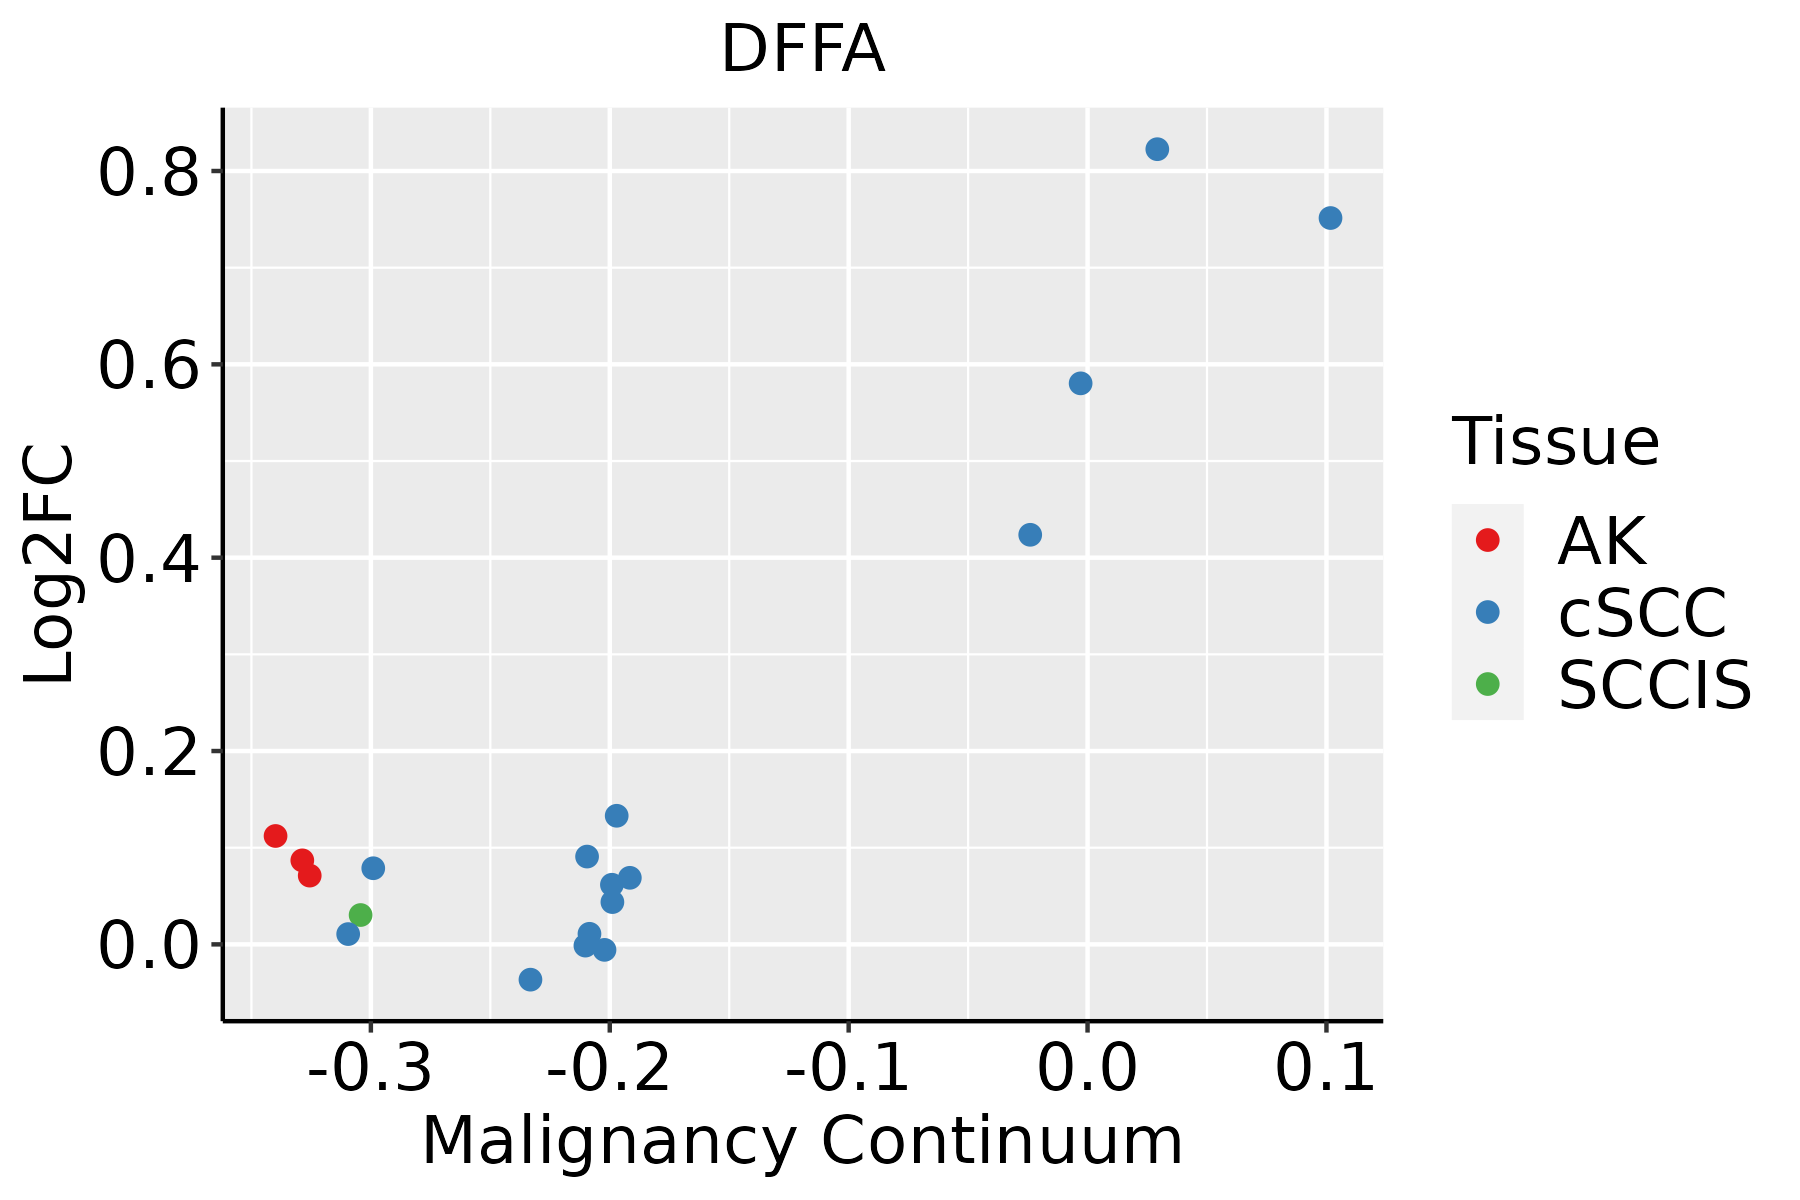 | AK: Actinic keratosis |
| cSCC: Cutaneous squamous cell carcinoma | ||
| SCCIS:squamous cell carcinoma in situ | ||
| Thyroid | 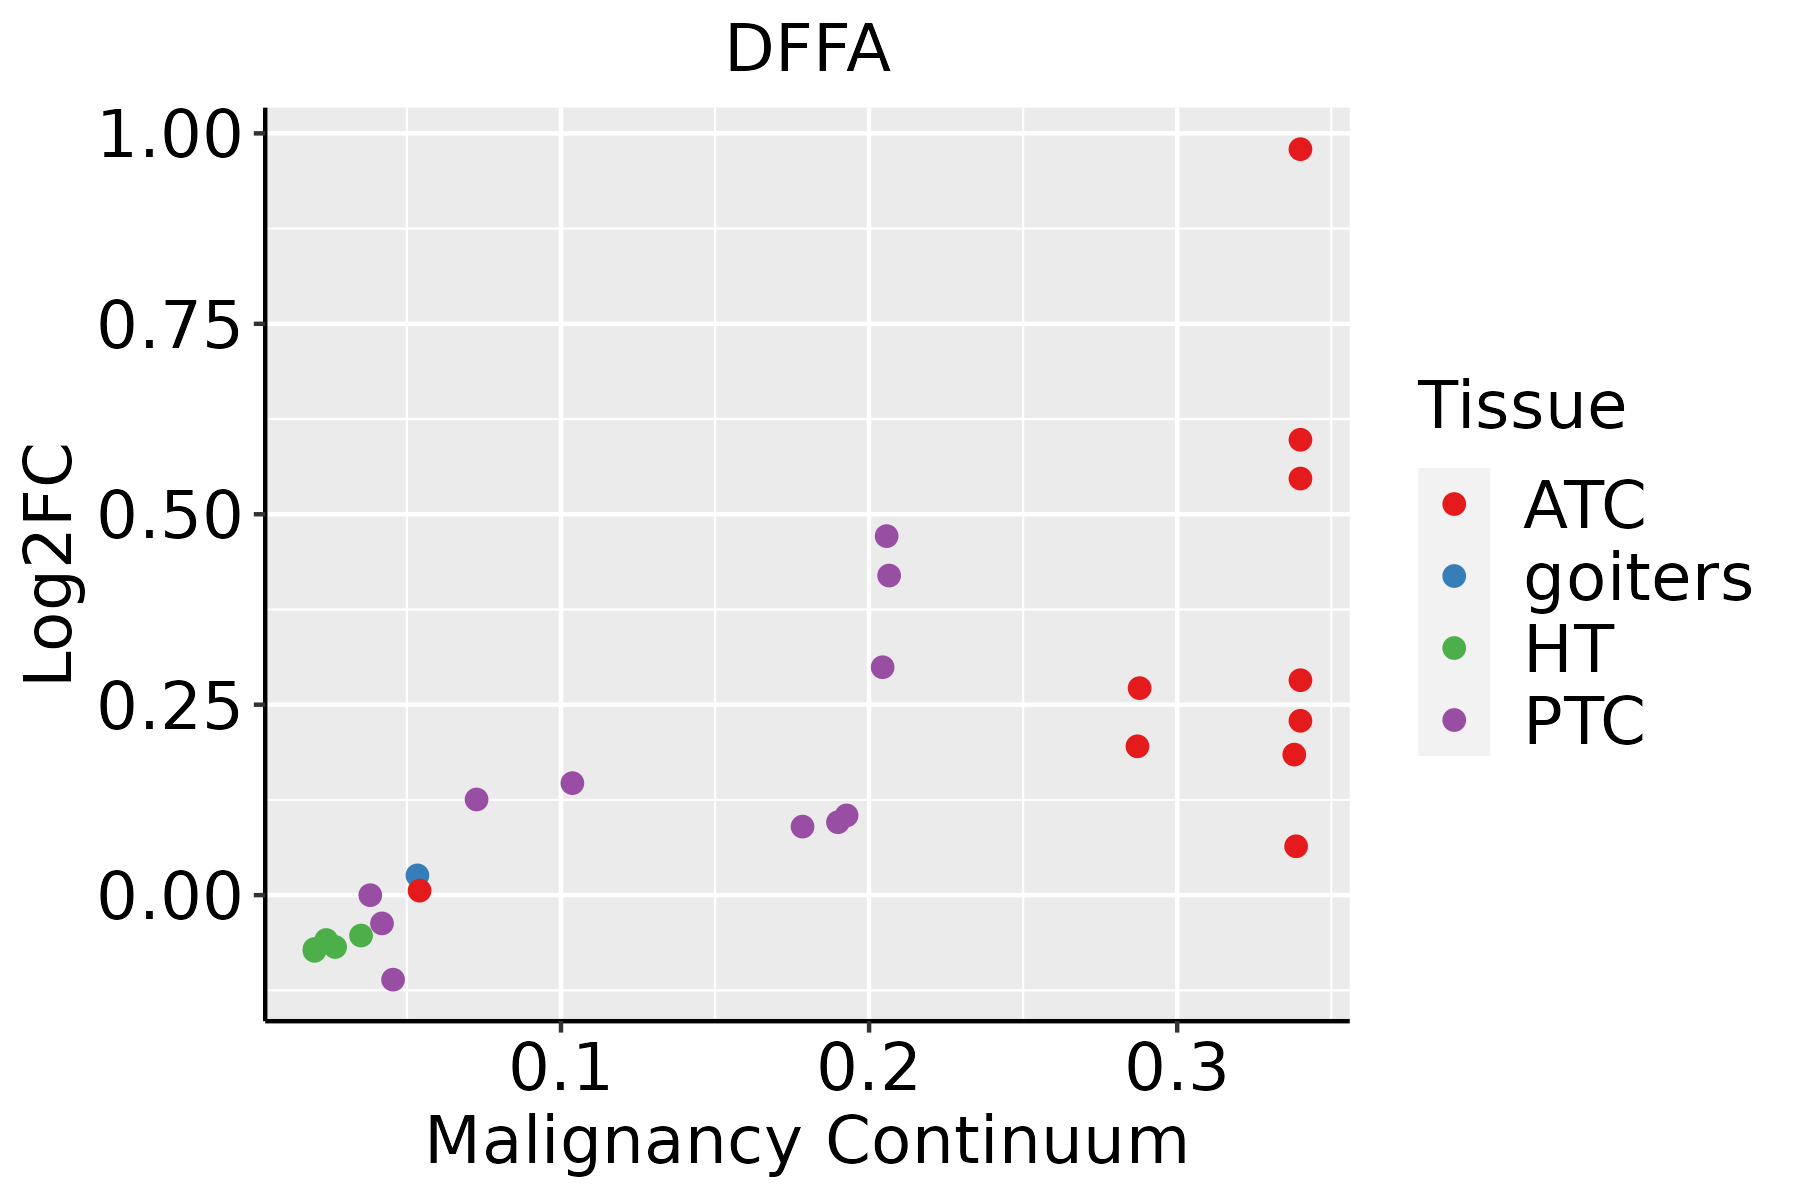 | ATC: Anaplastic thyroid cancer |
| HT: Hashimoto's thyroiditis | ||
| PTC: Papillary thyroid cancer |
| ∗log2FC in expression of this searched gene in stem-like cells from each diseased tissue sample relative to stem-like cells in normal samples in each tissue plotted against the malignancy continuum. Samples are colored based on if they are from different disease stage. |
Top |
Malignant transformation related pathway analysis |
| Find out the enriched GO biological processes and KEGG pathways involved in transition from healthy to precancer to cancer |
| Tissue | Disease Stage | Enriched GO biological Processes |
| Colorectum | AD |  |
| Colorectum | SER |  |
| Colorectum | MSS |  |
| Colorectum | MSI-H |  |
| Colorectum | FAP |  |
| ∗Top 15 enriched GO BP terms are showed in the bar plot of each disease state in each tissue. Each row represents a significant GO biological process which is colored according to the -log10(p.adjust). |
| Page: 1 2 3 4 5 6 7 8 9 |
| GO ID | Tissue | Disease Stage | Description | Gene Ratio | Bg Ratio | pvalue | p.adjust | Count |
| GO:0022411111 | Esophagus | ESCC | cellular component disassembly | 305/8552 | 443/18723 | 1.94e-23 | 4.57e-21 | 305 |
| GO:0006457110 | Esophagus | ESCC | protein folding | 163/8552 | 212/18723 | 1.13e-20 | 1.74e-18 | 163 |
| GO:0034655110 | Esophagus | ESCC | nucleobase-containing compound catabolic process | 272/8552 | 407/18723 | 2.92e-18 | 2.90e-16 | 272 |
| GO:004670018 | Esophagus | ESCC | heterocycle catabolic process | 286/8552 | 445/18723 | 1.12e-15 | 7.47e-14 | 286 |
| GO:004427019 | Esophagus | ESCC | cellular nitrogen compound catabolic process | 288/8552 | 451/18723 | 3.03e-15 | 1.79e-13 | 288 |
| GO:001943918 | Esophagus | ESCC | aromatic compound catabolic process | 295/8552 | 467/18723 | 1.09e-14 | 5.98e-13 | 295 |
| GO:190136118 | Esophagus | ESCC | organic cyclic compound catabolic process | 307/8552 | 495/18723 | 9.99e-14 | 4.80e-12 | 307 |
| GO:005105215 | Esophagus | ESCC | regulation of DNA metabolic process | 232/8552 | 359/18723 | 2.40e-13 | 1.13e-11 | 232 |
| GO:0061077110 | Esophagus | ESCC | chaperone-mediated protein folding | 56/8552 | 67/18723 | 1.52e-10 | 4.36e-09 | 56 |
| GO:0009895111 | Esophagus | ESCC | negative regulation of catabolic process | 201/8552 | 320/18723 | 3.88e-10 | 1.05e-08 | 201 |
| GO:0031330111 | Esophagus | ESCC | negative regulation of cellular catabolic process | 166/8552 | 262/18723 | 5.17e-09 | 1.08e-07 | 166 |
| GO:00903053 | Esophagus | ESCC | nucleic acid phosphodiester bond hydrolysis | 163/8552 | 261/18723 | 3.07e-08 | 5.73e-07 | 163 |
| GO:00320698 | Esophagus | ESCC | regulation of nuclease activity | 19/8552 | 22/18723 | 9.52e-05 | 6.78e-04 | 19 |
| GO:0051346110 | Esophagus | ESCC | negative regulation of hydrolase activity | 208/8552 | 379/18723 | 1.76e-04 | 1.14e-03 | 208 |
| GO:00718871 | Esophagus | ESCC | leukocyte apoptotic process | 65/8552 | 106/18723 | 8.39e-04 | 4.32e-03 | 65 |
| GO:00702271 | Esophagus | ESCC | lymphocyte apoptotic process | 46/8552 | 72/18723 | 1.39e-03 | 6.62e-03 | 46 |
| GO:00702421 | Esophagus | ESCC | thymocyte apoptotic process | 13/8552 | 16/18723 | 4.05e-03 | 1.62e-02 | 13 |
| GO:00320707 | Esophagus | ESCC | regulation of deoxyribonuclease activity | 9/8552 | 10/18723 | 5.09e-03 | 1.92e-02 | 9 |
| GO:0070231 | Esophagus | ESCC | T cell apoptotic process | 31/8552 | 50/18723 | 1.48e-02 | 4.79e-02 | 31 |
| GO:00064577 | Liver | Cirrhotic | protein folding | 114/4634 | 212/18723 | 9.23e-20 | 2.31e-17 | 114 |
| Page: 1 2 3 4 5 6 7 |
| Pathway ID | Tissue | Disease Stage | Description | Gene Ratio | Bg Ratio | pvalue | p.adjust | qvalue | Count |
| hsa0421027 | Esophagus | ESCC | Apoptosis | 102/4205 | 136/8465 | 1.05e-09 | 1.21e-08 | 6.21e-09 | 102 |
| hsa0421037 | Esophagus | ESCC | Apoptosis | 102/4205 | 136/8465 | 1.05e-09 | 1.21e-08 | 6.21e-09 | 102 |
| hsa042106 | Liver | Cirrhotic | Apoptosis | 58/2530 | 136/8465 | 9.84e-04 | 5.55e-03 | 3.42e-03 | 58 |
| hsa0421011 | Liver | Cirrhotic | Apoptosis | 58/2530 | 136/8465 | 9.84e-04 | 5.55e-03 | 3.42e-03 | 58 |
| hsa042102 | Liver | HCC | Apoptosis | 83/4020 | 136/8465 | 9.51e-04 | 3.58e-03 | 1.99e-03 | 83 |
| hsa042103 | Liver | HCC | Apoptosis | 83/4020 | 136/8465 | 9.51e-04 | 3.58e-03 | 1.99e-03 | 83 |
| hsa0421018 | Oral cavity | OSCC | Apoptosis | 101/3704 | 136/8465 | 3.34e-13 | 7.00e-12 | 3.56e-12 | 101 |
| hsa0421019 | Oral cavity | OSCC | Apoptosis | 101/3704 | 136/8465 | 3.34e-13 | 7.00e-12 | 3.56e-12 | 101 |
| hsa0421026 | Oral cavity | LP | Apoptosis | 65/2418 | 136/8465 | 1.33e-06 | 1.48e-05 | 9.53e-06 | 65 |
| hsa0421036 | Oral cavity | LP | Apoptosis | 65/2418 | 136/8465 | 1.33e-06 | 1.48e-05 | 9.53e-06 | 65 |
| Page: 1 |
Top |
Cell-cell communication analysis |
| Identification of potential cell-cell interactions between two cell types and their ligand-receptor pairs for different disease states |
| Ligand | Receptor | LRpair | Pathway | Tissue | Disease Stage |
| Page: 1 |
Top |
Single-cell gene regulatory network inference analysis |
| Find out the significant the regulons (TFs) and the target genes of each regulon across cell types for different disease states |
| TF | Cell Type | Tissue | Disease Stage | Target Gene | RSS | Regulon Activity |
| ∗The dot plots of a searched regulon are shown for all cell subpopulations in each disease state of each tissue based on the regulon specific score inferred using pySCENIC and by calculating the average expression. |
| Page: 1 |
Top |
Somatic mutation of malignant transformation related genes |
| Annotation of somatic variants for genes involved in malignant transformation |
| Hugo Symbol | Variant Class | Variant Classification | dbSNP RS | HGVSc | HGVSp | HGVSp Short | SWISSPROT | BIOTYPE | SIFT | PolyPhen | Tumor Sample Barcode | Tissue | Histology | Sex | Age | Stage | Therapy Types | Drugs | Outcome |
| DFFA | SNV | Missense_Mutation | c.756G>T | p.Glu252Asp | p.E252D | O00273 | protein_coding | deleterious(0.01) | probably_damaging(0.968) | TCGA-AC-A23H-01 | Breast | breast invasive carcinoma | Female | >=65 | I/II | Unknown | Unknown | PD | |
| DFFA | SNV | Missense_Mutation | c.425C>T | p.Ser142Leu | p.S142L | O00273 | protein_coding | deleterious(0.03) | possibly_damaging(0.666) | TCGA-AC-A23H-01 | Breast | breast invasive carcinoma | Female | >=65 | I/II | Unknown | Unknown | PD | |
| DFFA | SNV | Missense_Mutation | c.35N>T | p.Ser12Phe | p.S12F | O00273 | protein_coding | deleterious_low_confidence(0.01) | benign(0.031) | TCGA-BH-A0HF-01 | Breast | breast invasive carcinoma | Female | >=65 | I/II | Hormone Therapy | arimidex | SD | |
| DFFA | deletion | Frame_Shift_Del | novel | c.739delG | p.Glu247ArgfsTer7 | p.E247Rfs*7 | O00273 | protein_coding | TCGA-D8-A27V-01 | Breast | breast invasive carcinoma | Female | <65 | I/II | Hormone Therapy | tamoxiphen | SD | ||
| DFFA | SNV | Missense_Mutation | rs148645727 | c.556N>T | p.Arg186Cys | p.R186C | O00273 | protein_coding | deleterious(0) | probably_damaging(1) | TCGA-EA-A410-01 | Cervix | cervical & endocervical cancer | Female | <65 | I/II | Unknown | Unknown | SD |
| DFFA | SNV | Missense_Mutation | c.52N>A | p.Leu18Ile | p.L18I | O00273 | protein_coding | deleterious(0.01) | possibly_damaging(0.683) | TCGA-JX-A3PZ-01 | Cervix | cervical & endocervical cancer | Female | <65 | I/II | Unknown | Unknown | PD | |
| DFFA | SNV | Missense_Mutation | c.197N>T | p.Asp66Val | p.D66V | O00273 | protein_coding | deleterious(0) | probably_damaging(1) | TCGA-AA-3511-01 | Colorectum | colon adenocarcinoma | Male | <65 | I/II | Unknown | Unknown | PD | |
| DFFA | SNV | Missense_Mutation | c.435N>A | p.Asp145Glu | p.D145E | O00273 | protein_coding | tolerated(0.28) | benign(0.103) | TCGA-AA-3982-01 | Colorectum | colon adenocarcinoma | Male | >=65 | III/IV | Unknown | Unknown | SD | |
| DFFA | SNV | Missense_Mutation | c.650G>T | p.Gly217Val | p.G217V | O00273 | protein_coding | tolerated(0.33) | benign(0.021) | TCGA-AY-6196-01 | Colorectum | colon adenocarcinoma | Male | <65 | III/IV | Unknown | Unknown | SD | |
| DFFA | SNV | Missense_Mutation | c.619T>C | p.Ser207Pro | p.S207P | O00273 | protein_coding | tolerated(0.13) | benign(0.011) | TCGA-CK-4951-01 | Colorectum | colon adenocarcinoma | Female | >=65 | I/II | Unknown | Unknown | PD |
| Page: 1 2 3 |
Top |
Related drugs of malignant transformation related genes |
| Identification of chemicals and drugs interact with genes involved in malignant transfromation |
| (DGIdb 4.0) |
| Entrez ID | Symbol | Category | Interaction Types | Drug Claim Name | Drug Name | PMIDs |
| Page: 1 |

Copyright 2023-Present -The University of Texas Health Science Center at Houston |