
|
|||||
|
 | |
| |
| |
| |
| |
| |
|
Gene: DERL3 |
Gene summary for DERL3 |
| Gene information | Species | Human | Gene symbol | DERL3 | Gene ID | 91319 |
| Gene name | derlin 3 | |
| Gene Alias | C22orf14 | |
| Cytomap | 22q11.23 | |
| Gene Type | protein-coding | GO ID | GO:0006464 | UniProtAcc | Q96Q80 |
Top |
Malignant transformation analysis |
| Identification of the aberrant gene expression in precancerous and cancerous lesions by comparing the gene expression of stem-like cells in diseased tissues with normal stem cells |
| Entrez ID | Symbol | Replicates | Species | Organ | Tissue | Adj P-value | Log2FC | Malignancy |
| 91319 | DERL3 | C43 | Human | Oral cavity | OSCC | 3.94e-04 | 1.45e-01 | 0.1704 |
| 91319 | DERL3 | C46 | Human | Oral cavity | OSCC | 1.16e-11 | 2.66e-01 | 0.1673 |
| 91319 | DERL3 | C57 | Human | Oral cavity | OSCC | 9.32e-09 | 3.59e-01 | 0.1679 |
| 91319 | DERL3 | LN22 | Human | Oral cavity | OSCC | 5.72e-05 | 4.05e-01 | 0.1733 |
| 91319 | DERL3 | LN46 | Human | Oral cavity | OSCC | 1.68e-09 | 3.30e-01 | 0.1666 |
| 91319 | DERL3 | LP15 | Human | Oral cavity | LP | 4.58e-04 | 6.85e-01 | 0.2174 |
| 91319 | DERL3 | SYSMH5 | Human | Oral cavity | OSCC | 1.93e-05 | 4.63e-01 | 0.0647 |
| 91319 | DERL3 | SYSMH6 | Human | Oral cavity | OSCC | 4.12e-05 | 5.83e-01 | 0.1275 |
| 91319 | DERL3 | Dong_P1 | Human | Prostate | Tumor | 2.45e-07 | 1.38e-01 | 0.035 |
| 91319 | DERL3 | Dong_P5 | Human | Prostate | Tumor | 2.27e-04 | 4.85e-02 | 0.053 |
| 91319 | DERL3 | GSM5353218_PA_PB1B_Pool_1_2_S74_L003 | Human | Prostate | Tumor | 9.04e-14 | 1.12e+00 | 0.1479 |
| 91319 | DERL3 | GSM5353220_PA_PB1B_Pool_3_S51_L002 | Human | Prostate | Tumor | 1.29e-04 | 7.33e-01 | 0.1531 |
| 91319 | DERL3 | GSM5353221_PA_PB2A_Pool_1_3_S25_L001 | Human | Prostate | Tumor | 4.53e-02 | 2.81e-01 | 0.1633 |
| 91319 | DERL3 | GSM5353225_PA_PR5196-1_Pool_1_2_3_S53_L002 | Human | Prostate | Tumor | 3.27e-04 | 4.27e-01 | 0.1619 |
| Page: 1 |
| Tissue | Expression Dynamics | Abbreviation |
| Oral Cavity | 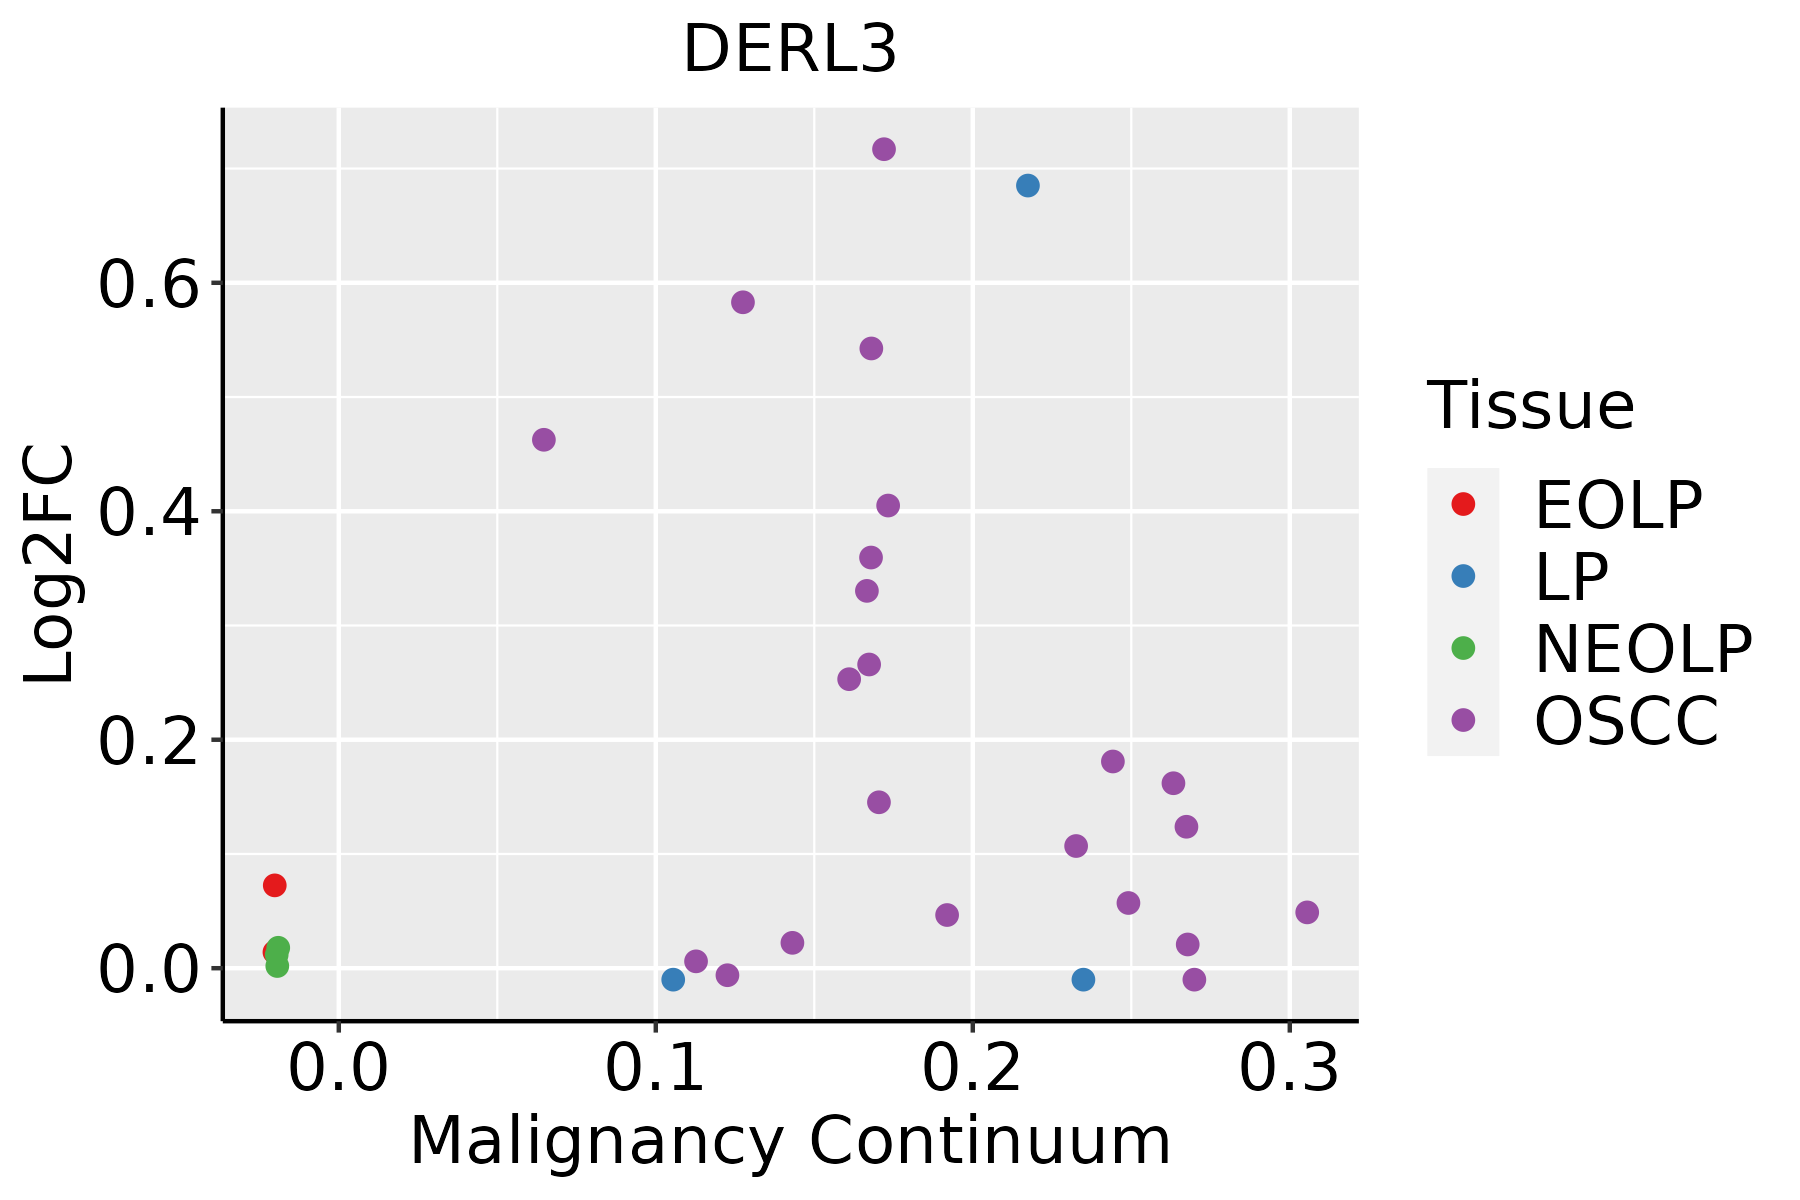 | EOLP: Erosive Oral lichen planus |
| LP: leukoplakia | ||
| NEOLP: Non-erosive oral lichen planus | ||
| OSCC: Oral squamous cell carcinoma | ||
| Prostate | 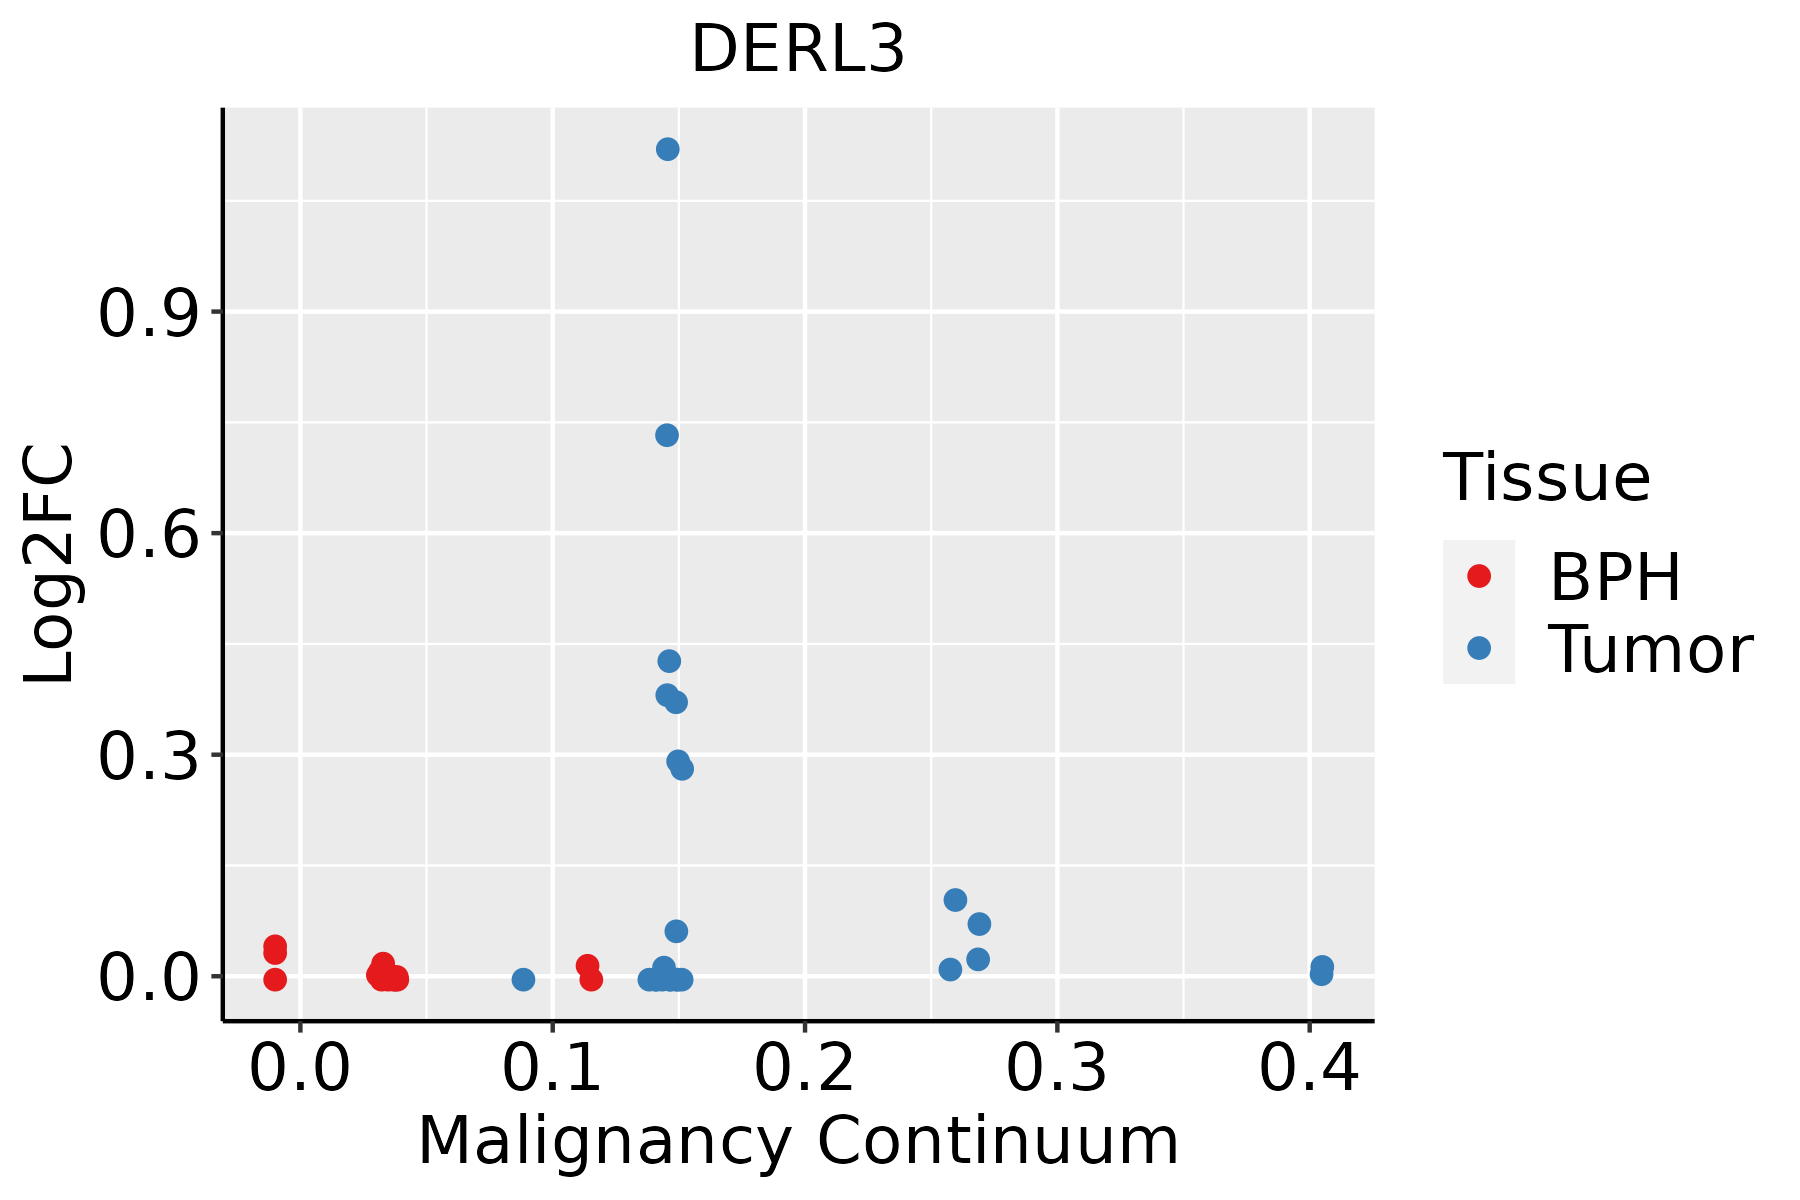 | BPH: Benign Prostatic Hyperplasia |
| ∗log2FC in expression of this searched gene in stem-like cells from each diseased tissue sample relative to stem-like cells in normal samples in each tissue plotted against the malignancy continuum. Samples are colored based on if they are from different disease stage. |
Top |
Malignant transformation related pathway analysis |
| Find out the enriched GO biological processes and KEGG pathways involved in transition from healthy to precancer to cancer |
| Tissue | Disease Stage | Enriched GO biological Processes |
| Colorectum | AD |  |
| Colorectum | SER |  |
| Colorectum | MSS |  |
| Colorectum | MSI-H |  |
| Colorectum | FAP |  |
| ∗Top 15 enriched GO BP terms are showed in the bar plot of each disease state in each tissue. Each row represents a significant GO biological process which is colored according to the -log10(p.adjust). |
| Page: 1 2 3 4 5 6 7 8 9 |
| GO ID | Tissue | Disease Stage | Description | Gene Ratio | Bg Ratio | pvalue | p.adjust | Count |
| GO:001049820 | Oral cavity | OSCC | proteasomal protein catabolic process | 336/7305 | 490/18723 | 5.45e-41 | 8.63e-38 | 336 |
| GO:004316120 | Oral cavity | OSCC | proteasome-mediated ubiquitin-dependent protein catabolic process | 285/7305 | 412/18723 | 5.68e-36 | 5.99e-33 | 285 |
| GO:003497620 | Oral cavity | OSCC | response to endoplasmic reticulum stress | 178/7305 | 256/18723 | 2.59e-23 | 6.06e-21 | 178 |
| GO:003238615 | Oral cavity | OSCC | regulation of intracellular transport | 218/7305 | 337/18723 | 6.91e-22 | 1.41e-19 | 218 |
| GO:003596620 | Oral cavity | OSCC | response to topologically incorrect protein | 117/7305 | 159/18723 | 6.93e-19 | 8.60e-17 | 117 |
| GO:003315718 | Oral cavity | OSCC | regulation of intracellular protein transport | 155/7305 | 229/18723 | 1.05e-18 | 1.28e-16 | 155 |
| GO:000698620 | Oral cavity | OSCC | response to unfolded protein | 103/7305 | 137/18723 | 6.47e-18 | 6.50e-16 | 103 |
| GO:003596720 | Oral cavity | OSCC | cellular response to topologically incorrect protein | 83/7305 | 116/18723 | 1.09e-12 | 4.84e-11 | 83 |
| GO:00304334 | Oral cavity | OSCC | ubiquitin-dependent ERAD pathway | 65/7305 | 85/18723 | 2.12e-12 | 8.99e-11 | 65 |
| GO:003462019 | Oral cavity | OSCC | cellular response to unfolded protein | 71/7305 | 96/18723 | 3.45e-12 | 1.35e-10 | 71 |
| GO:00365035 | Oral cavity | OSCC | ERAD pathway | 76/7305 | 107/18723 | 1.76e-11 | 6.11e-10 | 76 |
| GO:003096815 | Oral cavity | OSCC | endoplasmic reticulum unfolded protein response | 55/7305 | 74/18723 | 6.91e-10 | 1.75e-08 | 55 |
| GO:00325276 | Oral cavity | OSCC | protein exit from endoplasmic reticulum | 36/7305 | 48/18723 | 4.31e-07 | 6.36e-06 | 36 |
| GO:00064875 | Oral cavity | OSCC | protein N-linked glycosylation | 44/7305 | 65/18723 | 2.63e-06 | 3.26e-05 | 44 |
| GO:00181968 | Oral cavity | OSCC | peptidyl-asparagine modification | 20/7305 | 24/18723 | 1.10e-05 | 1.14e-04 | 20 |
| GO:00309705 | Oral cavity | OSCC | retrograde protein transport, ER to cytosol | 23/7305 | 29/18723 | 1.13e-05 | 1.16e-04 | 23 |
| GO:19035135 | Oral cavity | OSCC | endoplasmic reticulum to cytosol transport | 23/7305 | 29/18723 | 1.13e-05 | 1.16e-04 | 23 |
| GO:00182798 | Oral cavity | OSCC | protein N-linked glycosylation via asparagine | 19/7305 | 23/18723 | 2.37e-05 | 2.23e-04 | 19 |
| GO:19049504 | Oral cavity | OSCC | negative regulation of establishment of protein localization | 72/7305 | 131/18723 | 1.51e-04 | 1.06e-03 | 72 |
| GO:00512243 | Oral cavity | OSCC | negative regulation of protein transport | 70/7305 | 127/18723 | 1.65e-04 | 1.14e-03 | 70 |
| Page: 1 2 3 4 5 |
| Pathway ID | Tissue | Disease Stage | Description | Gene Ratio | Bg Ratio | pvalue | p.adjust | qvalue | Count |
| hsa0414130 | Oral cavity | OSCC | Protein processing in endoplasmic reticulum | 143/3704 | 174/8465 | 6.82e-26 | 2.28e-23 | 1.16e-23 | 143 |
| hsa04141113 | Oral cavity | OSCC | Protein processing in endoplasmic reticulum | 143/3704 | 174/8465 | 6.82e-26 | 2.28e-23 | 1.16e-23 | 143 |
| hsa04141210 | Oral cavity | LP | Protein processing in endoplasmic reticulum | 113/2418 | 174/8465 | 8.74e-24 | 5.82e-22 | 3.76e-22 | 113 |
| hsa0414138 | Oral cavity | LP | Protein processing in endoplasmic reticulum | 113/2418 | 174/8465 | 8.74e-24 | 5.82e-22 | 3.76e-22 | 113 |
| hsa0414129 | Prostate | Tumor | Protein processing in endoplasmic reticulum | 99/1791 | 174/8465 | 2.58e-25 | 1.71e-23 | 1.06e-23 | 99 |
| hsa0414137 | Prostate | Tumor | Protein processing in endoplasmic reticulum | 99/1791 | 174/8465 | 2.58e-25 | 1.71e-23 | 1.06e-23 | 99 |
| Page: 1 |
Top |
Cell-cell communication analysis |
| Identification of potential cell-cell interactions between two cell types and their ligand-receptor pairs for different disease states |
| Ligand | Receptor | LRpair | Pathway | Tissue | Disease Stage |
| Page: 1 |
Top |
Single-cell gene regulatory network inference analysis |
| Find out the significant the regulons (TFs) and the target genes of each regulon across cell types for different disease states |
| TF | Cell Type | Tissue | Disease Stage | Target Gene | RSS | Regulon Activity |
| ∗The dot plots of a searched regulon are shown for all cell subpopulations in each disease state of each tissue based on the regulon specific score inferred using pySCENIC and by calculating the average expression. |
| Page: 1 |
Top |
Somatic mutation of malignant transformation related genes |
| Annotation of somatic variants for genes involved in malignant transformation |
| Hugo Symbol | Variant Class | Variant Classification | dbSNP RS | HGVSc | HGVSp | HGVSp Short | SWISSPROT | BIOTYPE | SIFT | PolyPhen | Tumor Sample Barcode | Tissue | Histology | Sex | Age | Stage | Therapy Types | Drugs | Outcome |
| DERL3 | SNV | Missense_Mutation | c.231N>A | p.Phe77Leu | p.F77L | Q96Q80 | protein_coding | deleterious(0.01) | possibly_damaging(0.519) | TCGA-C5-A1BQ-01 | Cervix | cervical & endocervical cancer | Female | >=65 | III/IV | Chemotherapy | cisplatin | CR | |
| DERL3 | SNV | Missense_Mutation | novel | c.291C>A | p.Phe97Leu | p.F97L | Q96Q80 | protein_coding | deleterious(0) | probably_damaging(0.999) | TCGA-C5-A8XJ-01 | Cervix | cervical & endocervical cancer | Female | >=65 | I/II | Chemotherapy | cisplatin | SD |
| DERL3 | SNV | Missense_Mutation | rs776551730 | c.692N>T | p.Thr231Met | p.T231M | Q96Q80 | protein_coding | tolerated(0.11) | benign(0) | TCGA-AZ-4615-01 | Colorectum | colon adenocarcinoma | Male | >=65 | III/IV | Chemotherapy | xeloda | PD |
| DERL3 | SNV | Missense_Mutation | novel | c.82N>G | p.Thr28Ala | p.T28A | Q96Q80 | protein_coding | deleterious(0.02) | benign(0.272) | TCGA-A5-A2K5-01 | Endometrium | uterine corpus endometrioid carcinoma | Female | >=65 | I/II | Unknown | Unknown | SD |
| DERL3 | SNV | Missense_Mutation | rs769361729 | c.404N>A | p.Arg135His | p.R135H | Q96Q80 | protein_coding | deleterious(0.02) | possibly_damaging(0.722) | TCGA-AP-A051-01 | Endometrium | uterine corpus endometrioid carcinoma | Female | >=65 | I/II | Unknown | Unknown | SD |
| DERL3 | SNV | Missense_Mutation | novel | c.503N>A | p.Ser168Tyr | p.S168Y | Q96Q80 | protein_coding | deleterious(0) | probably_damaging(0.967) | TCGA-AX-A1CE-01 | Endometrium | uterine corpus endometrioid carcinoma | Female | <65 | I/II | Unspecific | Paclitaxel | SD |
| DERL3 | SNV | Missense_Mutation | novel | c.61A>G | p.Thr21Ala | p.T21A | Q96Q80 | protein_coding | tolerated(0.24) | benign(0.043) | TCGA-AX-A2HJ-01 | Endometrium | uterine corpus endometrioid carcinoma | Female | <65 | I/II | Unknown | Unknown | SD |
| DERL3 | SNV | Missense_Mutation | novel | c.59A>G | p.Tyr20Cys | p.Y20C | Q96Q80 | protein_coding | deleterious(0) | benign(0.412) | TCGA-AX-A2HJ-01 | Endometrium | uterine corpus endometrioid carcinoma | Female | <65 | I/II | Unknown | Unknown | SD |
| DERL3 | SNV | Missense_Mutation | novel | c.121N>A | p.Leu41Ile | p.L41I | Q96Q80 | protein_coding | tolerated(0.12) | possibly_damaging(0.668) | TCGA-AX-A3FT-01 | Endometrium | uterine corpus endometrioid carcinoma | Female | <65 | I/II | Unknown | Unknown | SD |
| DERL3 | SNV | Missense_Mutation | novel | c.656N>T | p.Thr219Ile | p.T219I | Q96Q80 | protein_coding | tolerated(0.38) | benign(0.018) | TCGA-D1-A103-01 | Endometrium | uterine corpus endometrioid carcinoma | Female | >=65 | I/II | Unknown | Unknown | SD |
| Page: 1 2 |
Top |
Related drugs of malignant transformation related genes |
| Identification of chemicals and drugs interact with genes involved in malignant transfromation |
| (DGIdb 4.0) |
| Entrez ID | Symbol | Category | Interaction Types | Drug Claim Name | Drug Name | PMIDs |
| Page: 1 |

Copyright 2023-Present -The University of Texas Health Science Center at Houston |