
|
|||||
|
 | |
| |
| |
| |
| |
| |
|
Gene: DERL2 |
Gene summary for DERL2 |
| Gene information | Species | Human | Gene symbol | DERL2 | Gene ID | 51009 |
| Gene name | derlin 2 | |
| Gene Alias | CGI-101 | |
| Cytomap | 17p13.2 | |
| Gene Type | protein-coding | GO ID | GO:0001558 | UniProtAcc | I3L3R8 |
Top |
Malignant transformation analysis |
| Identification of the aberrant gene expression in precancerous and cancerous lesions by comparing the gene expression of stem-like cells in diseased tissues with normal stem cells |
| Entrez ID | Symbol | Replicates | Species | Organ | Tissue | Adj P-value | Log2FC | Malignancy |
| 51009 | DERL2 | LZE2T | Human | Esophagus | ESCC | 3.40e-02 | 6.39e-01 | 0.082 |
| 51009 | DERL2 | LZE4T | Human | Esophagus | ESCC | 5.66e-18 | 5.66e-01 | 0.0811 |
| 51009 | DERL2 | LZE5T | Human | Esophagus | ESCC | 2.88e-12 | 4.30e-01 | 0.0514 |
| 51009 | DERL2 | LZE7T | Human | Esophagus | ESCC | 1.23e-09 | 7.25e-01 | 0.0667 |
| 51009 | DERL2 | LZE8T | Human | Esophagus | ESCC | 2.10e-06 | 2.93e-01 | 0.067 |
| 51009 | DERL2 | LZE20T | Human | Esophagus | ESCC | 1.64e-04 | 2.31e-01 | 0.0662 |
| 51009 | DERL2 | LZE22D1 | Human | Esophagus | HGIN | 9.13e-04 | 1.14e-01 | 0.0595 |
| 51009 | DERL2 | LZE24T | Human | Esophagus | ESCC | 4.56e-29 | 8.80e-01 | 0.0596 |
| 51009 | DERL2 | LZE22D3 | Human | Esophagus | HGIN | 2.19e-03 | 3.37e-01 | 0.0653 |
| 51009 | DERL2 | LZE21T | Human | Esophagus | ESCC | 9.19e-06 | 2.51e-01 | 0.0655 |
| 51009 | DERL2 | LZE6T | Human | Esophagus | ESCC | 3.08e-10 | 6.27e-01 | 0.0845 |
| 51009 | DERL2 | P1T-E | Human | Esophagus | ESCC | 5.49e-10 | 6.23e-01 | 0.0875 |
| 51009 | DERL2 | P2T-E | Human | Esophagus | ESCC | 2.12e-31 | 5.74e-01 | 0.1177 |
| 51009 | DERL2 | P4T-E | Human | Esophagus | ESCC | 8.16e-49 | 1.11e+00 | 0.1323 |
| 51009 | DERL2 | P5T-E | Human | Esophagus | ESCC | 1.75e-19 | 4.53e-01 | 0.1327 |
| 51009 | DERL2 | P8T-E | Human | Esophagus | ESCC | 9.45e-40 | 8.26e-01 | 0.0889 |
| 51009 | DERL2 | P9T-E | Human | Esophagus | ESCC | 9.43e-24 | 4.59e-01 | 0.1131 |
| 51009 | DERL2 | P10T-E | Human | Esophagus | ESCC | 1.47e-28 | 5.67e-01 | 0.116 |
| 51009 | DERL2 | P11T-E | Human | Esophagus | ESCC | 1.40e-22 | 8.65e-01 | 0.1426 |
| 51009 | DERL2 | P12T-E | Human | Esophagus | ESCC | 5.96e-31 | 7.20e-01 | 0.1122 |
| Page: 1 2 3 4 5 6 |
| Tissue | Expression Dynamics | Abbreviation |
| Esophagus |  | ESCC: Esophageal squamous cell carcinoma |
| HGIN: High-grade intraepithelial neoplasias | ||
| LGIN: Low-grade intraepithelial neoplasias | ||
| Liver |  | HCC: Hepatocellular carcinoma |
| NAFLD: Non-alcoholic fatty liver disease | ||
| Oral Cavity | 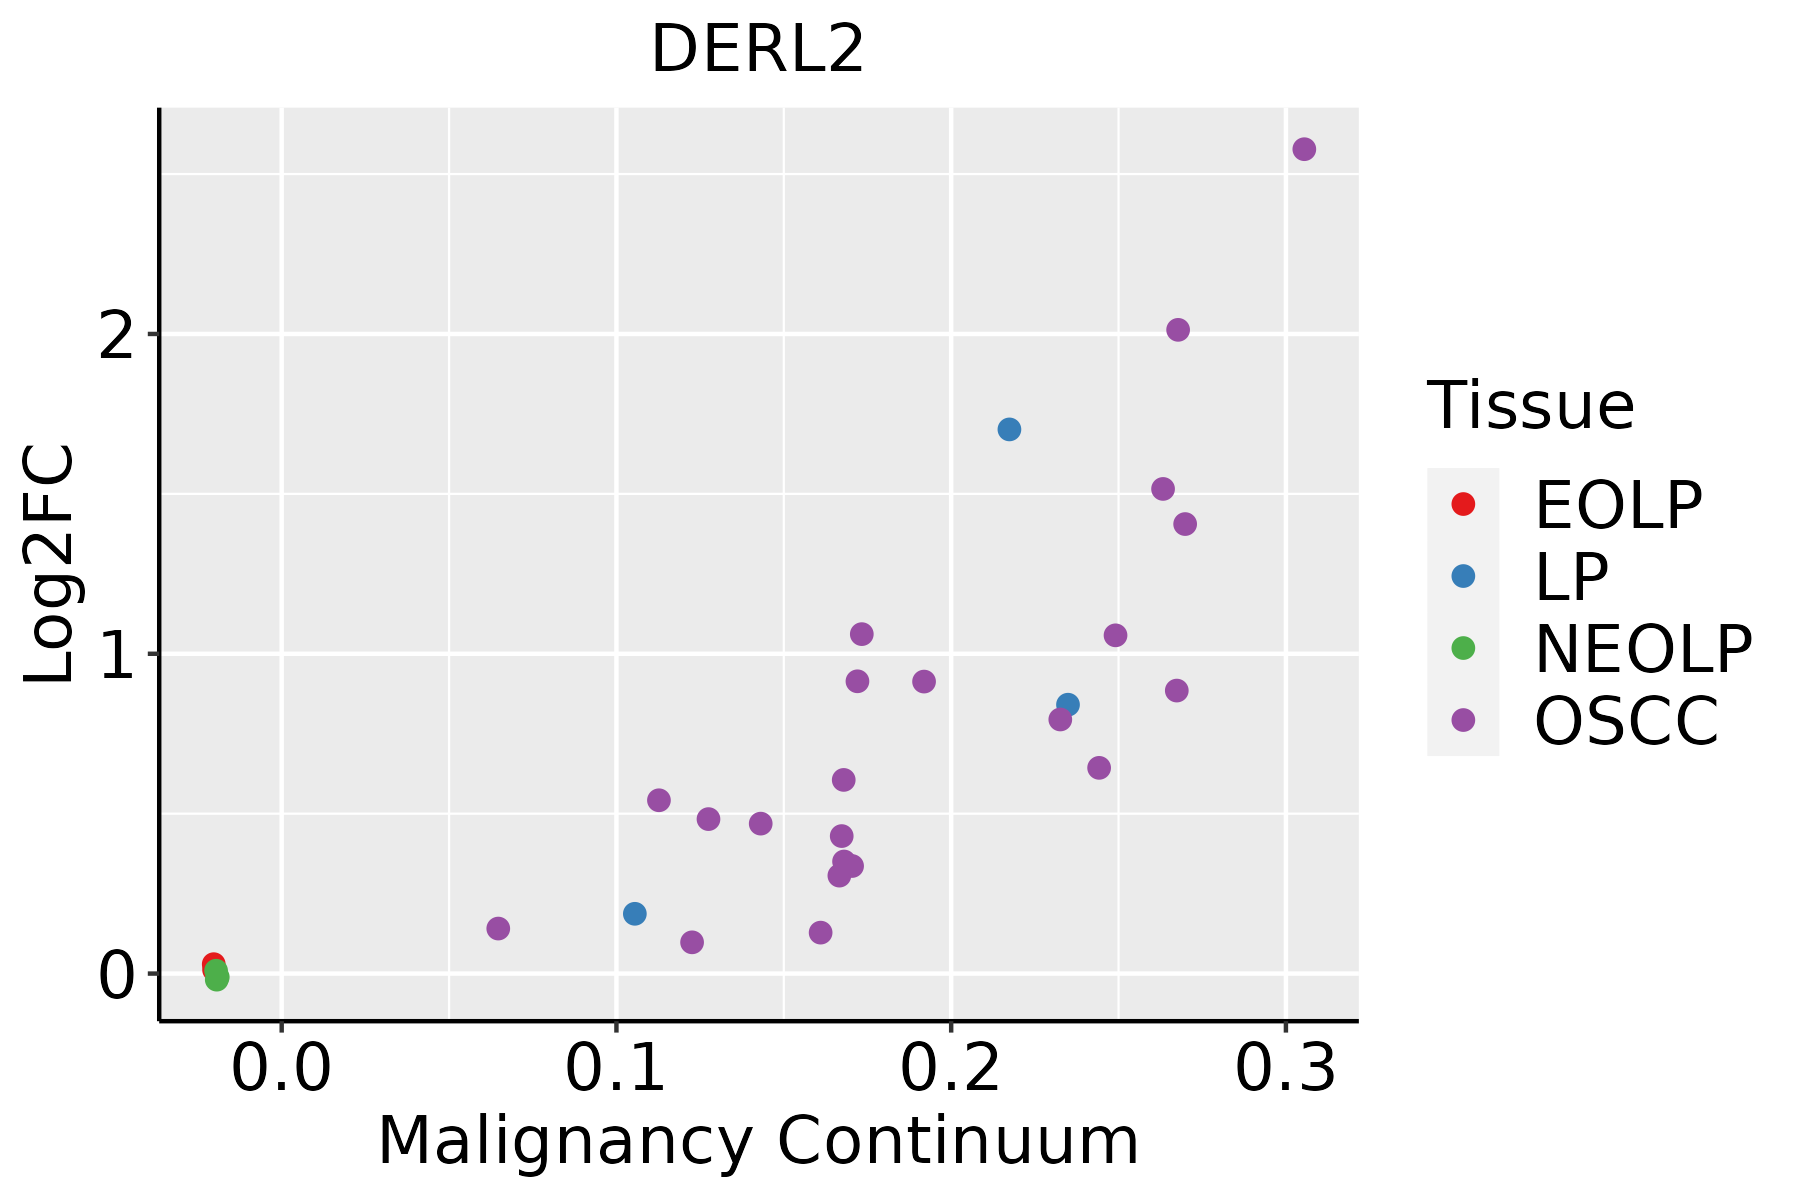 | EOLP: Erosive Oral lichen planus |
| LP: leukoplakia | ||
| NEOLP: Non-erosive oral lichen planus | ||
| OSCC: Oral squamous cell carcinoma | ||
| Skin | 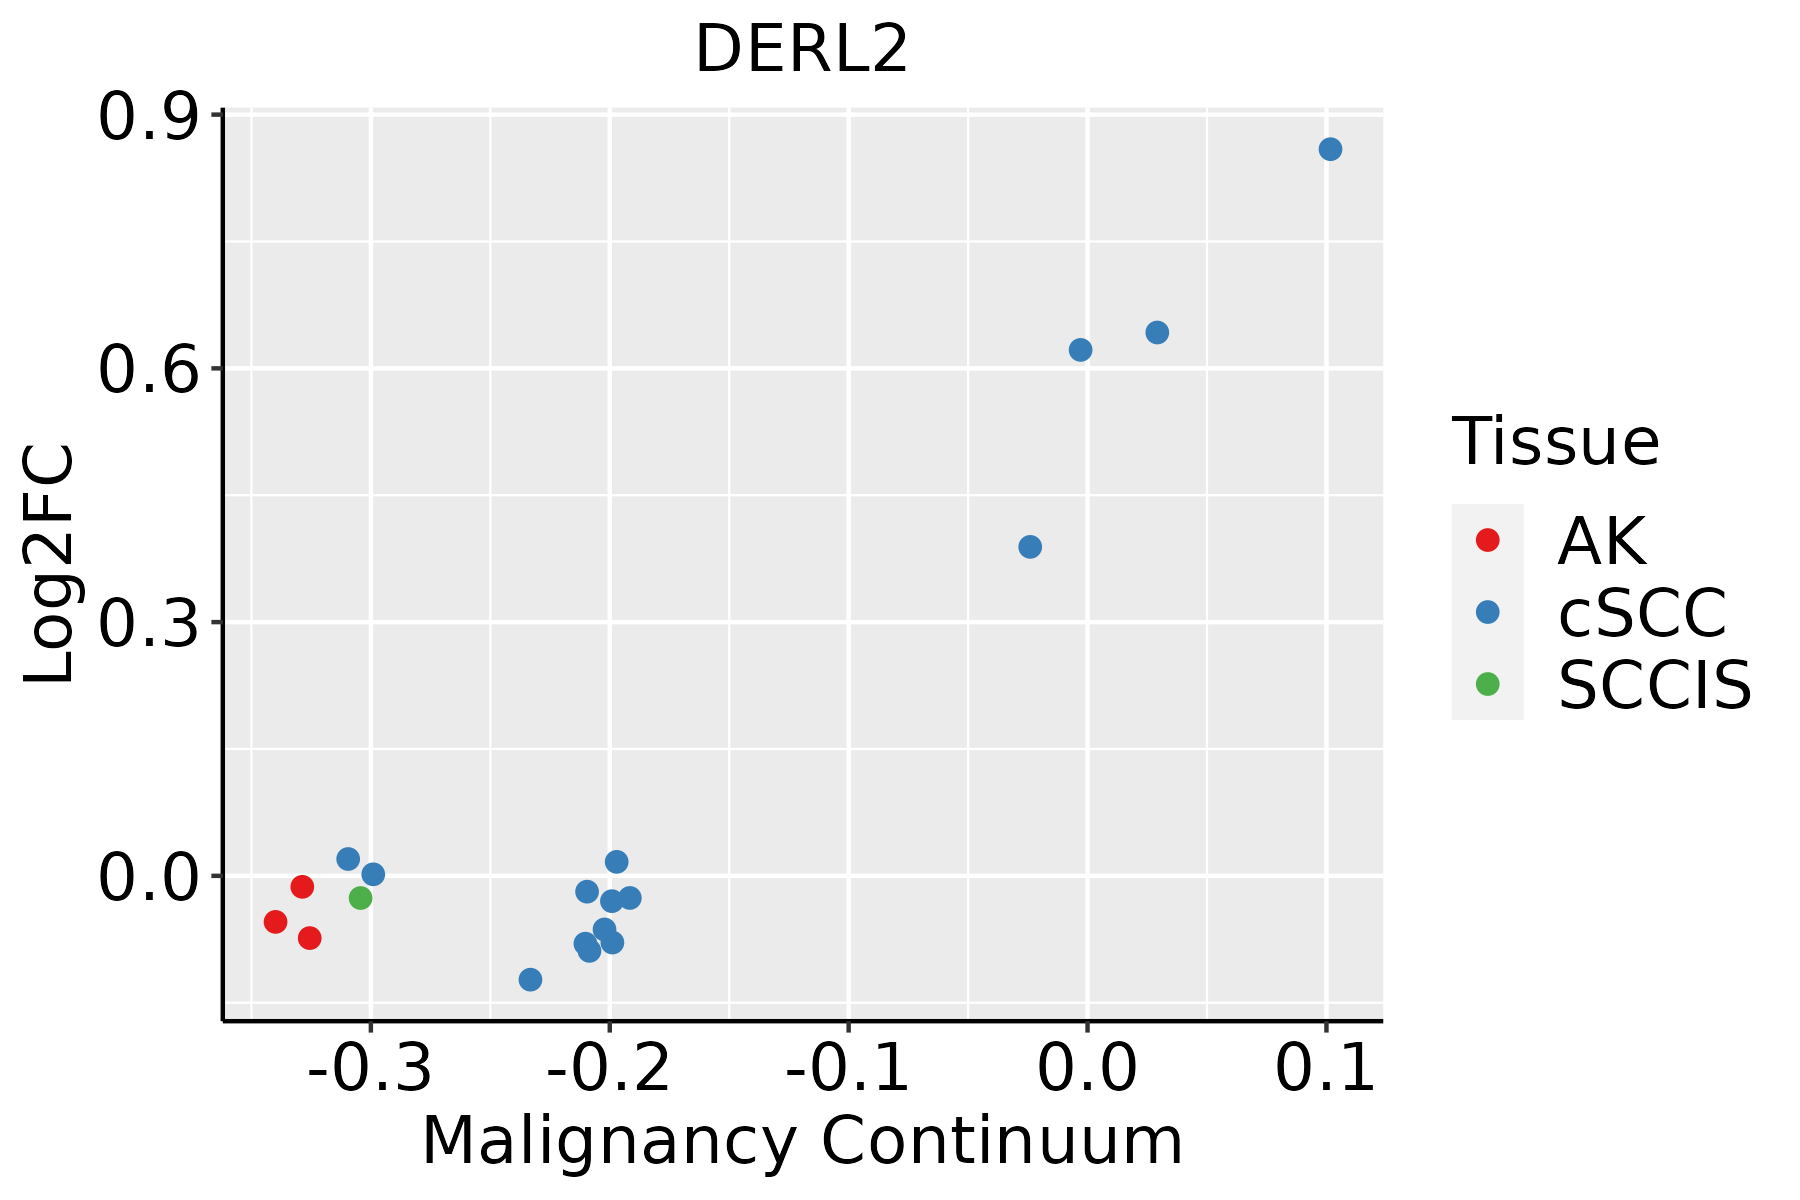 | AK: Actinic keratosis |
| cSCC: Cutaneous squamous cell carcinoma | ||
| SCCIS:squamous cell carcinoma in situ | ||
| Thyroid | 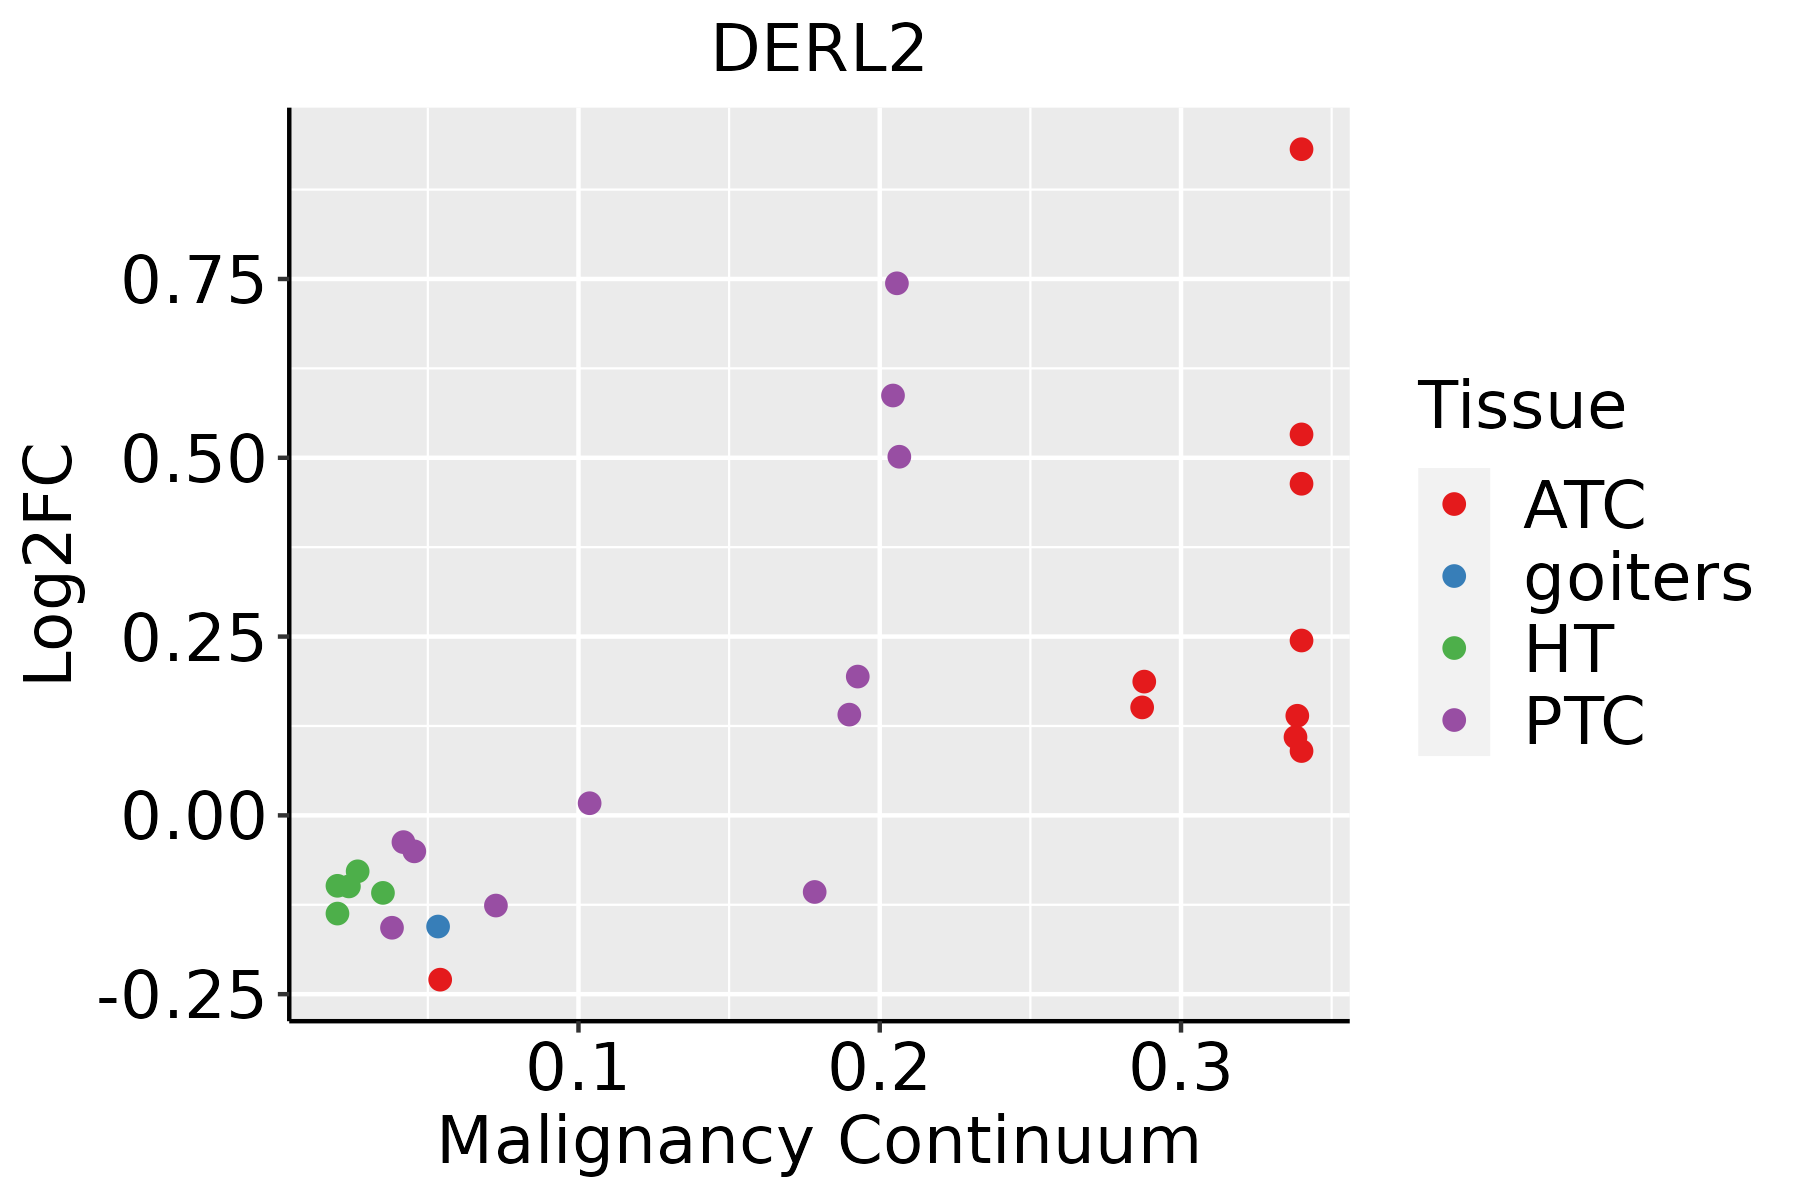 | ATC: Anaplastic thyroid cancer |
| HT: Hashimoto's thyroiditis | ||
| PTC: Papillary thyroid cancer |
| ∗log2FC in expression of this searched gene in stem-like cells from each diseased tissue sample relative to stem-like cells in normal samples in each tissue plotted against the malignancy continuum. Samples are colored based on if they are from different disease stage. |
Top |
Malignant transformation related pathway analysis |
| Find out the enriched GO biological processes and KEGG pathways involved in transition from healthy to precancer to cancer |
| Tissue | Disease Stage | Enriched GO biological Processes |
| Colorectum | AD |  |
| Colorectum | SER |  |
| Colorectum | MSS |  |
| Colorectum | MSI-H |  |
| Colorectum | FAP |  |
| ∗Top 15 enriched GO BP terms are showed in the bar plot of each disease state in each tissue. Each row represents a significant GO biological process which is colored according to the -log10(p.adjust). |
| Page: 1 2 3 4 5 6 7 8 9 |
| GO ID | Tissue | Disease Stage | Description | Gene Ratio | Bg Ratio | pvalue | p.adjust | Count |
| GO:001049826 | Esophagus | HGIN | proteasomal protein catabolic process | 139/2587 | 490/18723 | 1.20e-17 | 3.41e-15 | 139 |
| GO:004316126 | Esophagus | HGIN | proteasome-mediated ubiquitin-dependent protein catabolic process | 114/2587 | 412/18723 | 7.00e-14 | 1.20e-11 | 114 |
| GO:003497625 | Esophagus | HGIN | response to endoplasmic reticulum stress | 81/2587 | 256/18723 | 1.47e-13 | 2.32e-11 | 81 |
| GO:003596625 | Esophagus | HGIN | response to topologically incorrect protein | 54/2587 | 159/18723 | 8.53e-11 | 8.89e-09 | 54 |
| GO:000698625 | Esophagus | HGIN | response to unfolded protein | 48/2587 | 137/18723 | 2.80e-10 | 2.54e-08 | 48 |
| GO:003596725 | Esophagus | HGIN | cellular response to topologically incorrect protein | 41/2587 | 116/18723 | 4.07e-09 | 2.84e-07 | 41 |
| GO:003462020 | Esophagus | HGIN | cellular response to unfolded protein | 36/2587 | 96/18723 | 5.82e-09 | 3.88e-07 | 36 |
| GO:003238617 | Esophagus | HGIN | regulation of intracellular transport | 79/2587 | 337/18723 | 1.11e-06 | 4.36e-05 | 79 |
| GO:003315720 | Esophagus | HGIN | regulation of intracellular protein transport | 58/2587 | 229/18723 | 2.29e-06 | 8.29e-05 | 58 |
| GO:003096817 | Esophagus | HGIN | endoplasmic reticulum unfolded protein response | 24/2587 | 74/18723 | 3.39e-05 | 8.61e-04 | 24 |
| GO:00309706 | Esophagus | HGIN | retrograde protein transport, ER to cytosol | 12/2587 | 29/18723 | 2.48e-04 | 4.38e-03 | 12 |
| GO:19035136 | Esophagus | HGIN | endoplasmic reticulum to cytosol transport | 12/2587 | 29/18723 | 2.48e-04 | 4.38e-03 | 12 |
| GO:001604919 | Esophagus | HGIN | cell growth | 93/2587 | 482/18723 | 4.49e-04 | 6.62e-03 | 93 |
| GO:00365036 | Esophagus | HGIN | ERAD pathway | 27/2587 | 107/18723 | 1.15e-03 | 1.39e-02 | 27 |
| GO:00325277 | Esophagus | HGIN | protein exit from endoplasmic reticulum | 15/2587 | 48/18723 | 1.49e-03 | 1.73e-02 | 15 |
| GO:00304335 | Esophagus | HGIN | ubiquitin-dependent ERAD pathway | 22/2587 | 85/18723 | 2.24e-03 | 2.31e-02 | 22 |
| GO:000155818 | Esophagus | HGIN | regulation of cell growth | 76/2587 | 414/18723 | 5.40e-03 | 4.42e-02 | 76 |
| GO:0010498111 | Esophagus | ESCC | proteasomal protein catabolic process | 369/8552 | 490/18723 | 1.13e-41 | 1.80e-38 | 369 |
| GO:0043161111 | Esophagus | ESCC | proteasome-mediated ubiquitin-dependent protein catabolic process | 312/8552 | 412/18723 | 3.53e-36 | 4.48e-33 | 312 |
| GO:003238618 | Esophagus | ESCC | regulation of intracellular transport | 243/8552 | 337/18723 | 3.20e-23 | 7.25e-21 | 243 |
| Page: 1 2 3 4 5 6 7 8 9 10 11 12 |
| Pathway ID | Tissue | Disease Stage | Description | Gene Ratio | Bg Ratio | pvalue | p.adjust | qvalue | Count |
| hsa0414139 | Esophagus | HGIN | Protein processing in endoplasmic reticulum | 67/1383 | 174/8465 | 1.06e-12 | 2.16e-11 | 1.72e-11 | 67 |
| hsa04141114 | Esophagus | HGIN | Protein processing in endoplasmic reticulum | 67/1383 | 174/8465 | 1.06e-12 | 2.16e-11 | 1.72e-11 | 67 |
| hsa04141211 | Esophagus | ESCC | Protein processing in endoplasmic reticulum | 147/4205 | 174/8465 | 3.29e-22 | 1.10e-19 | 5.64e-20 | 147 |
| hsa04141310 | Esophagus | ESCC | Protein processing in endoplasmic reticulum | 147/4205 | 174/8465 | 3.29e-22 | 1.10e-19 | 5.64e-20 | 147 |
| hsa0414114 | Liver | Cirrhotic | Protein processing in endoplasmic reticulum | 114/2530 | 174/8465 | 1.16e-22 | 9.67e-21 | 5.96e-21 | 114 |
| hsa0414115 | Liver | Cirrhotic | Protein processing in endoplasmic reticulum | 114/2530 | 174/8465 | 1.16e-22 | 9.67e-21 | 5.96e-21 | 114 |
| hsa0414122 | Liver | HCC | Protein processing in endoplasmic reticulum | 146/4020 | 174/8465 | 7.34e-24 | 2.46e-21 | 1.37e-21 | 146 |
| hsa0414132 | Liver | HCC | Protein processing in endoplasmic reticulum | 146/4020 | 174/8465 | 7.34e-24 | 2.46e-21 | 1.37e-21 | 146 |
| hsa0414130 | Oral cavity | OSCC | Protein processing in endoplasmic reticulum | 143/3704 | 174/8465 | 6.82e-26 | 2.28e-23 | 1.16e-23 | 143 |
| hsa04141113 | Oral cavity | OSCC | Protein processing in endoplasmic reticulum | 143/3704 | 174/8465 | 6.82e-26 | 2.28e-23 | 1.16e-23 | 143 |
| hsa04141210 | Oral cavity | LP | Protein processing in endoplasmic reticulum | 113/2418 | 174/8465 | 8.74e-24 | 5.82e-22 | 3.76e-22 | 113 |
| hsa0414138 | Oral cavity | LP | Protein processing in endoplasmic reticulum | 113/2418 | 174/8465 | 8.74e-24 | 5.82e-22 | 3.76e-22 | 113 |
| Page: 1 |
Top |
Cell-cell communication analysis |
| Identification of potential cell-cell interactions between two cell types and their ligand-receptor pairs for different disease states |
| Ligand | Receptor | LRpair | Pathway | Tissue | Disease Stage |
| Page: 1 |
Top |
Single-cell gene regulatory network inference analysis |
| Find out the significant the regulons (TFs) and the target genes of each regulon across cell types for different disease states |
| TF | Cell Type | Tissue | Disease Stage | Target Gene | RSS | Regulon Activity |
| ∗The dot plots of a searched regulon are shown for all cell subpopulations in each disease state of each tissue based on the regulon specific score inferred using pySCENIC and by calculating the average expression. |
| Page: 1 |
Top |
Somatic mutation of malignant transformation related genes |
| Annotation of somatic variants for genes involved in malignant transformation |
| Hugo Symbol | Variant Class | Variant Classification | dbSNP RS | HGVSc | HGVSp | HGVSp Short | SWISSPROT | BIOTYPE | SIFT | PolyPhen | Tumor Sample Barcode | Tissue | Histology | Sex | Age | Stage | Therapy Types | Drugs | Outcome |
| DERL2 | SNV | Missense_Mutation | c.429C>A | p.Phe143Leu | p.F143L | Q9GZP9 | protein_coding | deleterious(0.05) | benign(0.327) | TCGA-AA-A010-01 | Colorectum | colon adenocarcinoma | Female | <65 | I/II | Chemotherapy | folinic | CR | |
| DERL2 | SNV | Missense_Mutation | c.238C>T | p.Arg80Cys | p.R80C | Q9GZP9 | protein_coding | deleterious(0.03) | probably_damaging(0.997) | TCGA-AU-6004-01 | Colorectum | colon adenocarcinoma | Female | >=65 | I/II | Unknown | Unknown | SD | |
| DERL2 | SNV | Missense_Mutation | novel | c.129C>A | p.Phe43Leu | p.F43L | Q9GZP9 | protein_coding | tolerated(0.22) | probably_damaging(0.956) | TCGA-CA-6718-01 | Colorectum | colon adenocarcinoma | Male | <65 | I/II | Unknown | Unknown | PD |
| DERL2 | SNV | Missense_Mutation | c.324G>A | p.Met108Ile | p.M108I | Q9GZP9 | protein_coding | tolerated(0.18) | benign(0.029) | TCGA-AG-A01W-01 | Colorectum | rectum adenocarcinoma | Female | >=65 | I/II | Chemotherapy | 5-fluorouracil | CR | |
| DERL2 | SNV | Missense_Mutation | novel | c.511N>A | p.Val171Met | p.V171M | Q9GZP9 | protein_coding | tolerated(0.06) | possibly_damaging(0.816) | TCGA-A5-A0G2-01 | Endometrium | uterine corpus endometrioid carcinoma | Female | <65 | III/IV | Unknown | Unknown | SD |
| DERL2 | SNV | Missense_Mutation | c.608C>A | p.Ser203Tyr | p.S203Y | Q9GZP9 | protein_coding | tolerated(0.15) | benign(0.003) | TCGA-D1-A16X-01 | Endometrium | uterine corpus endometrioid carcinoma | Female | <65 | I/II | Unknown | Unknown | SD | |
| DERL2 | SNV | Missense_Mutation | novel | c.346N>G | p.Ser116Gly | p.S116G | Q9GZP9 | protein_coding | deleterious(0.02) | benign(0.099) | TCGA-DI-A1BU-01 | Endometrium | uterine corpus endometrioid carcinoma | Female | <65 | I/II | Chemotherapy | paclitaxel | SD |
| DERL2 | SNV | Missense_Mutation | novel | c.377N>C | p.Ile126Thr | p.I126T | Q9GZP9 | protein_coding | tolerated(0.18) | benign(0.081) | TCGA-FI-A2D5-01 | Endometrium | uterine corpus endometrioid carcinoma | Female | <65 | III/IV | Chemotherapy | carboplatinum | PD |
| DERL2 | insertion | Frame_Shift_Ins | novel | c.192dupT | p.Gly65TrpfsTer10 | p.G65Wfs*10 | Q9GZP9 | protein_coding | TCGA-EO-A22U-01 | Endometrium | uterine corpus endometrioid carcinoma | Female | >=65 | I/II | Unknown | Unknown | SD | ||
| DERL2 | SNV | Missense_Mutation | c.391G>T | p.Val131Leu | p.V131L | Q9GZP9 | protein_coding | deleterious(0.03) | benign(0.172) | TCGA-55-8511-01 | Lung | lung adenocarcinoma | Female | >=65 | I/II | Unknown | Unknown | PD |
| Page: 1 2 |
Top |
Related drugs of malignant transformation related genes |
| Identification of chemicals and drugs interact with genes involved in malignant transfromation |
| (DGIdb 4.0) |
| Entrez ID | Symbol | Category | Interaction Types | Drug Claim Name | Drug Name | PMIDs |
| Page: 1 |

Copyright 2023-Present -The University of Texas Health Science Center at Houston |