
|
|||||
|
 | |
| |
| |
| |
| |
| |
|
Gene: DERA |
Gene summary for DERA |
| Gene information | Species | Human | Gene symbol | DERA | Gene ID | 51071 |
| Gene name | deoxyribose-phosphate aldolase | |
| Gene Alias | CGI-26 | |
| Cytomap | 12p12.3 | |
| Gene Type | protein-coding | GO ID | GO:0005975 | UniProtAcc | E9PPM8 |
Top |
Malignant transformation analysis |
| Identification of the aberrant gene expression in precancerous and cancerous lesions by comparing the gene expression of stem-like cells in diseased tissues with normal stem cells |
| Entrez ID | Symbol | Replicates | Species | Organ | Tissue | Adj P-value | Log2FC | Malignancy |
| 51071 | DERA | CCI_1 | Human | Cervix | CC | 2.35e-02 | 5.71e-01 | 0.528 |
| 51071 | DERA | CCI_2 | Human | Cervix | CC | 4.67e-04 | 6.65e-01 | 0.5249 |
| 51071 | DERA | CCI_3 | Human | Cervix | CC | 8.73e-08 | 7.48e-01 | 0.516 |
| 51071 | DERA | sample3 | Human | Cervix | CC | 4.94e-04 | 2.10e-01 | 0.1387 |
| 51071 | DERA | LZE2T | Human | Esophagus | ESCC | 1.44e-03 | 5.40e-01 | 0.082 |
| 51071 | DERA | LZE3D | Human | Esophagus | HGIN | 6.52e-03 | 5.66e-01 | 0.0668 |
| 51071 | DERA | LZE4T | Human | Esophagus | ESCC | 5.76e-11 | 3.03e-01 | 0.0811 |
| 51071 | DERA | LZE5T | Human | Esophagus | ESCC | 1.31e-05 | 4.02e-01 | 0.0514 |
| 51071 | DERA | LZE7T | Human | Esophagus | ESCC | 5.73e-07 | 6.37e-01 | 0.0667 |
| 51071 | DERA | LZE8T | Human | Esophagus | ESCC | 4.91e-23 | 7.27e-01 | 0.067 |
| 51071 | DERA | LZE20T | Human | Esophagus | ESCC | 4.12e-09 | 3.06e-01 | 0.0662 |
| 51071 | DERA | LZE22D1 | Human | Esophagus | HGIN | 1.25e-03 | 1.44e-01 | 0.0595 |
| 51071 | DERA | LZE22T | Human | Esophagus | ESCC | 2.40e-02 | 4.26e-01 | 0.068 |
| 51071 | DERA | LZE24T | Human | Esophagus | ESCC | 2.65e-20 | 5.32e-01 | 0.0596 |
| 51071 | DERA | LZE21T | Human | Esophagus | ESCC | 2.19e-06 | 5.62e-01 | 0.0655 |
| 51071 | DERA | LZE6T | Human | Esophagus | ESCC | 1.64e-08 | 2.84e-01 | 0.0845 |
| 51071 | DERA | P2T-E | Human | Esophagus | ESCC | 1.86e-41 | 8.39e-01 | 0.1177 |
| 51071 | DERA | P4T-E | Human | Esophagus | ESCC | 3.05e-41 | 1.09e+00 | 0.1323 |
| 51071 | DERA | P5T-E | Human | Esophagus | ESCC | 6.42e-25 | 5.95e-01 | 0.1327 |
| 51071 | DERA | P8T-E | Human | Esophagus | ESCC | 1.85e-36 | 6.69e-01 | 0.0889 |
| Page: 1 2 3 4 5 6 7 |
| Tissue | Expression Dynamics | Abbreviation |
| Cervix |  | CC: Cervix cancer |
| HSIL_HPV: HPV-infected high-grade squamous intraepithelial lesions | ||
| N_HPV: HPV-infected normal cervix | ||
| Esophagus | 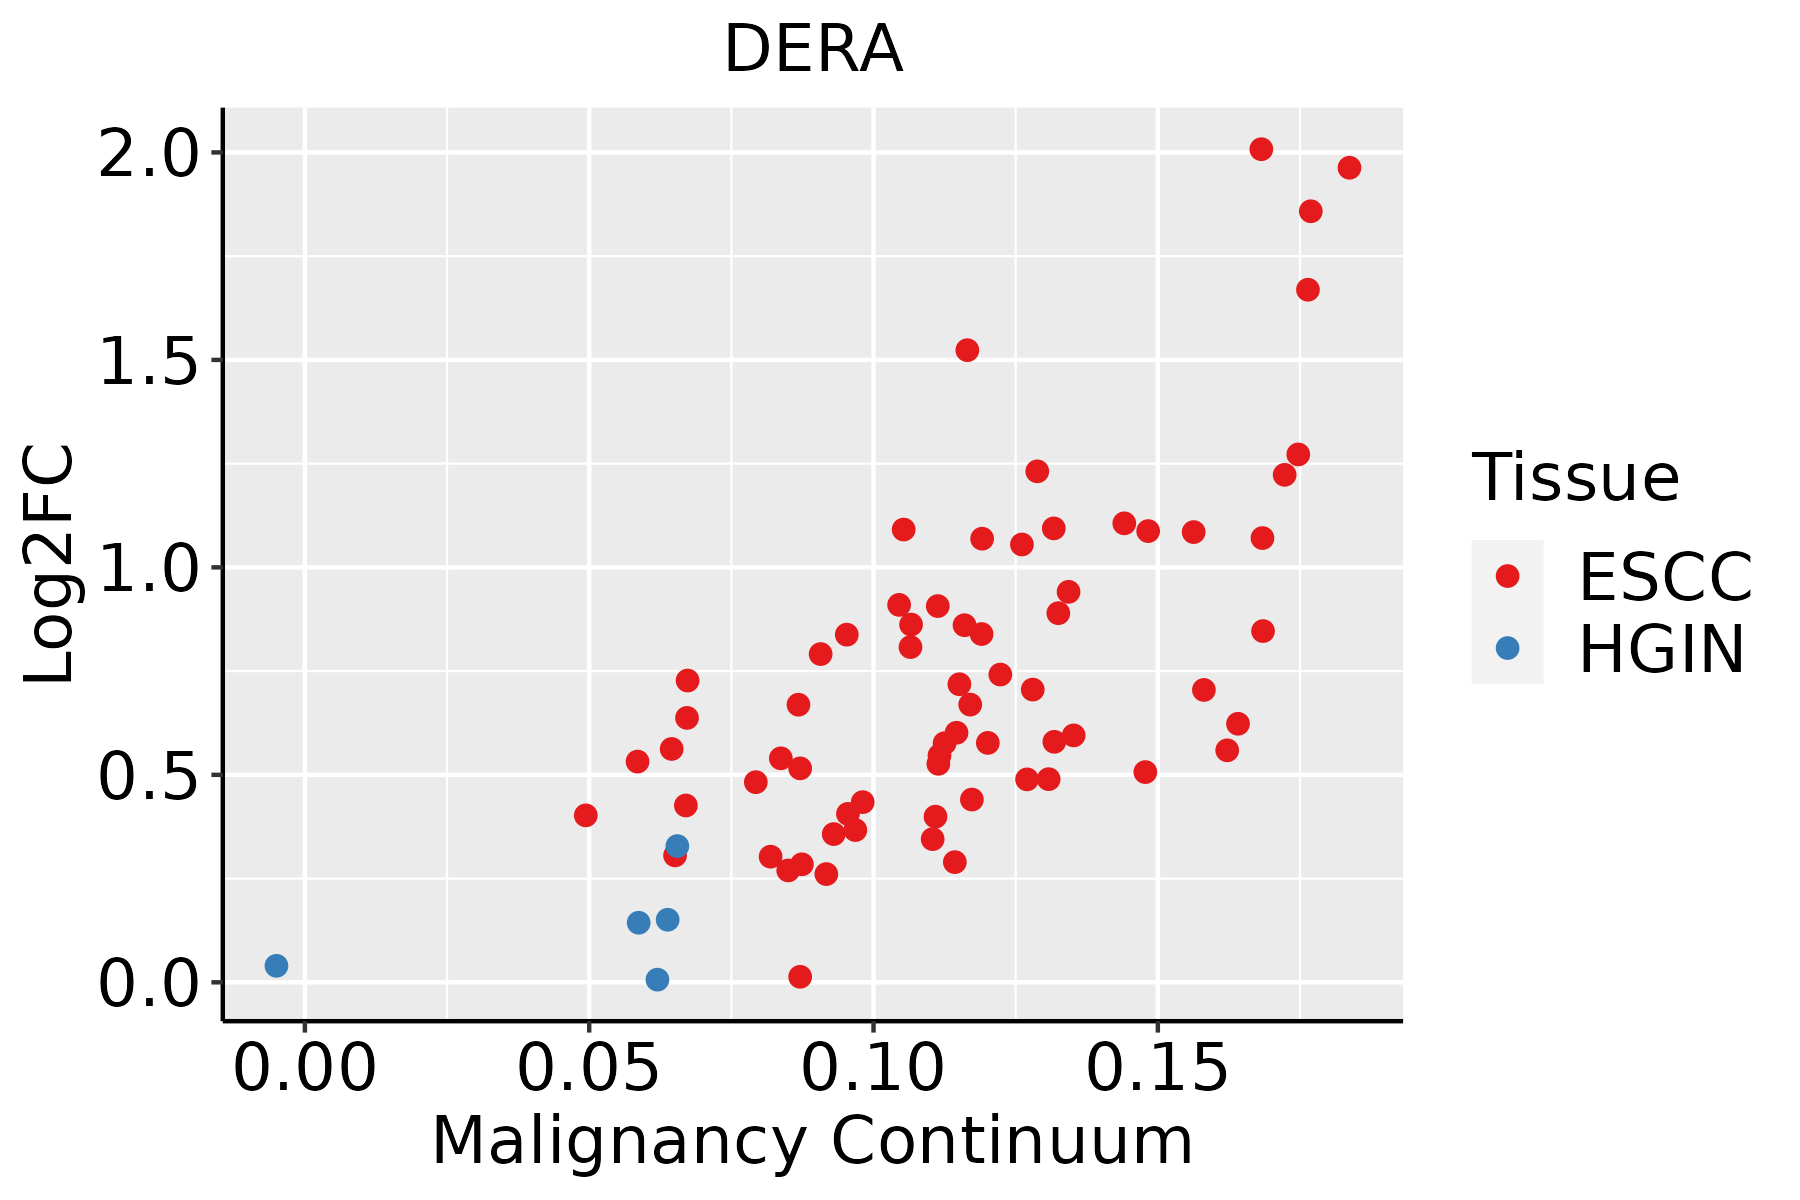 | ESCC: Esophageal squamous cell carcinoma |
| HGIN: High-grade intraepithelial neoplasias | ||
| LGIN: Low-grade intraepithelial neoplasias | ||
| Liver |  | HCC: Hepatocellular carcinoma |
| NAFLD: Non-alcoholic fatty liver disease | ||
| Oral Cavity |  | EOLP: Erosive Oral lichen planus |
| LP: leukoplakia | ||
| NEOLP: Non-erosive oral lichen planus | ||
| OSCC: Oral squamous cell carcinoma | ||
| Skin | 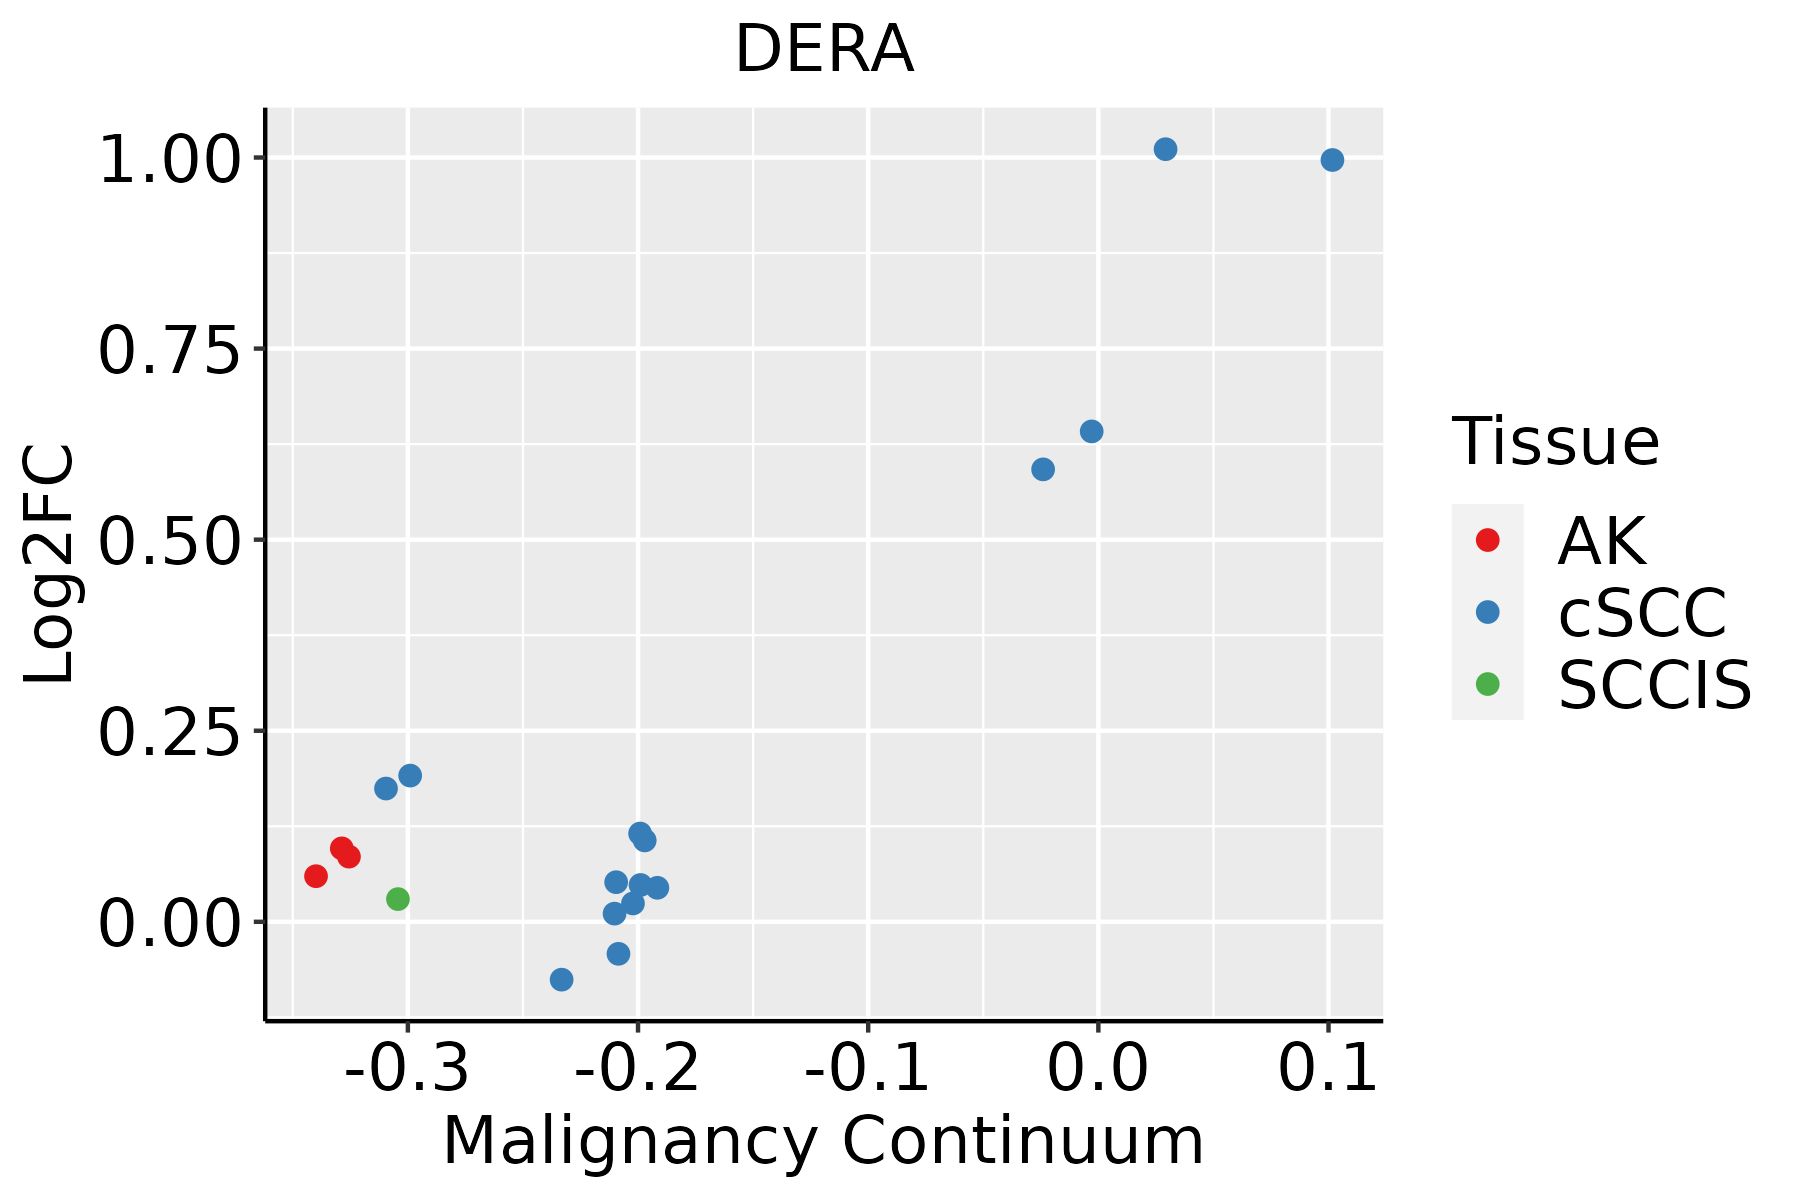 | AK: Actinic keratosis |
| cSCC: Cutaneous squamous cell carcinoma | ||
| SCCIS:squamous cell carcinoma in situ | ||
| Thyroid |  | ATC: Anaplastic thyroid cancer |
| HT: Hashimoto's thyroiditis | ||
| PTC: Papillary thyroid cancer |
| ∗log2FC in expression of this searched gene in stem-like cells from each diseased tissue sample relative to stem-like cells in normal samples in each tissue plotted against the malignancy continuum. Samples are colored based on if they are from different disease stage. |
Top |
Malignant transformation related pathway analysis |
| Find out the enriched GO biological processes and KEGG pathways involved in transition from healthy to precancer to cancer |
| Tissue | Disease Stage | Enriched GO biological Processes |
| Colorectum | AD |  |
| Colorectum | SER |  |
| Colorectum | MSS |  |
| Colorectum | MSI-H |  |
| Colorectum | FAP |  |
| ∗Top 15 enriched GO BP terms are showed in the bar plot of each disease state in each tissue. Each row represents a significant GO biological process which is colored according to the -log10(p.adjust). |
| Page: 1 2 3 4 5 6 7 8 9 |
| GO ID | Tissue | Disease Stage | Description | Gene Ratio | Bg Ratio | pvalue | p.adjust | Count |
| GO:00060919 | Cervix | CC | generation of precursor metabolites and energy | 105/2311 | 490/18723 | 7.40e-09 | 6.61e-07 | 105 |
| GO:00467008 | Cervix | CC | heterocycle catabolic process | 80/2311 | 445/18723 | 3.23e-04 | 3.42e-03 | 80 |
| GO:00346559 | Cervix | CC | nucleobase-containing compound catabolic process | 74/2311 | 407/18723 | 3.77e-04 | 3.88e-03 | 74 |
| GO:00442709 | Cervix | CC | cellular nitrogen compound catabolic process | 79/2311 | 451/18723 | 7.80e-04 | 6.91e-03 | 79 |
| GO:00194398 | Cervix | CC | aromatic compound catabolic process | 79/2311 | 467/18723 | 2.14e-03 | 1.54e-02 | 79 |
| GO:19013618 | Cervix | CC | organic cyclic compound catabolic process | 80/2311 | 495/18723 | 6.77e-03 | 3.72e-02 | 80 |
| GO:000911710 | Cervix | CC | nucleotide metabolic process | 79/2311 | 489/18723 | 7.16e-03 | 3.85e-02 | 79 |
| GO:000609120 | Esophagus | HGIN | generation of precursor metabolites and energy | 145/2587 | 490/18723 | 3.41e-20 | 2.04e-17 | 145 |
| GO:003465519 | Esophagus | HGIN | nucleobase-containing compound catabolic process | 98/2587 | 407/18723 | 1.44e-08 | 8.94e-07 | 98 |
| GO:004670017 | Esophagus | HGIN | heterocycle catabolic process | 103/2587 | 445/18723 | 5.44e-08 | 2.99e-06 | 103 |
| GO:004427018 | Esophagus | HGIN | cellular nitrogen compound catabolic process | 103/2587 | 451/18723 | 1.10e-07 | 5.56e-06 | 103 |
| GO:001943917 | Esophagus | HGIN | aromatic compound catabolic process | 105/2587 | 467/18723 | 1.89e-07 | 9.31e-06 | 105 |
| GO:190136117 | Esophagus | HGIN | organic cyclic compound catabolic process | 106/2587 | 495/18723 | 1.94e-06 | 7.13e-05 | 106 |
| GO:00196924 | Esophagus | HGIN | deoxyribose phosphate metabolic process | 16/2587 | 42/18723 | 7.90e-05 | 1.76e-03 | 16 |
| GO:00092624 | Esophagus | HGIN | deoxyribonucleotide metabolic process | 16/2587 | 44/18723 | 1.51e-04 | 2.97e-03 | 16 |
| GO:00092643 | Esophagus | HGIN | deoxyribonucleotide catabolic process | 12/2587 | 30/18723 | 3.62e-04 | 5.68e-03 | 12 |
| GO:00463863 | Esophagus | HGIN | deoxyribose phosphate catabolic process | 12/2587 | 31/18723 | 5.17e-04 | 7.46e-03 | 12 |
| GO:000911720 | Esophagus | HGIN | nucleotide metabolic process | 92/2587 | 489/18723 | 1.11e-03 | 1.36e-02 | 92 |
| GO:000675320 | Esophagus | HGIN | nucleoside phosphate metabolic process | 93/2587 | 497/18723 | 1.25e-03 | 1.49e-02 | 93 |
| GO:00060983 | Esophagus | HGIN | pentose-phosphate shunt | 7/2587 | 15/18723 | 2.22e-03 | 2.28e-02 | 7 |
| Page: 1 2 3 4 5 6 7 8 9 |
| Pathway ID | Tissue | Disease Stage | Description | Gene Ratio | Bg Ratio | pvalue | p.adjust | qvalue | Count |
| hsa00030 | Liver | Cirrhotic | Pentose phosphate pathway | 16/2530 | 30/8465 | 6.04e-03 | 2.12e-02 | 1.30e-02 | 16 |
| hsa000301 | Liver | Cirrhotic | Pentose phosphate pathway | 16/2530 | 30/8465 | 6.04e-03 | 2.12e-02 | 1.30e-02 | 16 |
| hsa000302 | Liver | HCC | Pentose phosphate pathway | 21/4020 | 30/8465 | 1.06e-02 | 2.71e-02 | 1.51e-02 | 21 |
| hsa000303 | Liver | HCC | Pentose phosphate pathway | 21/4020 | 30/8465 | 1.06e-02 | 2.71e-02 | 1.51e-02 | 21 |
| Page: 1 |
Top |
Cell-cell communication analysis |
| Identification of potential cell-cell interactions between two cell types and their ligand-receptor pairs for different disease states |
| Ligand | Receptor | LRpair | Pathway | Tissue | Disease Stage |
| Page: 1 |
Top |
Single-cell gene regulatory network inference analysis |
| Find out the significant the regulons (TFs) and the target genes of each regulon across cell types for different disease states |
| TF | Cell Type | Tissue | Disease Stage | Target Gene | RSS | Regulon Activity |
| ∗The dot plots of a searched regulon are shown for all cell subpopulations in each disease state of each tissue based on the regulon specific score inferred using pySCENIC and by calculating the average expression. |
| Page: 1 |
Top |
Somatic mutation of malignant transformation related genes |
| Annotation of somatic variants for genes involved in malignant transformation |
| Hugo Symbol | Variant Class | Variant Classification | dbSNP RS | HGVSc | HGVSp | HGVSp Short | SWISSPROT | BIOTYPE | SIFT | PolyPhen | Tumor Sample Barcode | Tissue | Histology | Sex | Age | Stage | Therapy Types | Drugs | Outcome |
| DERA | SNV | Missense_Mutation | rs775272940 | c.416N>A | p.Arg139Gln | p.R139Q | Q9Y315 | protein_coding | deleterious(0) | probably_damaging(0.915) | TCGA-2W-A8YY-01 | Cervix | cervical & endocervical cancer | Female | <65 | I/II | Chemotherapy | cisplatin | CR |
| DERA | SNV | Missense_Mutation | rs778363116 | c.536G>A | p.Arg179His | p.R179H | Q9Y315 | protein_coding | deleterious(0) | probably_damaging(0.975) | TCGA-A6-5667-01 | Colorectum | colon adenocarcinoma | Female | <65 | III/IV | Chemotherapy | oxaliplatin | SD |
| DERA | SNV | Missense_Mutation | rs760703237 | c.712N>T | p.Arg238Trp | p.R238W | Q9Y315 | protein_coding | deleterious(0.01) | probably_damaging(1) | TCGA-AA-3877-01 | Colorectum | colon adenocarcinoma | Female | >=65 | I/II | Unknown | Unknown | SD |
| DERA | SNV | Missense_Mutation | c.634G>A | p.Ala212Thr | p.A212T | Q9Y315 | protein_coding | deleterious(0) | probably_damaging(0.997) | TCGA-CM-5861-01 | Colorectum | colon adenocarcinoma | Female | <65 | I/II | Unknown | Unknown | PD | |
| DERA | SNV | Missense_Mutation | c.766G>A | p.Ala256Thr | p.A256T | Q9Y315 | protein_coding | deleterious(0) | probably_damaging(0.993) | TCGA-CM-6674-01 | Colorectum | colon adenocarcinoma | Male | <65 | I/II | Unknown | Unknown | SD | |
| DERA | SNV | Missense_Mutation | c.860N>A | p.Arg287Gln | p.R287Q | Q9Y315 | protein_coding | deleterious(0) | probably_damaging(1) | TCGA-AG-A002-01 | Colorectum | rectum adenocarcinoma | Male | <65 | I/II | Unknown | Unknown | SD | |
| DERA | SNV | Missense_Mutation | c.860G>A | p.Arg287Gln | p.R287Q | Q9Y315 | protein_coding | deleterious(0) | probably_damaging(1) | TCGA-EI-6917-01 | Colorectum | rectum adenocarcinoma | Male | <65 | III/IV | Chemotherapy | 5fluorouracil+oxaciplatina+l-folinian | SD | |
| DERA | SNV | Missense_Mutation | novel | c.893N>G | p.Glu298Gly | p.E298G | Q9Y315 | protein_coding | deleterious(0) | probably_damaging(1) | TCGA-F5-6814-01 | Colorectum | rectum adenocarcinoma | Male | <65 | I/II | Unknown | Unknown | SD |
| DERA | SNV | Missense_Mutation | c.457G>A | p.Glu153Lys | p.E153K | Q9Y315 | protein_coding | deleterious(0) | probably_damaging(0.999) | TCGA-A5-A0G2-01 | Endometrium | uterine corpus endometrioid carcinoma | Female | <65 | III/IV | Unknown | Unknown | SD | |
| DERA | SNV | Missense_Mutation | novel | c.292G>A | p.Ala98Thr | p.A98T | Q9Y315 | protein_coding | deleterious(0) | probably_damaging(0.999) | TCGA-A5-A1OF-01 | Endometrium | uterine corpus endometrioid carcinoma | Female | <65 | I/II | Unknown | Unknown | SD |
| Page: 1 2 3 4 |
Top |
Related drugs of malignant transformation related genes |
| Identification of chemicals and drugs interact with genes involved in malignant transfromation |
| (DGIdb 4.0) |
| Entrez ID | Symbol | Category | Interaction Types | Drug Claim Name | Drug Name | PMIDs |
| Page: 1 |

Copyright 2023-Present -The University of Texas Health Science Center at Houston |