
|
|||||
|
 | |
| |
| |
| |
| |
| |
|
Gene: DEPTOR |
Gene summary for DEPTOR |
| Gene information | Species | Human | Gene symbol | DEPTOR | Gene ID | 64798 |
| Gene name | DEP domain containing MTOR interacting protein | |
| Gene Alias | DEP.6 | |
| Cytomap | 8q24.12 | |
| Gene Type | protein-coding | GO ID | GO:0001932 | UniProtAcc | Q8TB45 |
Top |
Malignant transformation analysis |
| Identification of the aberrant gene expression in precancerous and cancerous lesions by comparing the gene expression of stem-like cells in diseased tissues with normal stem cells |
| Entrez ID | Symbol | Replicates | Species | Organ | Tissue | Adj P-value | Log2FC | Malignancy |
| 64798 | DEPTOR | AEH-subject1 | Human | Endometrium | AEH | 2.51e-03 | 2.35e-01 | -0.3059 |
| 64798 | DEPTOR | AEH-subject2 | Human | Endometrium | AEH | 2.26e-06 | 3.30e-01 | -0.2525 |
| 64798 | DEPTOR | AEH-subject4 | Human | Endometrium | AEH | 1.86e-03 | 3.09e-01 | -0.2657 |
| 64798 | DEPTOR | EEC-subject2 | Human | Endometrium | EEC | 4.12e-13 | 4.84e-01 | -0.2607 |
| 64798 | DEPTOR | EEC-subject3 | Human | Endometrium | EEC | 3.58e-04 | -9.56e-03 | -0.2525 |
| 64798 | DEPTOR | EEC-subject4 | Human | Endometrium | EEC | 4.44e-18 | 5.91e-01 | -0.2571 |
| 64798 | DEPTOR | EEC-subject5 | Human | Endometrium | EEC | 3.75e-10 | 4.06e-01 | -0.249 |
| 64798 | DEPTOR | GSM5276934 | Human | Endometrium | EEC | 5.95e-04 | -1.43e-01 | -0.0913 |
| 64798 | DEPTOR | GSM5276935 | Human | Endometrium | EEC | 3.00e-06 | 2.80e-01 | -0.123 |
| 64798 | DEPTOR | GSM6177620_NYU_UCEC1_lib3_lib3 | Human | Endometrium | EEC | 3.29e-03 | 4.58e-02 | -0.1883 |
| 64798 | DEPTOR | GSM6177621_NYU_UCEC2_lib1_lib1 | Human | Endometrium | EEC | 2.62e-03 | 1.67e-01 | -0.1934 |
| 64798 | DEPTOR | GSM6177622_NYU_UCEC3_lib1_lib1 | Human | Endometrium | EEC | 1.91e-11 | 2.12e-01 | -0.1917 |
| 64798 | DEPTOR | GSM6177622_NYU_UCEC3_lib2_lib2 | Human | Endometrium | EEC | 1.14e-04 | 1.61e-01 | -0.1916 |
| 64798 | DEPTOR | HCC1_Meng | Human | Liver | HCC | 1.12e-46 | 1.32e-01 | 0.0246 |
| 64798 | DEPTOR | HCC2_Meng | Human | Liver | HCC | 5.23e-13 | 1.21e-01 | 0.0107 |
| 64798 | DEPTOR | S014 | Human | Liver | HCC | 1.84e-15 | 7.00e-01 | 0.2254 |
| 64798 | DEPTOR | S015 | Human | Liver | HCC | 1.89e-14 | 7.80e-01 | 0.2375 |
| 64798 | DEPTOR | S016 | Human | Liver | HCC | 7.21e-20 | 6.80e-01 | 0.2243 |
| 64798 | DEPTOR | HTA12-25-1 | Human | Pancreas | PDAC | 3.63e-06 | 6.05e-01 | 0.313 |
| 64798 | DEPTOR | HTA12-26-1 | Human | Pancreas | PDAC | 3.25e-13 | 6.86e-01 | 0.3728 |
| Page: 1 2 |
| Tissue | Expression Dynamics | Abbreviation |
| Endometrium |  | AEH: Atypical endometrial hyperplasia |
| EEC: Endometrioid Cancer | ||
| Liver |  | HCC: Hepatocellular carcinoma |
| NAFLD: Non-alcoholic fatty liver disease | ||
| Thyroid | 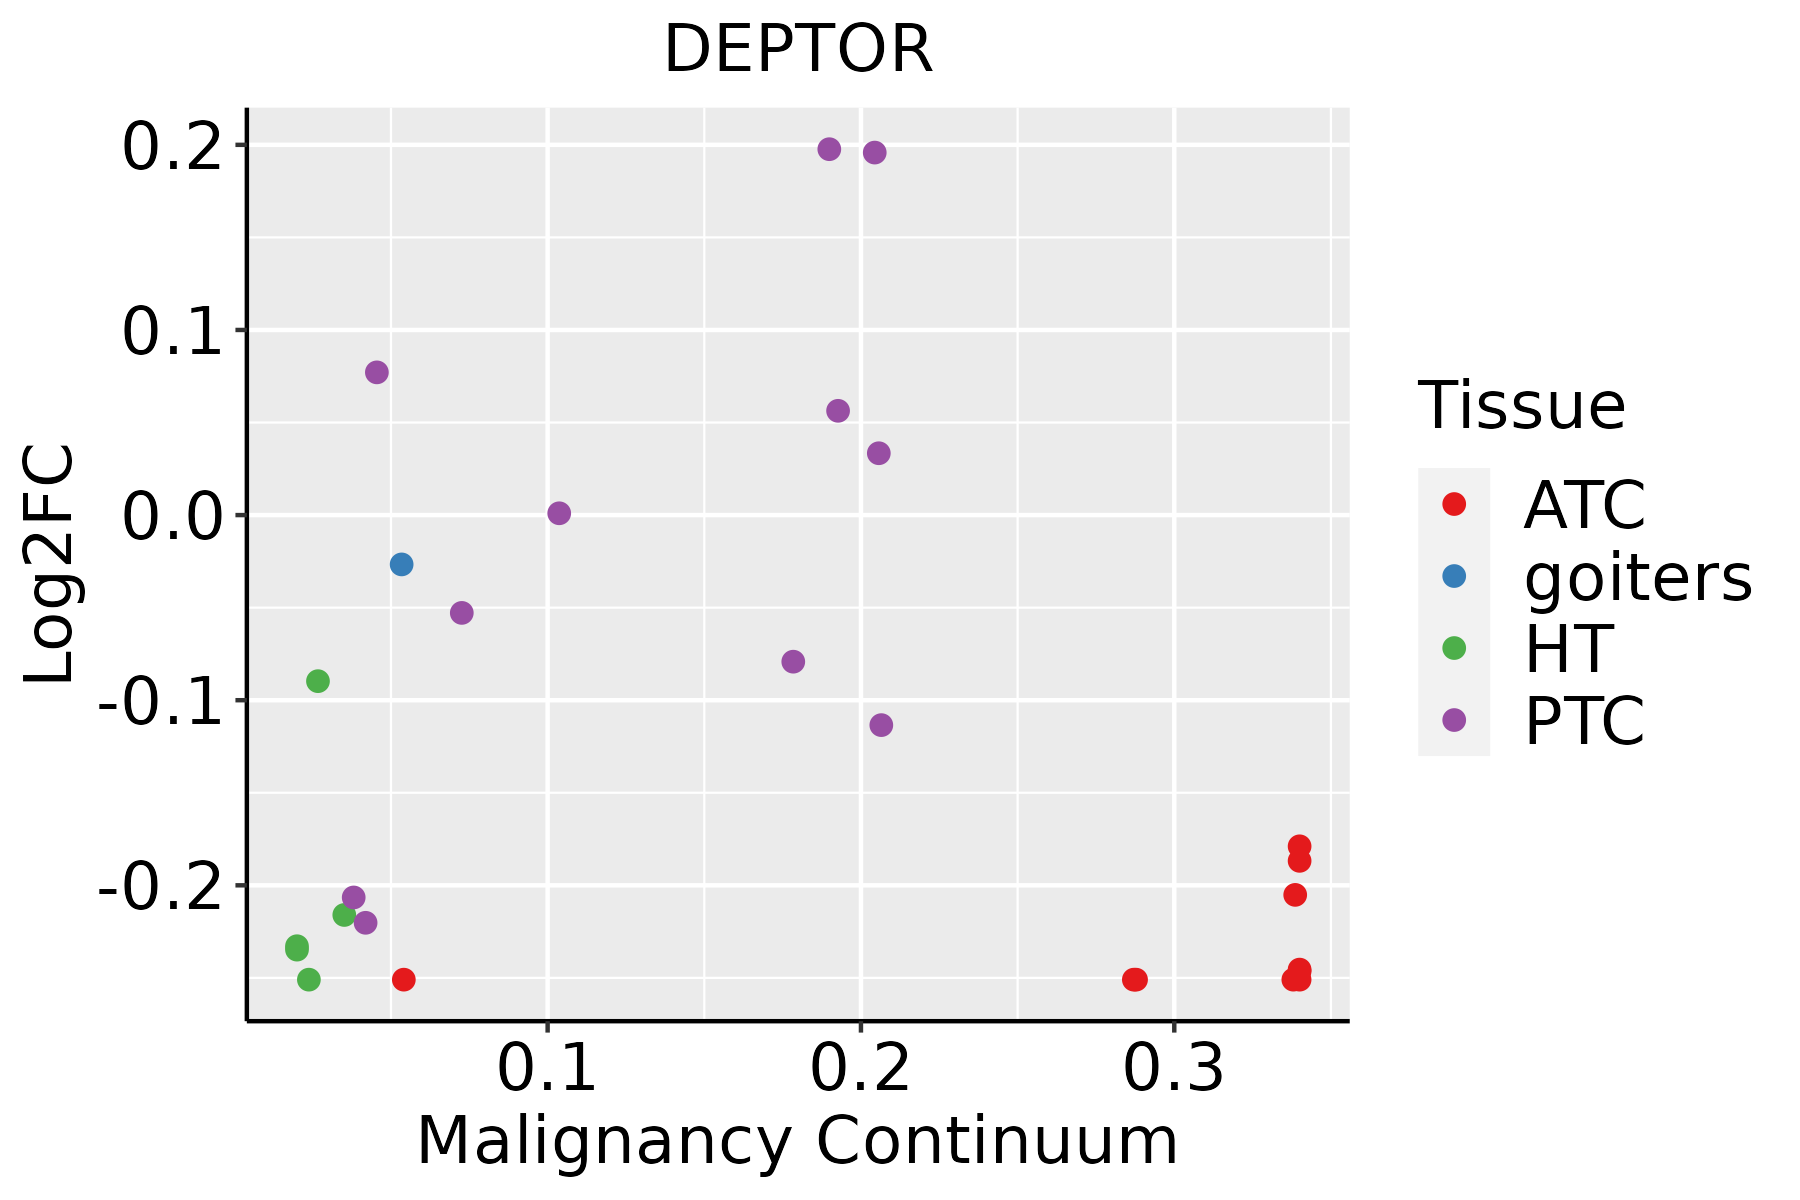 | ATC: Anaplastic thyroid cancer |
| HT: Hashimoto's thyroiditis | ||
| PTC: Papillary thyroid cancer |
| ∗log2FC in expression of this searched gene in stem-like cells from each diseased tissue sample relative to stem-like cells in normal samples in each tissue plotted against the malignancy continuum. Samples are colored based on if they are from different disease stage. |
Top |
Malignant transformation related pathway analysis |
| Find out the enriched GO biological processes and KEGG pathways involved in transition from healthy to precancer to cancer |
| Tissue | Disease Stage | Enriched GO biological Processes |
| Colorectum | AD |  |
| Colorectum | SER |  |
| Colorectum | MSS |  |
| Colorectum | MSI-H |  |
| Colorectum | FAP |  |
| ∗Top 15 enriched GO BP terms are showed in the bar plot of each disease state in each tissue. Each row represents a significant GO biological process which is colored according to the -log10(p.adjust). |
| Page: 1 2 3 4 5 6 7 8 9 |
| GO ID | Tissue | Disease Stage | Description | Gene Ratio | Bg Ratio | pvalue | p.adjust | Count |
| GO:200123316 | Endometrium | AEH | regulation of apoptotic signaling pathway | 86/2100 | 356/18723 | 2.97e-12 | 4.95e-10 | 86 |
| GO:003253510 | Endometrium | AEH | regulation of cellular component size | 78/2100 | 383/18723 | 1.10e-07 | 5.29e-06 | 78 |
| GO:009719116 | Endometrium | AEH | extrinsic apoptotic signaling pathway | 49/2100 | 219/18723 | 1.58e-06 | 4.94e-05 | 49 |
| GO:200123616 | Endometrium | AEH | regulation of extrinsic apoptotic signaling pathway | 37/2100 | 151/18723 | 3.17e-06 | 8.69e-05 | 37 |
| GO:004593616 | Endometrium | AEH | negative regulation of phosphate metabolic process | 77/2100 | 441/18723 | 5.13e-05 | 8.25e-04 | 77 |
| GO:001056316 | Endometrium | AEH | negative regulation of phosphorus metabolic process | 77/2100 | 442/18723 | 5.54e-05 | 8.79e-04 | 77 |
| GO:00083616 | Endometrium | AEH | regulation of cell size | 38/2100 | 181/18723 | 9.69e-05 | 1.40e-03 | 38 |
| GO:005134816 | Endometrium | AEH | negative regulation of transferase activity | 51/2100 | 268/18723 | 1.06e-04 | 1.52e-03 | 51 |
| GO:000193315 | Endometrium | AEH | negative regulation of protein phosphorylation | 60/2100 | 342/18723 | 2.89e-04 | 3.31e-03 | 60 |
| GO:004232615 | Endometrium | AEH | negative regulation of phosphorylation | 65/2100 | 385/18723 | 4.93e-04 | 5.06e-03 | 65 |
| GO:003367310 | Endometrium | AEH | negative regulation of kinase activity | 40/2100 | 237/18723 | 5.47e-03 | 3.38e-02 | 40 |
| GO:000646915 | Endometrium | AEH | negative regulation of protein kinase activity | 36/2100 | 212/18723 | 7.35e-03 | 4.18e-02 | 36 |
| GO:200123317 | Endometrium | EEC | regulation of apoptotic signaling pathway | 91/2168 | 356/18723 | 1.31e-13 | 3.28e-11 | 91 |
| GO:003253516 | Endometrium | EEC | regulation of cellular component size | 79/2168 | 383/18723 | 1.98e-07 | 8.93e-06 | 79 |
| GO:009719117 | Endometrium | EEC | extrinsic apoptotic signaling pathway | 52/2168 | 219/18723 | 2.91e-07 | 1.20e-05 | 52 |
| GO:200123617 | Endometrium | EEC | regulation of extrinsic apoptotic signaling pathway | 40/2168 | 151/18723 | 3.33e-07 | 1.33e-05 | 40 |
| GO:000836111 | Endometrium | EEC | regulation of cell size | 39/2168 | 181/18723 | 8.72e-05 | 1.24e-03 | 39 |
| GO:005134817 | Endometrium | EEC | negative regulation of transferase activity | 52/2168 | 268/18723 | 1.23e-04 | 1.64e-03 | 52 |
| GO:004593617 | Endometrium | EEC | negative regulation of phosphate metabolic process | 77/2168 | 441/18723 | 1.45e-04 | 1.87e-03 | 77 |
| GO:001056317 | Endometrium | EEC | negative regulation of phosphorus metabolic process | 77/2168 | 442/18723 | 1.56e-04 | 1.97e-03 | 77 |
| Page: 1 2 3 4 |
| Pathway ID | Tissue | Disease Stage | Description | Gene Ratio | Bg Ratio | pvalue | p.adjust | qvalue | Count |
| hsa0414021 | Liver | HCC | Autophagy - animal | 99/4020 | 141/8465 | 3.08e-08 | 4.70e-07 | 2.61e-07 | 99 |
| hsa041502 | Liver | HCC | mTOR signaling pathway | 95/4020 | 156/8465 | 4.70e-04 | 1.99e-03 | 1.11e-03 | 95 |
| hsa0414031 | Liver | HCC | Autophagy - animal | 99/4020 | 141/8465 | 3.08e-08 | 4.70e-07 | 2.61e-07 | 99 |
| hsa0415011 | Liver | HCC | mTOR signaling pathway | 95/4020 | 156/8465 | 4.70e-04 | 1.99e-03 | 1.11e-03 | 95 |
| Page: 1 |
Top |
Cell-cell communication analysis |
| Identification of potential cell-cell interactions between two cell types and their ligand-receptor pairs for different disease states |
| Ligand | Receptor | LRpair | Pathway | Tissue | Disease Stage |
| Page: 1 |
Top |
Single-cell gene regulatory network inference analysis |
| Find out the significant the regulons (TFs) and the target genes of each regulon across cell types for different disease states |
| TF | Cell Type | Tissue | Disease Stage | Target Gene | RSS | Regulon Activity |
| ∗The dot plots of a searched regulon are shown for all cell subpopulations in each disease state of each tissue based on the regulon specific score inferred using pySCENIC and by calculating the average expression. |
| Page: 1 |
Top |
Somatic mutation of malignant transformation related genes |
| Annotation of somatic variants for genes involved in malignant transformation |
| Hugo Symbol | Variant Class | Variant Classification | dbSNP RS | HGVSc | HGVSp | HGVSp Short | SWISSPROT | BIOTYPE | SIFT | PolyPhen | Tumor Sample Barcode | Tissue | Histology | Sex | Age | Stage | Therapy Types | Drugs | Outcome |
| DEPTOR | SNV | Missense_Mutation | c.485N>C | p.Glu162Ala | p.E162A | Q8TB45 | protein_coding | tolerated(0.29) | benign(0.068) | TCGA-A8-A09Z-01 | Breast | breast invasive carcinoma | Female | >=65 | I/II | Unknown | Unknown | SD | |
| DEPTOR | insertion | Nonsense_Mutation | novel | c.658_659insTTTCAAAATAAGAAGTTATTTTGGTTTTTTCTGAG | p.Asn220IlefsTer4 | p.N220Ifs*4 | Q8TB45 | protein_coding | TCGA-A2-A0CP-01 | Breast | breast invasive carcinoma | Female | <65 | I/II | Chemotherapy | cytoxan | SD | ||
| DEPTOR | insertion | Nonsense_Mutation | novel | c.953_954insACTATGTTGAGTACTCAGAAAAGTTCACTAGCATTATT | p.Leu320CysfsTer2 | p.L320Cfs*2 | Q8TB45 | protein_coding | TCGA-AN-A0FN-01 | Breast | breast invasive carcinoma | Female | <65 | I/II | Unknown | Unknown | SD | ||
| DEPTOR | SNV | Missense_Mutation | rs149224142 | c.196N>A | p.Ala66Thr | p.A66T | Q8TB45 | protein_coding | deleterious(0) | probably_damaging(0.953) | TCGA-VS-A94Z-01 | Cervix | cervical & endocervical cancer | Female | <65 | I/II | Chemotherapy | cisplatin | CR |
| DEPTOR | SNV | Missense_Mutation | c.987N>T | p.Lys329Asn | p.K329N | Q8TB45 | protein_coding | deleterious(0) | probably_damaging(0.96) | TCGA-AA-3984-01 | Colorectum | colon adenocarcinoma | Female | <65 | I/II | Unknown | Unknown | SD | |
| DEPTOR | SNV | Missense_Mutation | c.393N>T | p.Lys131Asn | p.K131N | Q8TB45 | protein_coding | deleterious(0.04) | possibly_damaging(0.567) | TCGA-CM-6674-01 | Colorectum | colon adenocarcinoma | Male | <65 | I/II | Unknown | Unknown | SD | |
| DEPTOR | SNV | Missense_Mutation | rs147092773 | c.974N>T | p.Pro325Leu | p.P325L | Q8TB45 | protein_coding | deleterious(0) | possibly_damaging(0.746) | TCGA-G4-6309-01 | Colorectum | colon adenocarcinoma | Female | <65 | III/IV | Chemotherapy | xeloda | PD |
| DEPTOR | SNV | Missense_Mutation | novel | c.794G>A | p.Ser265Asn | p.S265N | Q8TB45 | protein_coding | tolerated(0.25) | benign(0.15) | TCGA-EI-6917-01 | Colorectum | rectum adenocarcinoma | Male | <65 | III/IV | Chemotherapy | 5fluorouracil+oxaciplatina+l-folinian | SD |
| DEPTOR | SNV | Missense_Mutation | novel | c.170N>C | p.Leu57Pro | p.L57P | Q8TB45 | protein_coding | deleterious(0) | probably_damaging(0.999) | TCGA-F5-6814-01 | Colorectum | rectum adenocarcinoma | Male | <65 | I/II | Unknown | Unknown | SD |
| DEPTOR | deletion | Frame_Shift_Del | c.897delN | p.Pro301LeufsTer10 | p.P301Lfs*10 | Q8TB45 | protein_coding | TCGA-CK-4951-01 | Colorectum | colon adenocarcinoma | Female | >=65 | I/II | Unknown | Unknown | PD |
| Page: 1 2 3 4 5 6 |
Top |
Related drugs of malignant transformation related genes |
| Identification of chemicals and drugs interact with genes involved in malignant transfromation |
| (DGIdb 4.0) |
| Entrez ID | Symbol | Category | Interaction Types | Drug Claim Name | Drug Name | PMIDs |
| 64798 | DEPTOR | KINASE | inhibitor | OSI-027 | OSI-027 | |
| 64798 | DEPTOR | KINASE | inhibitor | AZD8055 | AZD-8055 | |
| 64798 | DEPTOR | KINASE | inhibitor | MLN0128 | SAPANISERTIB |
| Page: 1 |

Copyright 2023-Present -The University of Texas Health Science Center at Houston |