
|
|||||
|
 | |
| |
| |
| |
| |
| |
|
Gene: DEPP1 |
Gene summary for DEPP1 |
| Gene information | Species | Human | Gene symbol | DEPP1 | Gene ID | 11067 |
| Gene name | DEPP1 autophagy regulator | |
| Gene Alias | C10orf10 | |
| Cytomap | 10q11.21 | |
| Gene Type | protein-coding | GO ID | GO:0006914 | UniProtAcc | Q9NTK1 |
Top |
Malignant transformation analysis |
| Identification of the aberrant gene expression in precancerous and cancerous lesions by comparing the gene expression of stem-like cells in diseased tissues with normal stem cells |
| Entrez ID | Symbol | Replicates | Species | Organ | Tissue | Adj P-value | Log2FC | Malignancy |
| 11067 | DEPP1 | GSM4909282 | Human | Breast | IDC | 1.38e-15 | 4.80e-01 | -0.0288 |
| 11067 | DEPP1 | GSM4909287 | Human | Breast | IDC | 1.26e-05 | 3.74e-01 | 0.2057 |
| 11067 | DEPP1 | GSM4909299 | Human | Breast | IDC | 9.95e-06 | 3.25e-01 | 0.035 |
| 11067 | DEPP1 | GSM4909300 | Human | Breast | IDC | 5.67e-05 | 4.91e-01 | 0.0334 |
| 11067 | DEPP1 | GSM4909305 | Human | Breast | IDC | 8.46e-08 | 4.51e-01 | 0.0436 |
| 11067 | DEPP1 | GSM4909309 | Human | Breast | IDC | 7.72e-15 | 6.48e-01 | 0.0483 |
| 11067 | DEPP1 | GSM4909313 | Human | Breast | IDC | 3.94e-10 | 5.63e-01 | 0.0391 |
| 11067 | DEPP1 | brca1 | Human | Breast | Precancer | 1.48e-02 | -1.23e-01 | -0.0338 |
| 11067 | DEPP1 | DCIS2 | Human | Breast | DCIS | 1.54e-29 | 3.18e-01 | 0.0085 |
| 11067 | DEPP1 | S014 | Human | Liver | HCC | 2.61e-06 | 5.75e-01 | 0.2254 |
| 11067 | DEPP1 | S015 | Human | Liver | HCC | 2.00e-04 | 7.18e-01 | 0.2375 |
| 11067 | DEPP1 | S027 | Human | Liver | HCC | 5.45e-14 | 1.13e+00 | 0.2446 |
| 11067 | DEPP1 | S028 | Human | Liver | HCC | 3.18e-22 | 9.24e-01 | 0.2503 |
| 11067 | DEPP1 | S029 | Human | Liver | HCC | 3.66e-26 | 1.60e+00 | 0.2581 |
| 11067 | DEPP1 | RNA-P3T-P3T-1 | Human | Lung | IAC | 8.87e-03 | 3.55e-01 | 0.1829 |
| 11067 | DEPP1 | RNA-P3T-P3T-2 | Human | Lung | IAC | 2.75e-06 | 5.17e-01 | 0.1835 |
| 11067 | DEPP1 | RNA-P3T-P3T-4 | Human | Lung | IAC | 8.54e-11 | 6.80e-01 | 0.1859 |
| 11067 | DEPP1 | PTC01 | Human | Thyroid | PTC | 5.67e-05 | 1.71e-01 | 0.1899 |
| 11067 | DEPP1 | PTC03 | Human | Thyroid | PTC | 3.54e-03 | 1.06e+00 | 0.1784 |
| 11067 | DEPP1 | PTC05 | Human | Thyroid | PTC | 1.02e-17 | 8.03e-01 | 0.2065 |
| Page: 1 2 |
| Tissue | Expression Dynamics | Abbreviation |
| Breast | 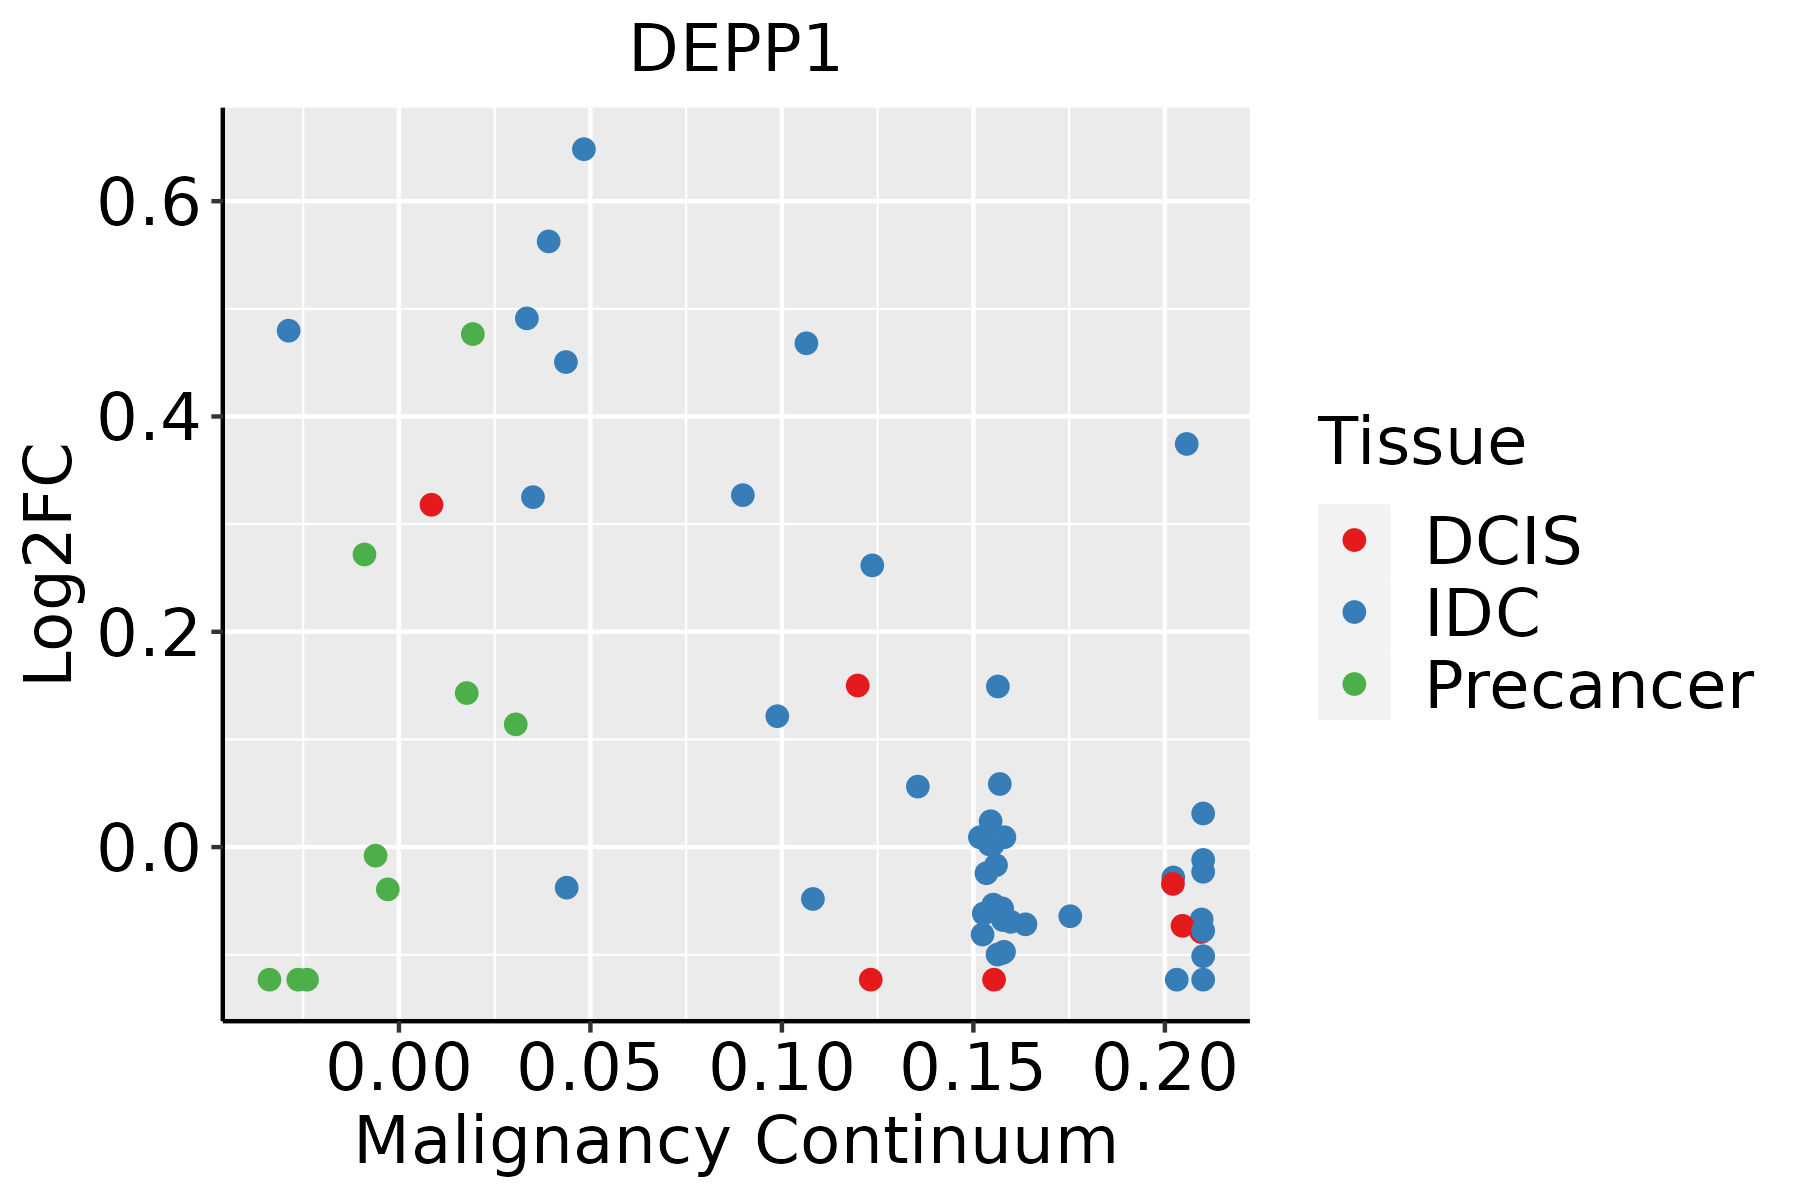 | IDC: Invasive ductal carcinoma |
| DCIS: Ductal carcinoma in situ | ||
| Precancer(BRCA1-mut): Precancerous lesion from BRCA1 mutation carriers | ||
| Liver | 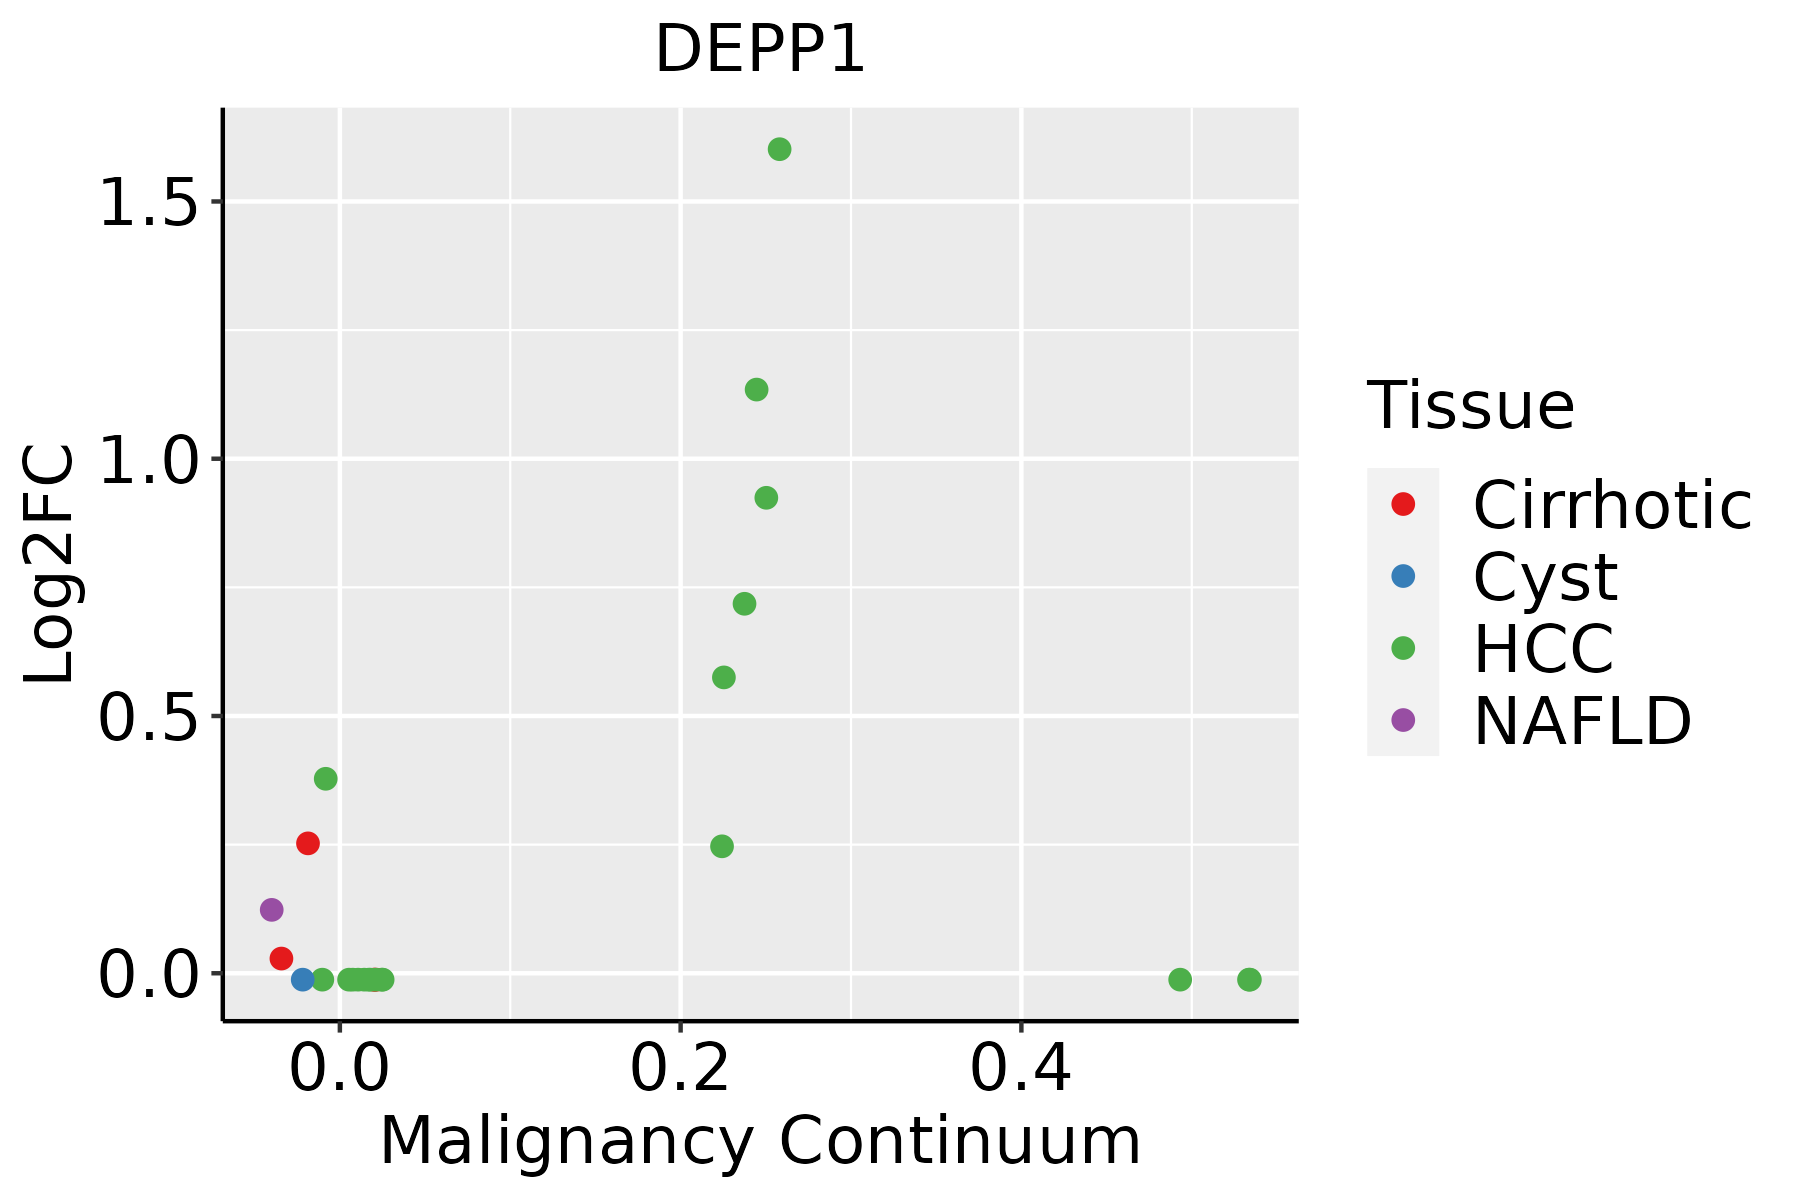 | HCC: Hepatocellular carcinoma |
| NAFLD: Non-alcoholic fatty liver disease | ||
| Lung | 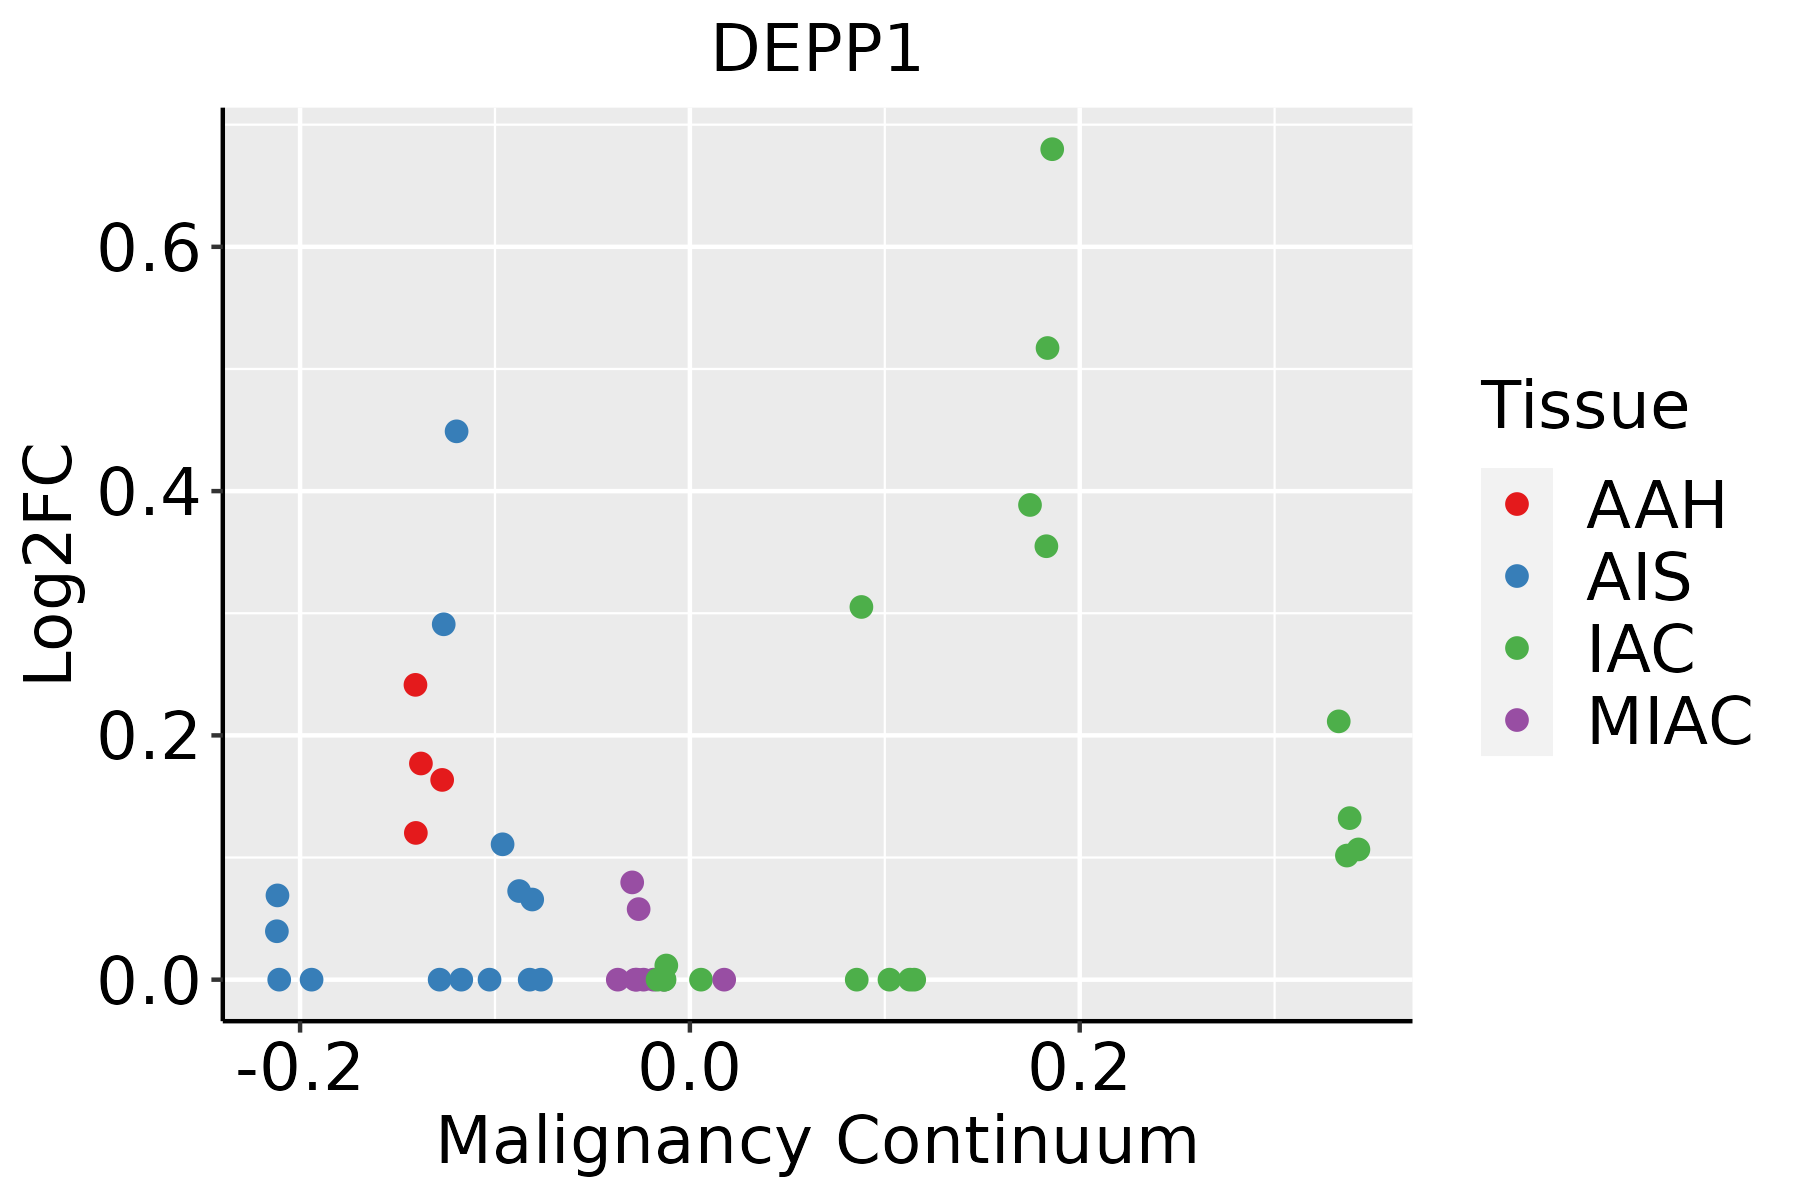 | AAH: Atypical adenomatous hyperplasia |
| AIS: Adenocarcinoma in situ | ||
| IAC: Invasive lung adenocarcinoma | ||
| MIA: Minimally invasive adenocarcinoma | ||
| Thyroid | 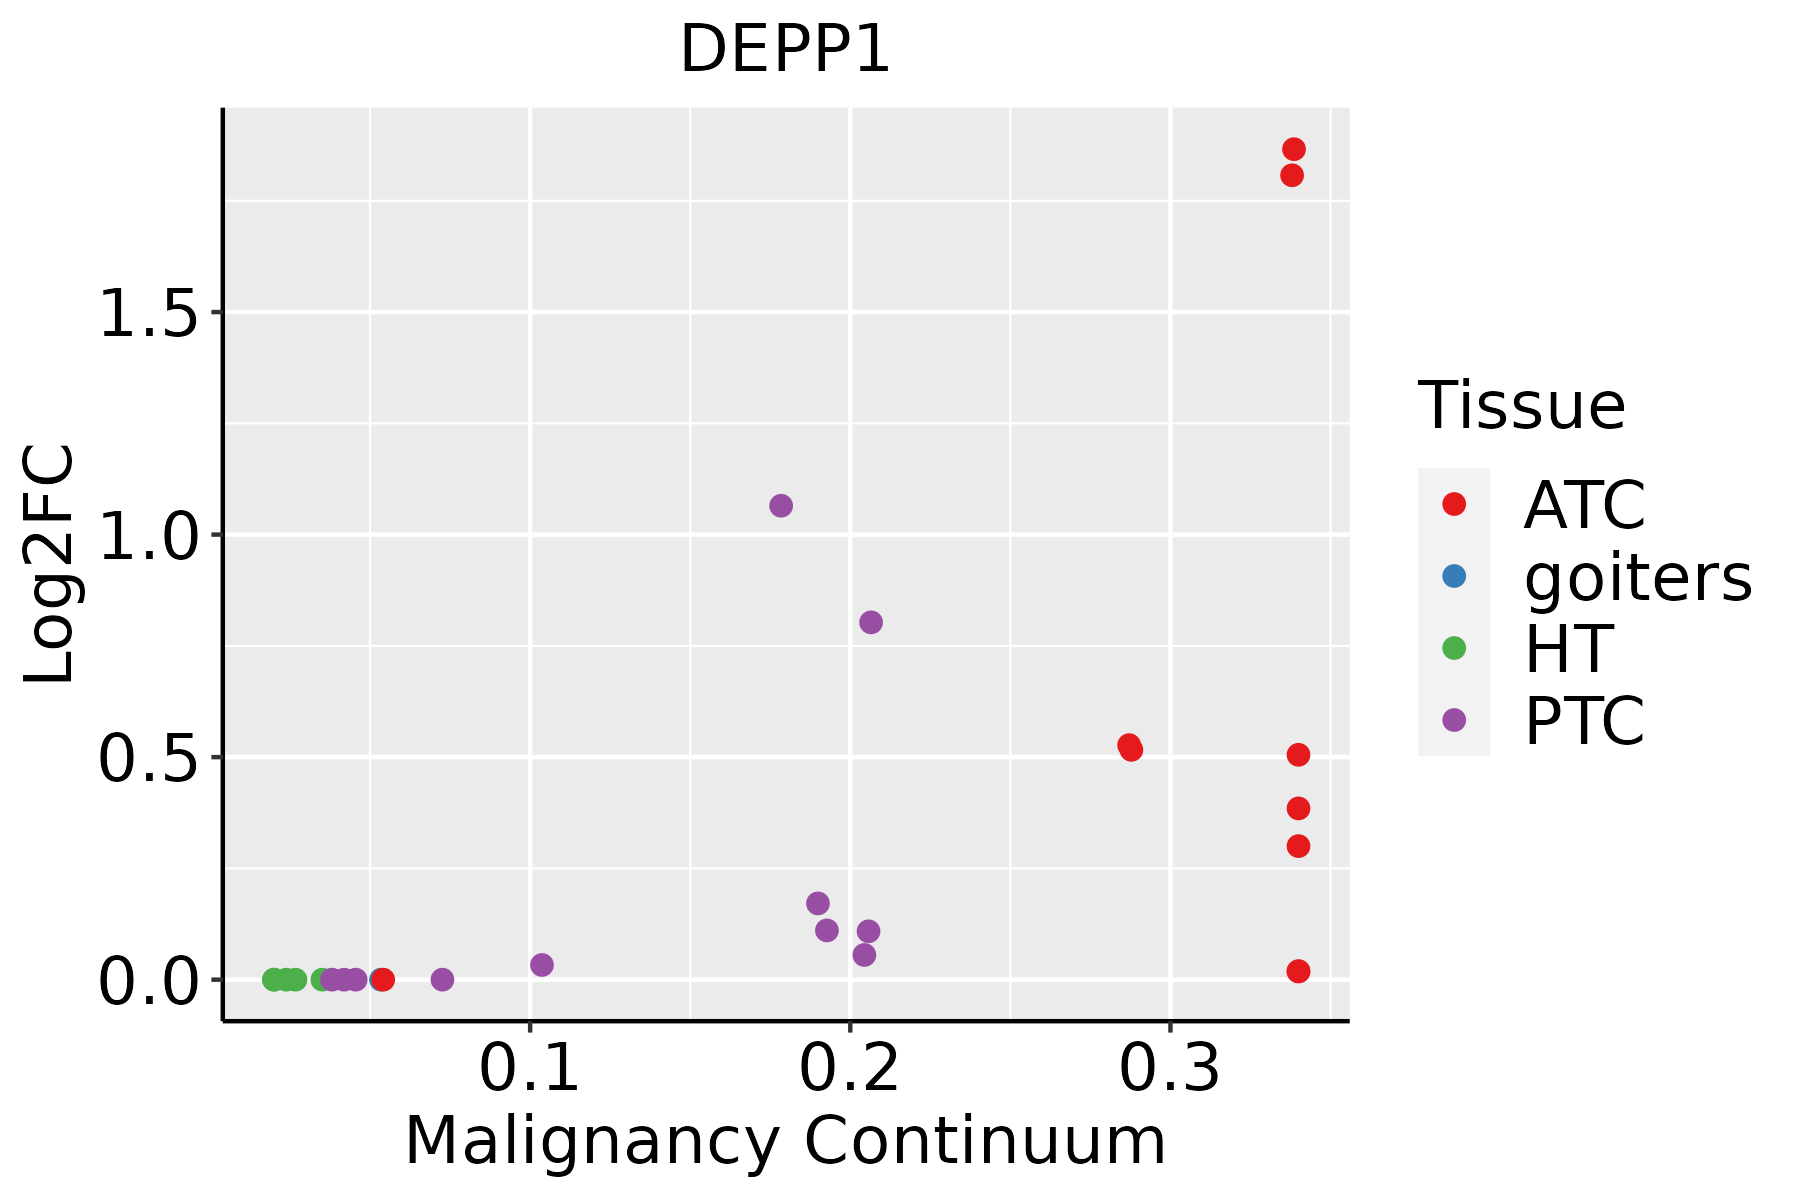 | ATC: Anaplastic thyroid cancer |
| HT: Hashimoto's thyroiditis | ||
| PTC: Papillary thyroid cancer |
| ∗log2FC in expression of this searched gene in stem-like cells from each diseased tissue sample relative to stem-like cells in normal samples in each tissue plotted against the malignancy continuum. Samples are colored based on if they are from different disease stage. |
Top |
Malignant transformation related pathway analysis |
| Find out the enriched GO biological processes and KEGG pathways involved in transition from healthy to precancer to cancer |
| Tissue | Disease Stage | Enriched GO biological Processes |
| Colorectum | AD |  |
| Colorectum | SER |  |
| Colorectum | MSS |  |
| Colorectum | MSI-H |  |
| Colorectum | FAP |  |
| ∗Top 15 enriched GO BP terms are showed in the bar plot of each disease state in each tissue. Each row represents a significant GO biological process which is colored according to the -log10(p.adjust). |
| Page: 1 2 3 4 5 6 7 8 9 |
| GO ID | Tissue | Disease Stage | Description | Gene Ratio | Bg Ratio | pvalue | p.adjust | Count |
| GO:001050621 | Liver | HCC | regulation of autophagy | 210/7958 | 317/18723 | 7.59e-18 | 8.45e-16 | 210 |
| GO:00105066 | Lung | IAC | regulation of autophagy | 65/2061 | 317/18723 | 4.97e-07 | 3.14e-05 | 65 |
| GO:0010506110 | Thyroid | PTC | regulation of autophagy | 172/5968 | 317/18723 | 8.76e-17 | 7.57e-15 | 172 |
| GO:001050632 | Thyroid | ATC | regulation of autophagy | 180/6293 | 317/18723 | 1.34e-17 | 1.46e-15 | 180 |
| Page: 1 |
| Pathway ID | Tissue | Disease Stage | Description | Gene Ratio | Bg Ratio | pvalue | p.adjust | qvalue | Count |
| Page: 1 |
Top |
Cell-cell communication analysis |
| Identification of potential cell-cell interactions between two cell types and their ligand-receptor pairs for different disease states |
| Ligand | Receptor | LRpair | Pathway | Tissue | Disease Stage |
| Page: 1 |
Top |
Single-cell gene regulatory network inference analysis |
| Find out the significant the regulons (TFs) and the target genes of each regulon across cell types for different disease states |
| TF | Cell Type | Tissue | Disease Stage | Target Gene | RSS | Regulon Activity |
| ∗The dot plots of a searched regulon are shown for all cell subpopulations in each disease state of each tissue based on the regulon specific score inferred using pySCENIC and by calculating the average expression. |
| Page: 1 |
Top |
Somatic mutation of malignant transformation related genes |
| Annotation of somatic variants for genes involved in malignant transformation |
| Hugo Symbol | Variant Class | Variant Classification | dbSNP RS | HGVSc | HGVSp | HGVSp Short | SWISSPROT | BIOTYPE | SIFT | PolyPhen | Tumor Sample Barcode | Tissue | Histology | Sex | Age | Stage | Therapy Types | Drugs | Outcome |
| Page: 1 |
Top |
Related drugs of malignant transformation related genes |
| Identification of chemicals and drugs interact with genes involved in malignant transfromation |
| (DGIdb 4.0) |
| Entrez ID | Symbol | Category | Interaction Types | Drug Claim Name | Drug Name | PMIDs |
| Page: 1 |

Copyright 2023-Present -The University of Texas Health Science Center at Houston |