
|
|||||
|
 | |
| |
| |
| |
| |
| |
|
Gene: DEPDC1 |
Gene summary for DEPDC1 |
| Gene information | Species | Human | Gene symbol | DEPDC1 | Gene ID | 55635 |
| Gene name | DEP domain containing 1 | |
| Gene Alias | DEP.8 | |
| Cytomap | 1p31.3 | |
| Gene Type | protein-coding | GO ID | GO:0006139 | UniProtAcc | Q5TB30 |
Top |
Malignant transformation analysis |
| Identification of the aberrant gene expression in precancerous and cancerous lesions by comparing the gene expression of stem-like cells in diseased tissues with normal stem cells |
| Entrez ID | Symbol | Replicates | Species | Organ | Tissue | Adj P-value | Log2FC | Malignancy |
| 55635 | DEPDC1 | P2T-E | Human | Esophagus | ESCC | 4.41e-07 | 3.83e-01 | 0.1177 |
| 55635 | DEPDC1 | P4T-E | Human | Esophagus | ESCC | 9.91e-08 | 3.40e-01 | 0.1323 |
| 55635 | DEPDC1 | P5T-E | Human | Esophagus | ESCC | 1.62e-13 | 3.14e-01 | 0.1327 |
| 55635 | DEPDC1 | P9T-E | Human | Esophagus | ESCC | 2.30e-02 | 1.15e-01 | 0.1131 |
| 55635 | DEPDC1 | P10T-E | Human | Esophagus | ESCC | 2.02e-06 | 4.08e-01 | 0.116 |
| 55635 | DEPDC1 | P16T-E | Human | Esophagus | ESCC | 7.90e-03 | 8.43e-02 | 0.1153 |
| 55635 | DEPDC1 | P17T-E | Human | Esophagus | ESCC | 1.49e-02 | 2.38e-01 | 0.1278 |
| 55635 | DEPDC1 | P19T-E | Human | Esophagus | ESCC | 6.53e-04 | 4.05e-01 | 0.1662 |
| 55635 | DEPDC1 | P20T-E | Human | Esophagus | ESCC | 8.24e-04 | 1.65e-01 | 0.1124 |
| 55635 | DEPDC1 | P21T-E | Human | Esophagus | ESCC | 4.30e-10 | 4.91e-01 | 0.1617 |
| 55635 | DEPDC1 | P24T-E | Human | Esophagus | ESCC | 8.40e-04 | 2.20e-01 | 0.1287 |
| 55635 | DEPDC1 | P28T-E | Human | Esophagus | ESCC | 1.88e-11 | 2.27e-01 | 0.1149 |
| 55635 | DEPDC1 | P30T-E | Human | Esophagus | ESCC | 2.13e-03 | 3.19e-01 | 0.137 |
| 55635 | DEPDC1 | P31T-E | Human | Esophagus | ESCC | 1.66e-02 | 1.90e-01 | 0.1251 |
| 55635 | DEPDC1 | P32T-E | Human | Esophagus | ESCC | 9.67e-18 | 6.12e-01 | 0.1666 |
| 55635 | DEPDC1 | P36T-E | Human | Esophagus | ESCC | 7.72e-03 | 1.69e-01 | 0.1187 |
| 55635 | DEPDC1 | P37T-E | Human | Esophagus | ESCC | 1.83e-06 | 3.12e-01 | 0.1371 |
| 55635 | DEPDC1 | P38T-E | Human | Esophagus | ESCC | 1.00e-03 | 2.20e-01 | 0.127 |
| 55635 | DEPDC1 | P49T-E | Human | Esophagus | ESCC | 7.48e-03 | 5.72e-01 | 0.1768 |
| 55635 | DEPDC1 | P52T-E | Human | Esophagus | ESCC | 2.02e-06 | 2.75e-01 | 0.1555 |
| Page: 1 2 |
| Tissue | Expression Dynamics | Abbreviation |
| Esophagus |  | ESCC: Esophageal squamous cell carcinoma |
| HGIN: High-grade intraepithelial neoplasias | ||
| LGIN: Low-grade intraepithelial neoplasias | ||
| Skin | 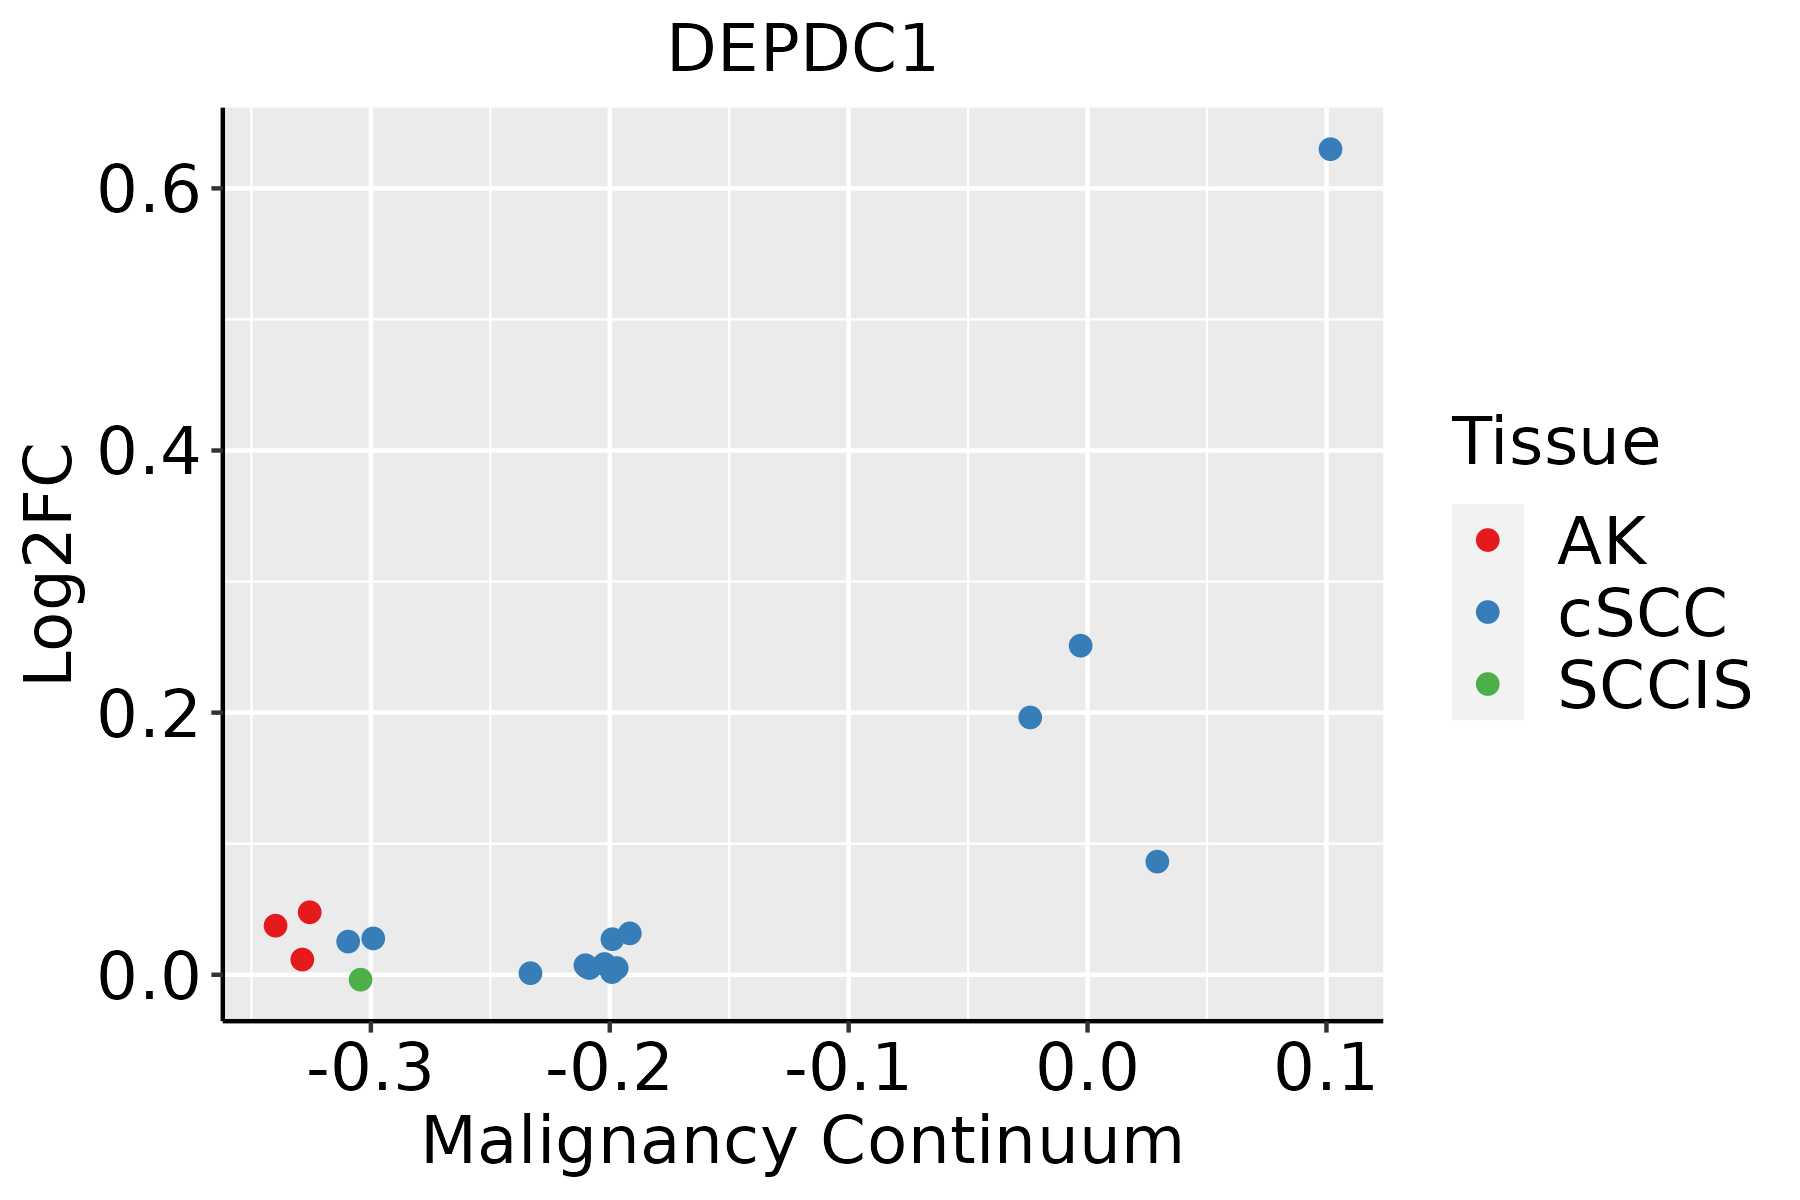 | AK: Actinic keratosis |
| cSCC: Cutaneous squamous cell carcinoma | ||
| SCCIS:squamous cell carcinoma in situ | ||
| Thyroid | 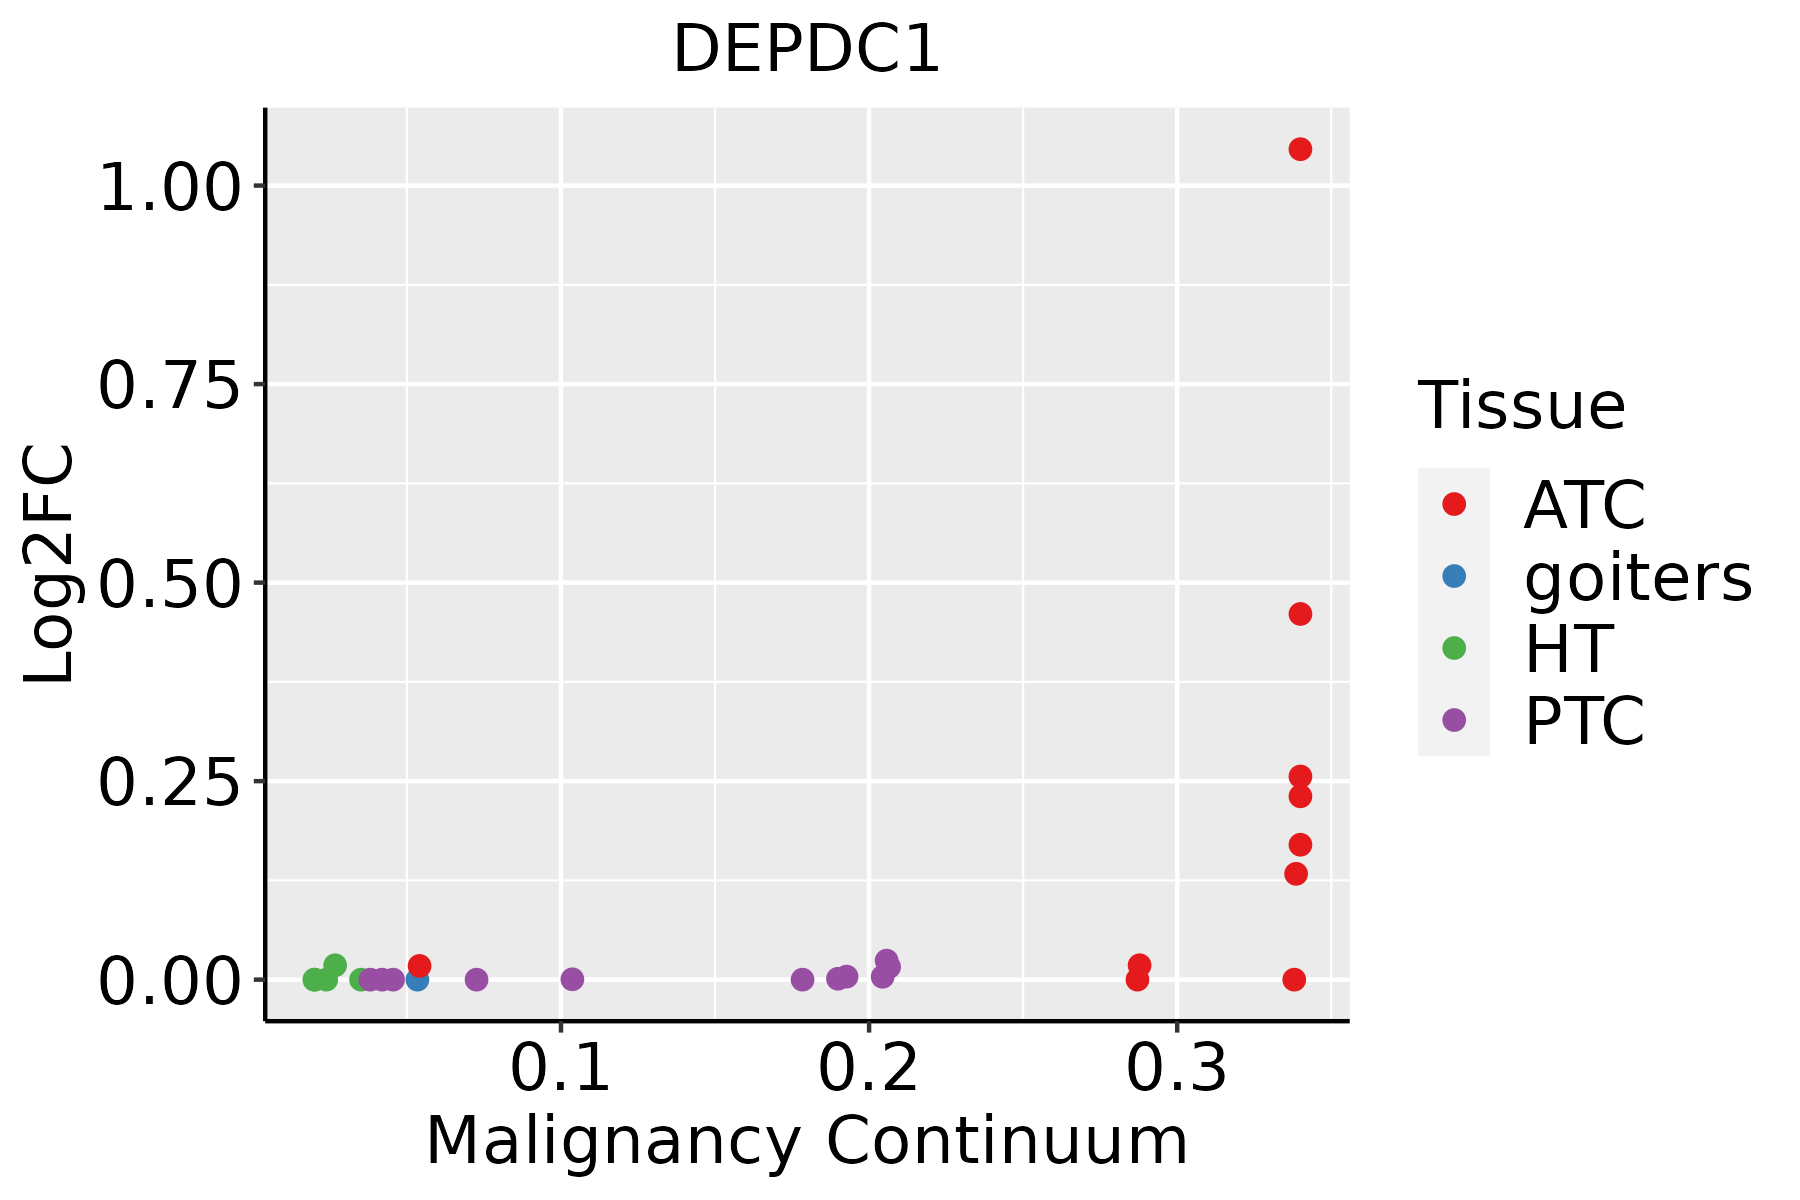 | ATC: Anaplastic thyroid cancer |
| HT: Hashimoto's thyroiditis | ||
| PTC: Papillary thyroid cancer |
| ∗log2FC in expression of this searched gene in stem-like cells from each diseased tissue sample relative to stem-like cells in normal samples in each tissue plotted against the malignancy continuum. Samples are colored based on if they are from different disease stage. |
Top |
Malignant transformation related pathway analysis |
| Find out the enriched GO biological processes and KEGG pathways involved in transition from healthy to precancer to cancer |
| Tissue | Disease Stage | Enriched GO biological Processes |
| Colorectum | AD |  |
| Colorectum | SER |  |
| Colorectum | MSS |  |
| Colorectum | MSI-H |  |
| Colorectum | FAP |  |
| ∗Top 15 enriched GO BP terms are showed in the bar plot of each disease state in each tissue. Each row represents a significant GO biological process which is colored according to the -log10(p.adjust). |
| Page: 1 2 3 4 5 6 7 8 9 |
| GO ID | Tissue | Disease Stage | Description | Gene Ratio | Bg Ratio | pvalue | p.adjust | Count |
| GO:019873821 | Liver | HCC | cell-cell signaling by wnt | 247/7958 | 446/18723 | 2.11e-08 | 4.96e-07 | 247 |
| GO:001605521 | Liver | HCC | Wnt signaling pathway | 245/7958 | 444/18723 | 3.68e-08 | 8.09e-07 | 245 |
| GO:003011121 | Liver | HCC | regulation of Wnt signaling pathway | 180/7958 | 328/18723 | 3.62e-06 | 4.72e-05 | 180 |
| GO:003017721 | Liver | HCC | positive regulation of Wnt signaling pathway | 81/7958 | 140/18723 | 1.73e-04 | 1.36e-03 | 81 |
| GO:001605524 | Skin | cSCC | Wnt signaling pathway | 158/4864 | 444/18723 | 3.80e-06 | 5.70e-05 | 158 |
| GO:019873824 | Skin | cSCC | cell-cell signaling by wnt | 158/4864 | 446/18723 | 5.08e-06 | 7.38e-05 | 158 |
| GO:003011124 | Skin | cSCC | regulation of Wnt signaling pathway | 117/4864 | 328/18723 | 5.80e-05 | 5.75e-04 | 117 |
| GO:003017724 | Skin | cSCC | positive regulation of Wnt signaling pathway | 55/4864 | 140/18723 | 3.72e-04 | 2.92e-03 | 55 |
| Page: 1 |
| Pathway ID | Tissue | Disease Stage | Description | Gene Ratio | Bg Ratio | pvalue | p.adjust | qvalue | Count |
| Page: 1 |
Top |
Cell-cell communication analysis |
| Identification of potential cell-cell interactions between two cell types and their ligand-receptor pairs for different disease states |
| Ligand | Receptor | LRpair | Pathway | Tissue | Disease Stage |
| Page: 1 |
Top |
Single-cell gene regulatory network inference analysis |
| Find out the significant the regulons (TFs) and the target genes of each regulon across cell types for different disease states |
| TF | Cell Type | Tissue | Disease Stage | Target Gene | RSS | Regulon Activity |
| ∗The dot plots of a searched regulon are shown for all cell subpopulations in each disease state of each tissue based on the regulon specific score inferred using pySCENIC and by calculating the average expression. |
| Page: 1 |
Top |
Somatic mutation of malignant transformation related genes |
| Annotation of somatic variants for genes involved in malignant transformation |
| Hugo Symbol | Variant Class | Variant Classification | dbSNP RS | HGVSc | HGVSp | HGVSp Short | SWISSPROT | BIOTYPE | SIFT | PolyPhen | Tumor Sample Barcode | Tissue | Histology | Sex | Age | Stage | Therapy Types | Drugs | Outcome |
| DEPDC1 | SNV | Missense_Mutation | c.1915N>A | p.Ala639Thr | p.A639T | Q5TB30 | protein_coding | tolerated(0.08) | benign(0.093) | TCGA-A8-A09Z-01 | Breast | breast invasive carcinoma | Female | >=65 | I/II | Unknown | Unknown | SD | |
| DEPDC1 | SNV | Missense_Mutation | rs756159027 | c.1019N>G | p.Lys340Arg | p.K340R | Q5TB30 | protein_coding | tolerated(0.33) | benign(0.055) | TCGA-A8-A0A7-01 | Breast | breast invasive carcinoma | Female | <65 | I/II | Unknown | Unknown | SD |
| DEPDC1 | SNV | Missense_Mutation | c.1017C>G | p.Phe339Leu | p.F339L | Q5TB30 | protein_coding | deleterious(0.01) | probably_damaging(0.935) | TCGA-AC-A23H-01 | Breast | breast invasive carcinoma | Female | >=65 | I/II | Unknown | Unknown | PD | |
| DEPDC1 | SNV | Missense_Mutation | novel | c.1424T>C | p.Ile475Thr | p.I475T | Q5TB30 | protein_coding | tolerated(0.84) | benign(0) | TCGA-AN-A046-01 | Breast | breast invasive carcinoma | Female | >=65 | I/II | Unknown | Unknown | SD |
| DEPDC1 | SNV | Missense_Mutation | c.1922N>A | p.Gly641Asp | p.G641D | Q5TB30 | protein_coding | deleterious(0.01) | probably_damaging(0.993) | TCGA-BH-A0HF-01 | Breast | breast invasive carcinoma | Female | >=65 | I/II | Hormone Therapy | arimidex | SD | |
| DEPDC1 | SNV | Missense_Mutation | novel | c.1180G>A | p.Asp394Asn | p.D394N | Q5TB30 | protein_coding | tolerated(0.69) | benign(0) | TCGA-PE-A5DE-01 | Breast | breast invasive carcinoma | Female | <65 | I/II | Chemotherapy | taxotere | CR |
| DEPDC1 | SNV | Missense_Mutation | rs758121846 | c.434N>A | p.Arg145His | p.R145H | Q5TB30 | protein_coding | tolerated(0.06) | benign(0.437) | TCGA-PL-A8LX-01 | Breast | breast invasive carcinoma | Female | <65 | III/IV | Unknown | Unknown | SD |
| DEPDC1 | insertion | Nonsense_Mutation | novel | c.1556_1557insTATATA | p.Thr519_Arg520insIleTer | p.T519_R520insI* | Q5TB30 | protein_coding | TCGA-AR-A0U0-01 | Breast | breast invasive carcinoma | Female | >=65 | I/II | Unknown | Unknown | SD | ||
| DEPDC1 | insertion | Frame_Shift_Ins | novel | c.1555_1556insTATACAG | p.Thr519IlefsTer7 | p.T519Ifs*7 | Q5TB30 | protein_coding | TCGA-AR-A0U0-01 | Breast | breast invasive carcinoma | Female | >=65 | I/II | Unknown | Unknown | SD | ||
| DEPDC1 | insertion | Frame_Shift_Ins | novel | c.1556_1557insCAGTATATACAGCTATATA | p.Arg520SerfsTer10 | p.R520Sfs*10 | Q5TB30 | protein_coding | TCGA-AR-A0U2-01 | Breast | breast invasive carcinoma | Female | <65 | III/IV | Hormone Therapy | tamoxiphen | PD |
| Page: 1 2 3 4 5 6 7 8 9 10 11 |
Top |
Related drugs of malignant transformation related genes |
| Identification of chemicals and drugs interact with genes involved in malignant transfromation |
| (DGIdb 4.0) |
| Entrez ID | Symbol | Category | Interaction Types | Drug Claim Name | Drug Name | PMIDs |
| Page: 1 |

Copyright 2023-Present -The University of Texas Health Science Center at Houston |