
|
|||||
|
 | |
| |
| |
| |
| |
| |
|
Gene: DENND6A |
Gene summary for DENND6A |
| Gene information | Species | Human | Gene symbol | DENND6A | Gene ID | 201627 |
| Gene name | DENN domain containing 6A | |
| Gene Alias | AFI1A | |
| Cytomap | 3p14.3 | |
| Gene Type | protein-coding | GO ID | GO:0007155 | UniProtAcc | Q8IWF6 |
Top |
Malignant transformation analysis |
| Identification of the aberrant gene expression in precancerous and cancerous lesions by comparing the gene expression of stem-like cells in diseased tissues with normal stem cells |
| Entrez ID | Symbol | Replicates | Species | Organ | Tissue | Adj P-value | Log2FC | Malignancy |
| 201627 | DENND6A | GSM6177620_NYU_UCEC1_lib1_lib1 | Human | Endometrium | EEC | 8.13e-05 | -5.42e-02 | -0.1869 |
| 201627 | DENND6A | GSM6177620_NYU_UCEC1_lib3_lib3 | Human | Endometrium | EEC | 1.32e-05 | -2.94e-02 | -0.1883 |
| 201627 | DENND6A | GSM6177621_NYU_UCEC2_lib1_lib1 | Human | Endometrium | EEC | 4.49e-03 | -1.74e-02 | -0.1934 |
| 201627 | DENND6A | GSM6177622_NYU_UCEC3_lib1_lib1 | Human | Endometrium | EEC | 1.97e-05 | 3.35e-02 | -0.1917 |
| 201627 | DENND6A | GSM6177622_NYU_UCEC3_lib2_lib2 | Human | Endometrium | EEC | 2.85e-06 | 2.86e-02 | -0.1916 |
| 201627 | DENND6A | HCC1_Meng | Human | Liver | HCC | 2.00e-20 | -2.48e-02 | 0.0246 |
| 201627 | DENND6A | HCC2_Meng | Human | Liver | HCC | 3.65e-11 | 4.59e-02 | 0.0107 |
| 201627 | DENND6A | HCC1 | Human | Liver | HCC | 1.08e-02 | 1.18e+00 | 0.5336 |
| 201627 | DENND6A | HCC2 | Human | Liver | HCC | 3.63e-09 | 2.81e+00 | 0.5341 |
| 201627 | DENND6A | S014 | Human | Liver | HCC | 1.75e-02 | 2.50e-01 | 0.2254 |
| 201627 | DENND6A | S016 | Human | Liver | HCC | 3.00e-02 | 2.57e-01 | 0.2243 |
| 201627 | DENND6A | S028 | Human | Liver | HCC | 8.66e-10 | 5.00e-01 | 0.2503 |
| 201627 | DENND6A | S029 | Human | Liver | HCC | 1.04e-06 | 4.39e-01 | 0.2581 |
| Page: 1 |
| Tissue | Expression Dynamics | Abbreviation |
| Endometrium | 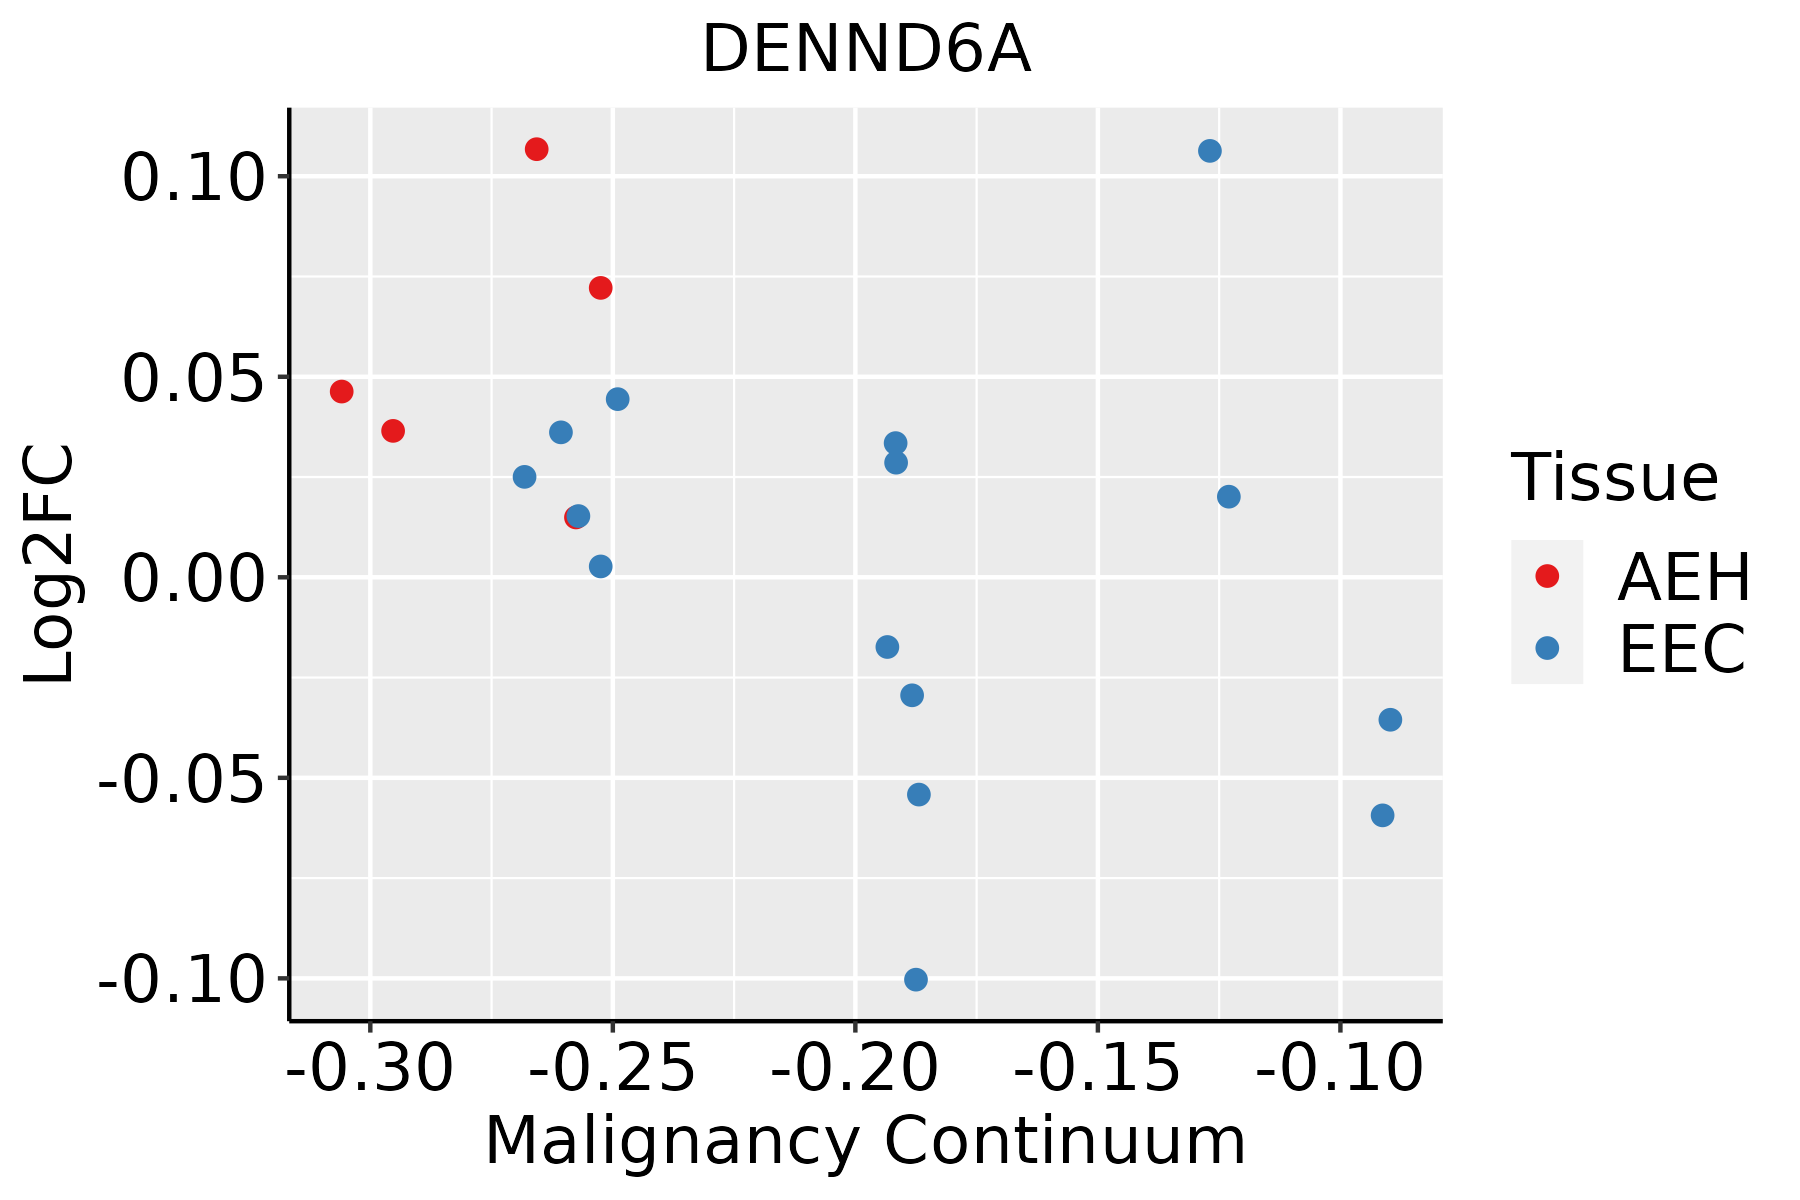 | AEH: Atypical endometrial hyperplasia |
| EEC: Endometrioid Cancer | ||
| Liver |  | HCC: Hepatocellular carcinoma |
| NAFLD: Non-alcoholic fatty liver disease |
| ∗log2FC in expression of this searched gene in stem-like cells from each diseased tissue sample relative to stem-like cells in normal samples in each tissue plotted against the malignancy continuum. Samples are colored based on if they are from different disease stage. |
Top |
Malignant transformation related pathway analysis |
| Find out the enriched GO biological processes and KEGG pathways involved in transition from healthy to precancer to cancer |
| Tissue | Disease Stage | Enriched GO biological Processes |
| Colorectum | AD |  |
| Colorectum | SER |  |
| Colorectum | MSS |  |
| Colorectum | MSI-H |  |
| Colorectum | FAP |  |
| ∗Top 15 enriched GO BP terms are showed in the bar plot of each disease state in each tissue. Each row represents a significant GO biological process which is colored according to the -log10(p.adjust). |
| Page: 1 2 3 4 5 6 7 8 9 |
| GO ID | Tissue | Disease Stage | Description | Gene Ratio | Bg Ratio | pvalue | p.adjust | Count |
| GO:004578517 | Endometrium | EEC | positive regulation of cell adhesion | 98/2168 | 437/18723 | 6.15e-11 | 8.38e-09 | 98 |
| GO:002240715 | Endometrium | EEC | regulation of cell-cell adhesion | 84/2168 | 448/18723 | 4.98e-06 | 1.24e-04 | 84 |
| GO:002240914 | Endometrium | EEC | positive regulation of cell-cell adhesion | 56/2168 | 284/18723 | 4.36e-05 | 7.15e-04 | 56 |
| GO:004578512 | Liver | HCC | positive regulation of cell adhesion | 215/7958 | 437/18723 | 2.53e-03 | 1.22e-02 | 215 |
| Page: 1 |
| Pathway ID | Tissue | Disease Stage | Description | Gene Ratio | Bg Ratio | pvalue | p.adjust | qvalue | Count |
| Page: 1 |
Top |
Cell-cell communication analysis |
| Identification of potential cell-cell interactions between two cell types and their ligand-receptor pairs for different disease states |
| Ligand | Receptor | LRpair | Pathway | Tissue | Disease Stage |
| Page: 1 |
Top |
Single-cell gene regulatory network inference analysis |
| Find out the significant the regulons (TFs) and the target genes of each regulon across cell types for different disease states |
| TF | Cell Type | Tissue | Disease Stage | Target Gene | RSS | Regulon Activity |
| ∗The dot plots of a searched regulon are shown for all cell subpopulations in each disease state of each tissue based on the regulon specific score inferred using pySCENIC and by calculating the average expression. |
| Page: 1 |
Top |
Somatic mutation of malignant transformation related genes |
| Annotation of somatic variants for genes involved in malignant transformation |
| Hugo Symbol | Variant Class | Variant Classification | dbSNP RS | HGVSc | HGVSp | HGVSp Short | SWISSPROT | BIOTYPE | SIFT | PolyPhen | Tumor Sample Barcode | Tissue | Histology | Sex | Age | Stage | Therapy Types | Drugs | Outcome |
| DENND6A | SNV | Missense_Mutation | novel | c.1374G>T | p.Leu458Phe | p.L458F | Q8IWF6 | protein_coding | deleterious(0) | probably_damaging(0.999) | TCGA-A2-A0YM-01 | Breast | breast invasive carcinoma | Female | >=65 | I/II | Unknown | Unknown | SD |
| DENND6A | SNV | Missense_Mutation | novel | c.1487N>T | p.Arg496Ile | p.R496I | Q8IWF6 | protein_coding | tolerated(0.35) | benign(0) | TCGA-AN-A046-01 | Breast | breast invasive carcinoma | Female | >=65 | I/II | Unknown | Unknown | SD |
| DENND6A | SNV | Missense_Mutation | c.1341N>G | p.Phe447Leu | p.F447L | Q8IWF6 | protein_coding | deleterious(0) | probably_damaging(0.993) | TCGA-AN-A0FL-01 | Breast | breast invasive carcinoma | Female | <65 | I/II | Unknown | Unknown | SD | |
| DENND6A | SNV | Missense_Mutation | novel | c.362C>G | p.Ser121Cys | p.S121C | Q8IWF6 | protein_coding | tolerated(0.49) | benign(0.017) | TCGA-D8-A1JD-01 | Breast | breast invasive carcinoma | Female | <65 | I/II | Chemotherapy | adriamycin | SD |
| DENND6A | SNV | Missense_Mutation | novel | c.1067N>T | p.Pro356Leu | p.P356L | Q8IWF6 | protein_coding | deleterious(0.01) | probably_damaging(1) | TCGA-JL-A3YW-01 | Breast | breast invasive carcinoma | Female | <65 | I/II | Unknown | Unknown | SD |
| DENND6A | SNV | Missense_Mutation | novel | c.1141C>G | p.Pro381Ala | p.P381A | Q8IWF6 | protein_coding | tolerated(0.14) | benign(0.036) | TCGA-C5-A8XJ-01 | Cervix | cervical & endocervical cancer | Female | >=65 | I/II | Chemotherapy | cisplatin | SD |
| DENND6A | SNV | Missense_Mutation | novel | c.1407N>T | p.Lys469Asn | p.K469N | Q8IWF6 | protein_coding | deleterious(0) | probably_damaging(0.94) | TCGA-EK-A2RA-01 | Cervix | cervical & endocervical cancer | Female | >=65 | I/II | Unknown | Unknown | SD |
| DENND6A | SNV | Missense_Mutation | c.1424N>C | p.Arg475Thr | p.R475T | Q8IWF6 | protein_coding | deleterious(0.01) | benign(0.287) | TCGA-EK-A3GK-01 | Cervix | cervical & endocervical cancer | Female | <65 | I/II | Unknown | Unknown | SD | |
| DENND6A | deletion | Frame_Shift_Del | novel | c.555delT | p.His186ThrfsTer7 | p.H186Tfs*7 | Q8IWF6 | protein_coding | TCGA-2W-A8YY-01 | Cervix | cervical & endocervical cancer | Female | <65 | I/II | Chemotherapy | cisplatin | CR | ||
| DENND6A | SNV | Missense_Mutation | c.1087N>A | p.Gln363Lys | p.Q363K | Q8IWF6 | protein_coding | tolerated(0.12) | possibly_damaging(0.644) | TCGA-A6-2686-01 | Colorectum | colon adenocarcinoma | Female | >=65 | I/II | Unknown | Unknown | SD |
| Page: 1 2 3 4 5 6 7 |
Top |
Related drugs of malignant transformation related genes |
| Identification of chemicals and drugs interact with genes involved in malignant transfromation |
| (DGIdb 4.0) |
| Entrez ID | Symbol | Category | Interaction Types | Drug Claim Name | Drug Name | PMIDs |
| Page: 1 |

Copyright 2023-Present -The University of Texas Health Science Center at Houston |