
|
|||||
|
 | |
| |
| |
| |
| |
| |
|
Gene: DENND5B |
Gene summary for DENND5B |
| Gene information | Species | Human | Gene symbol | DENND5B | Gene ID | 160518 |
| Gene name | DENN domain containing 5B | |
| Gene Alias | DENND5B | |
| Cytomap | 12p11.21 | |
| Gene Type | protein-coding | GO ID | GO:0006810 | UniProtAcc | G3V1S3 |
Top |
Malignant transformation analysis |
| Identification of the aberrant gene expression in precancerous and cancerous lesions by comparing the gene expression of stem-like cells in diseased tissues with normal stem cells |
| Entrez ID | Symbol | Replicates | Species | Organ | Tissue | Adj P-value | Log2FC | Malignancy |
| 160518 | DENND5B | AEH-subject1 | Human | Endometrium | AEH | 1.94e-02 | 1.82e-01 | -0.3059 |
| 160518 | DENND5B | AEH-subject3 | Human | Endometrium | AEH | 3.83e-02 | 2.13e-01 | -0.2576 |
| 160518 | DENND5B | AEH-subject4 | Human | Endometrium | AEH | 1.20e-08 | 4.01e-01 | -0.2657 |
| 160518 | DENND5B | EEC-subject1 | Human | Endometrium | EEC | 4.30e-07 | 3.23e-01 | -0.2682 |
| 160518 | DENND5B | GSM6177620_NYU_UCEC1_lib3_lib3 | Human | Endometrium | EEC | 4.01e-02 | -6.92e-03 | -0.1883 |
| 160518 | DENND5B | GSM6177622_NYU_UCEC3_lib2_lib2 | Human | Endometrium | EEC | 4.18e-03 | -2.76e-02 | -0.1916 |
| 160518 | DENND5B | NAFLD1 | Human | Liver | NAFLD | 6.94e-16 | 1.13e+00 | -0.04 |
| 160518 | DENND5B | S43 | Human | Liver | Cirrhotic | 2.03e-02 | -1.61e-01 | -0.0187 |
| 160518 | DENND5B | HCC1_Meng | Human | Liver | HCC | 5.27e-72 | -1.13e-01 | 0.0246 |
| 160518 | DENND5B | HCC2_Meng | Human | Liver | HCC | 7.52e-15 | -1.87e-01 | 0.0107 |
| 160518 | DENND5B | cirrhotic1 | Human | Liver | Cirrhotic | 1.01e-05 | -2.35e-01 | 0.0202 |
| 160518 | DENND5B | cirrhotic2 | Human | Liver | Cirrhotic | 6.69e-04 | -2.21e-01 | 0.0201 |
| 160518 | DENND5B | HCC1 | Human | Liver | HCC | 7.16e-09 | 3.01e+00 | 0.5336 |
| 160518 | DENND5B | HCC2 | Human | Liver | HCC | 2.86e-10 | 3.04e+00 | 0.5341 |
| 160518 | DENND5B | HCC5 | Human | Liver | HCC | 1.74e-04 | 1.69e+00 | 0.4932 |
| 160518 | DENND5B | Pt13.a | Human | Liver | HCC | 2.13e-02 | -2.14e-01 | 0.021 |
| 160518 | DENND5B | S014 | Human | Liver | HCC | 7.44e-08 | 5.26e-01 | 0.2254 |
| 160518 | DENND5B | S015 | Human | Liver | HCC | 4.12e-06 | 5.30e-01 | 0.2375 |
| 160518 | DENND5B | S016 | Human | Liver | HCC | 1.81e-07 | 4.67e-01 | 0.2243 |
| 160518 | DENND5B | S028 | Human | Liver | HCC | 2.29e-04 | 2.47e-01 | 0.2503 |
| Page: 1 2 |
| Tissue | Expression Dynamics | Abbreviation |
| Endometrium | 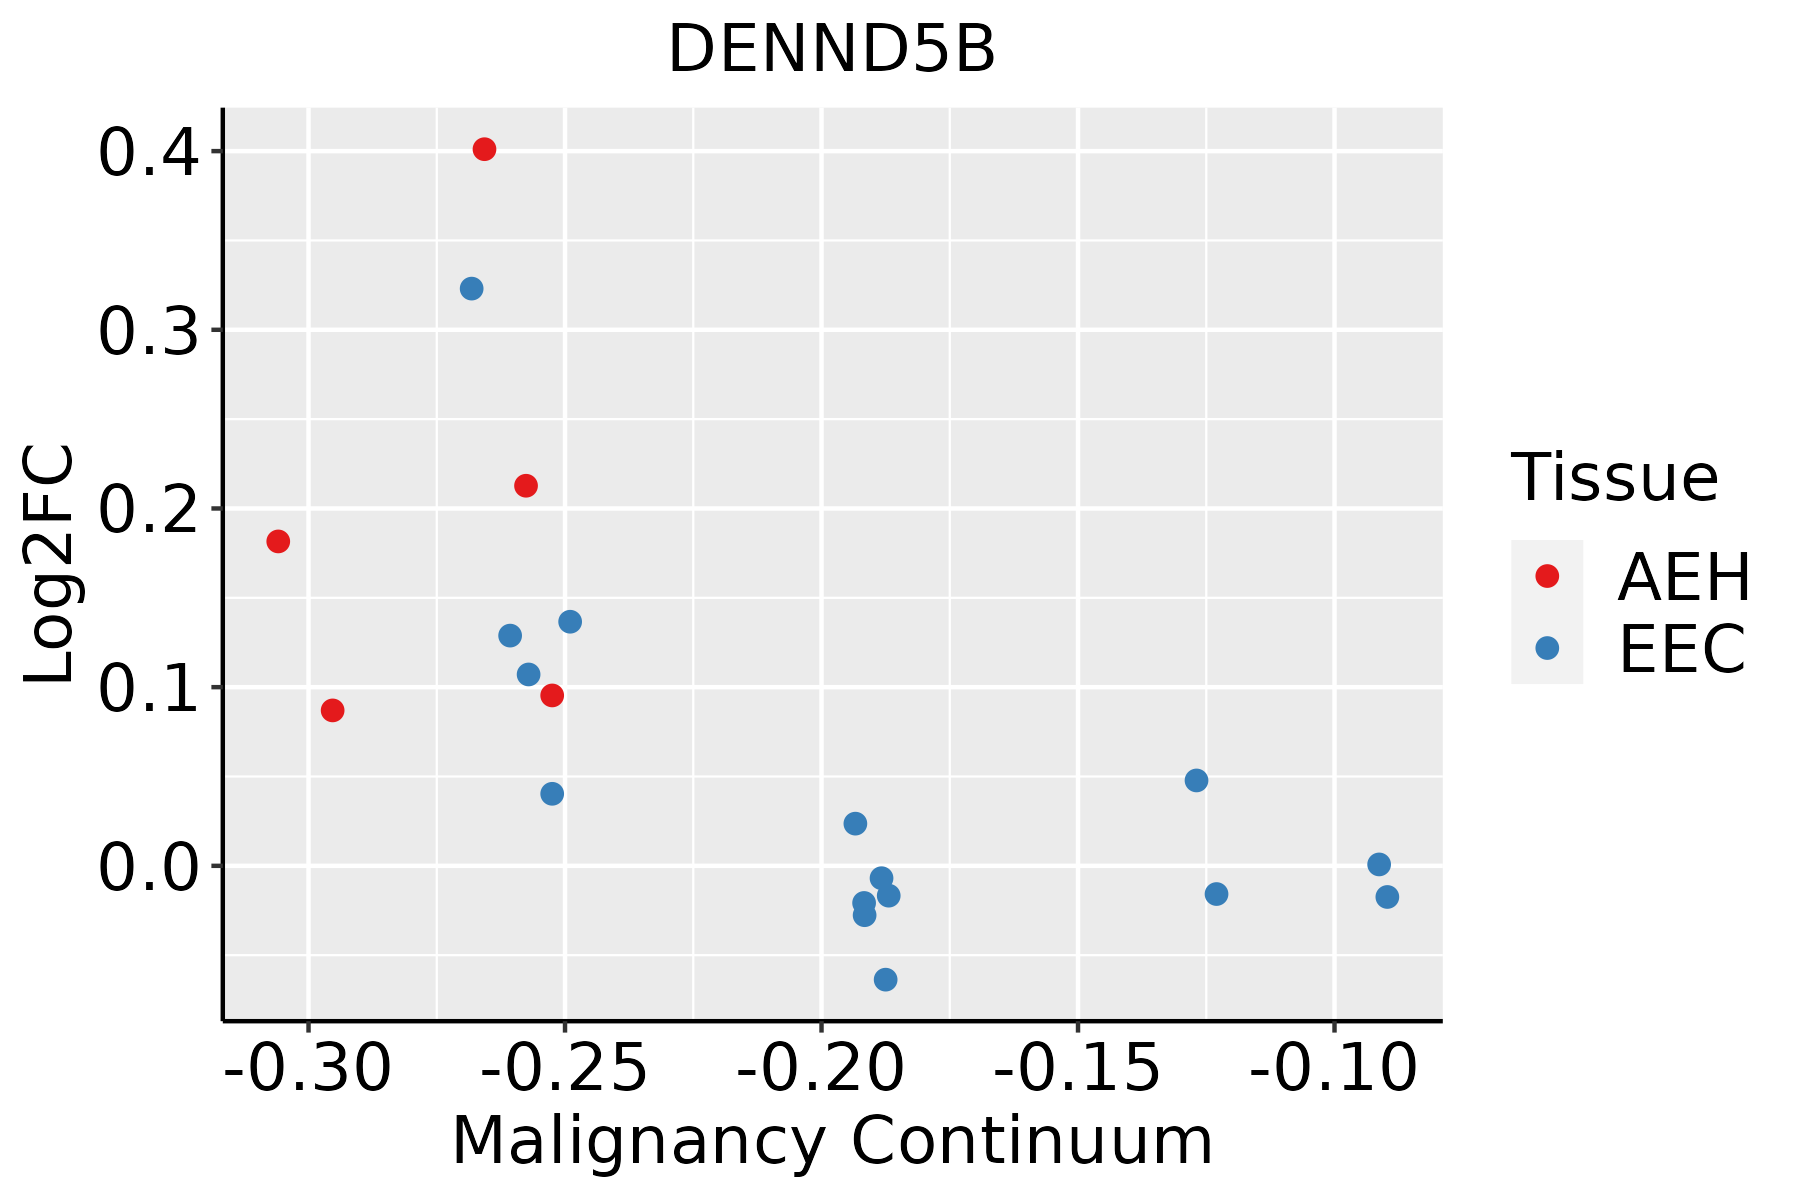 | AEH: Atypical endometrial hyperplasia |
| EEC: Endometrioid Cancer | ||
| Liver | 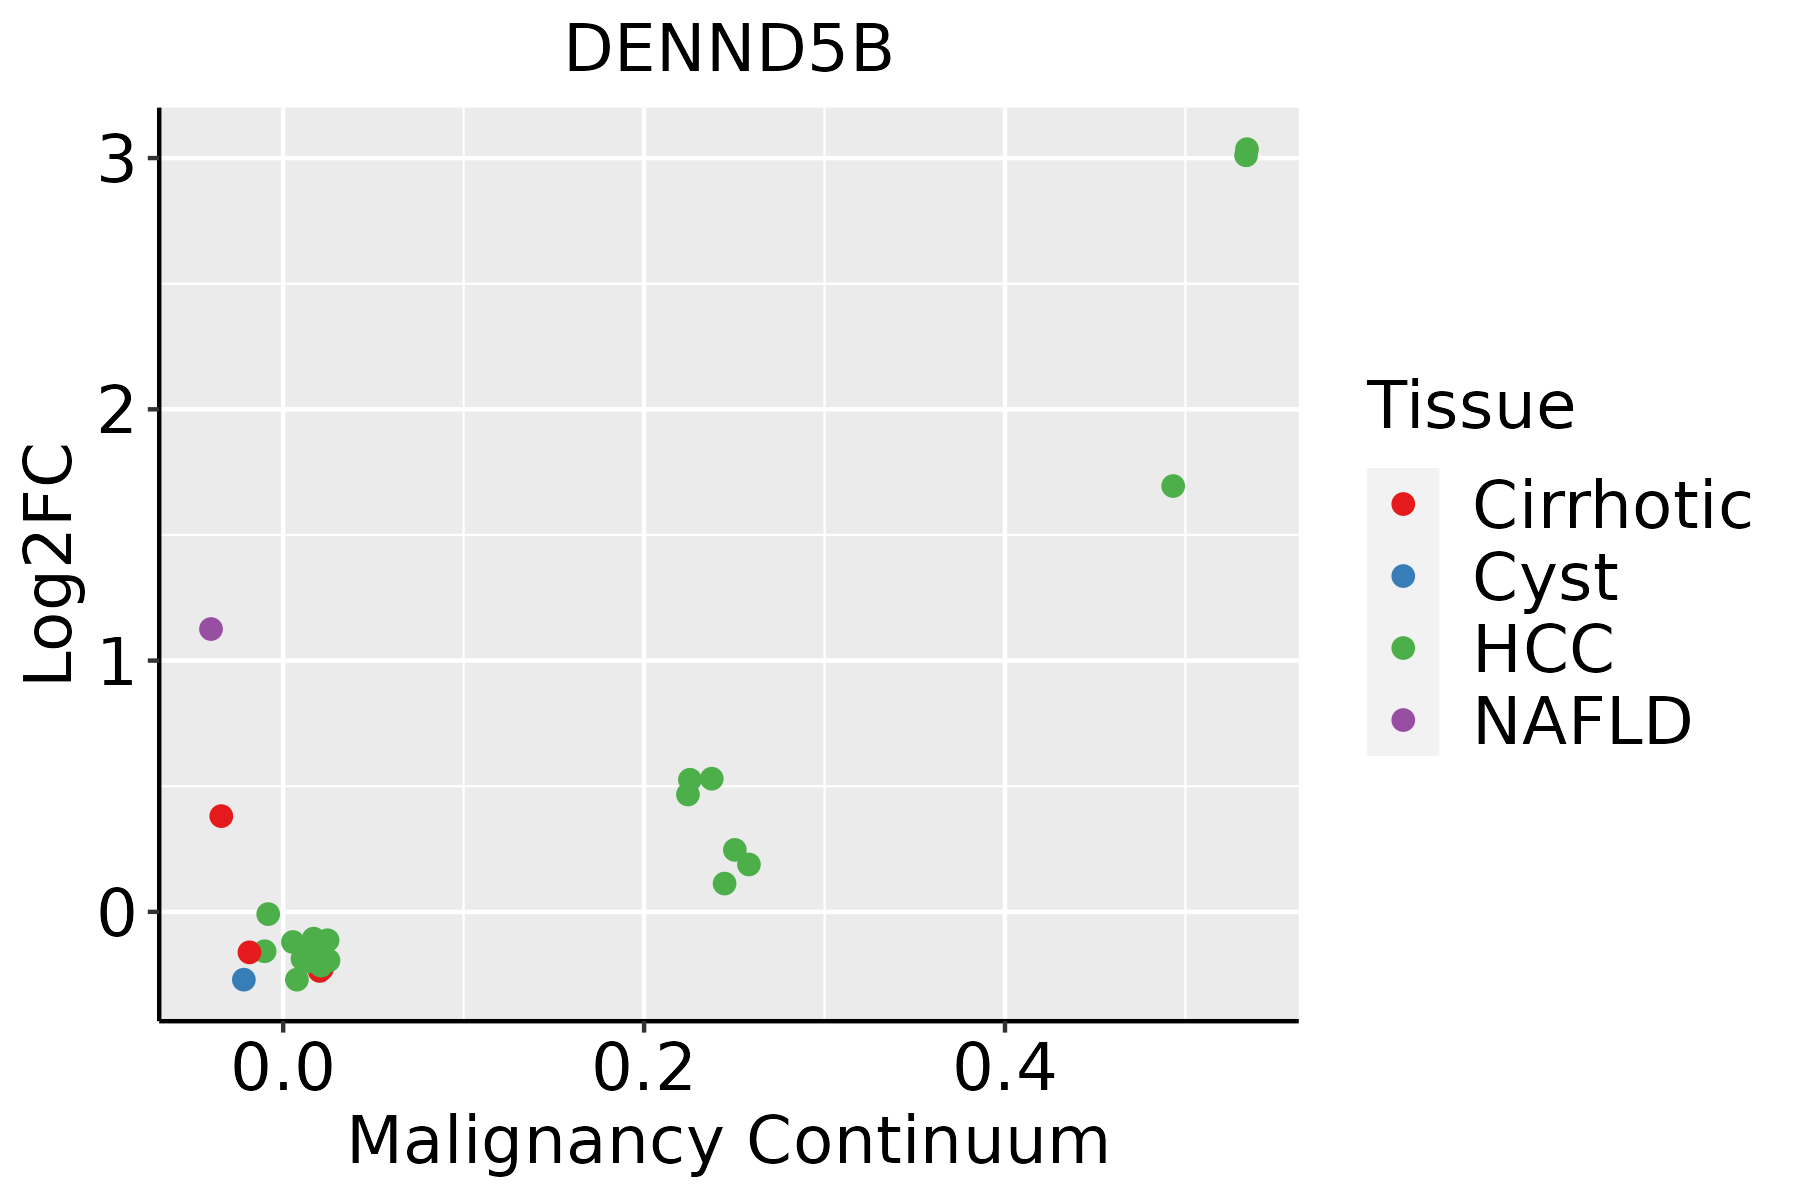 | HCC: Hepatocellular carcinoma |
| NAFLD: Non-alcoholic fatty liver disease |
| ∗log2FC in expression of this searched gene in stem-like cells from each diseased tissue sample relative to stem-like cells in normal samples in each tissue plotted against the malignancy continuum. Samples are colored based on if they are from different disease stage. |
Top |
Malignant transformation related pathway analysis |
| Find out the enriched GO biological processes and KEGG pathways involved in transition from healthy to precancer to cancer |
| Tissue | Disease Stage | Enriched GO biological Processes |
| Colorectum | AD |  |
| Colorectum | SER |  |
| Colorectum | MSS |  |
| Colorectum | MSI-H |  |
| Colorectum | FAP |  |
| ∗Top 15 enriched GO BP terms are showed in the bar plot of each disease state in each tissue. Each row represents a significant GO biological process which is colored according to the -log10(p.adjust). |
| Page: 1 2 3 4 5 6 7 8 9 |
| GO ID | Tissue | Disease Stage | Description | Gene Ratio | Bg Ratio | pvalue | p.adjust | Count |
| GO:00108765 | Liver | NAFLD | lipid localization | 79/1882 | 448/18723 | 4.75e-07 | 2.92e-05 | 79 |
| GO:00068694 | Liver | NAFLD | lipid transport | 71/1882 | 398/18723 | 1.16e-06 | 5.59e-05 | 71 |
| GO:1905952 | Liver | NAFLD | regulation of lipid localization | 34/1882 | 181/18723 | 2.51e-04 | 4.12e-03 | 34 |
| GO:1905954 | Liver | NAFLD | positive regulation of lipid localization | 23/1882 | 110/18723 | 5.16e-04 | 7.15e-03 | 23 |
| GO:0032368 | Liver | NAFLD | regulation of lipid transport | 28/1882 | 149/18723 | 8.39e-04 | 1.03e-02 | 28 |
| GO:0032370 | Liver | NAFLD | positive regulation of lipid transport | 18/1882 | 84/18723 | 1.49e-03 | 1.64e-02 | 18 |
| GO:001087611 | Liver | Cirrhotic | lipid localization | 147/4634 | 448/18723 | 6.24e-05 | 7.12e-04 | 147 |
| GO:000686911 | Liver | Cirrhotic | lipid transport | 128/4634 | 398/18723 | 4.54e-04 | 3.69e-03 | 128 |
| GO:19059521 | Liver | Cirrhotic | regulation of lipid localization | 62/4634 | 181/18723 | 2.53e-03 | 1.51e-02 | 62 |
| GO:00323681 | Liver | Cirrhotic | regulation of lipid transport | 51/4634 | 149/18723 | 5.85e-03 | 2.93e-02 | 51 |
| GO:19059541 | Liver | Cirrhotic | positive regulation of lipid localization | 39/4634 | 110/18723 | 7.76e-03 | 3.65e-02 | 39 |
| GO:00323701 | Liver | Cirrhotic | positive regulation of lipid transport | 31/4634 | 84/18723 | 8.75e-03 | 4.04e-02 | 31 |
| GO:001087621 | Liver | HCC | lipid localization | 228/7958 | 448/18723 | 1.80e-04 | 1.41e-03 | 228 |
| GO:000686921 | Liver | HCC | lipid transport | 198/7958 | 398/18723 | 1.92e-03 | 9.78e-03 | 198 |
| Page: 1 |
| Pathway ID | Tissue | Disease Stage | Description | Gene Ratio | Bg Ratio | pvalue | p.adjust | qvalue | Count |
| Page: 1 |
Top |
Cell-cell communication analysis |
| Identification of potential cell-cell interactions between two cell types and their ligand-receptor pairs for different disease states |
| Ligand | Receptor | LRpair | Pathway | Tissue | Disease Stage |
| Page: 1 |
Top |
Single-cell gene regulatory network inference analysis |
| Find out the significant the regulons (TFs) and the target genes of each regulon across cell types for different disease states |
| TF | Cell Type | Tissue | Disease Stage | Target Gene | RSS | Regulon Activity |
| ∗The dot plots of a searched regulon are shown for all cell subpopulations in each disease state of each tissue based on the regulon specific score inferred using pySCENIC and by calculating the average expression. |
| Page: 1 |
Top |
Somatic mutation of malignant transformation related genes |
| Annotation of somatic variants for genes involved in malignant transformation |
| Hugo Symbol | Variant Class | Variant Classification | dbSNP RS | HGVSc | HGVSp | HGVSp Short | SWISSPROT | BIOTYPE | SIFT | PolyPhen | Tumor Sample Barcode | Tissue | Histology | Sex | Age | Stage | Therapy Types | Drugs | Outcome |
| DENND5B | SNV | Missense_Mutation | novel | c.190G>C | p.Asp64His | p.D64H | protein_coding | deleterious_low_confidence(0.01) | benign(0.003) | TCGA-5L-AAT1-01 | Breast | breast invasive carcinoma | Female | <65 | III/IV | Hormone Therapy | letrozol | SD | |
| DENND5B | SNV | Missense_Mutation | rs751889421 | c.1915N>T | p.Pro639Ser | p.P639S | protein_coding | tolerated(0.28) | benign(0.171) | TCGA-A7-A6VY-01 | Breast | breast invasive carcinoma | Female | <65 | I/II | Chemotherapy | cyclophosphamide | CR | |
| DENND5B | SNV | Missense_Mutation | c.1168N>A | p.Asp390Asn | p.D390N | protein_coding | tolerated(0.08) | benign(0.43) | TCGA-AC-A23H-01 | Breast | breast invasive carcinoma | Female | >=65 | I/II | Unknown | Unknown | PD | ||
| DENND5B | SNV | Missense_Mutation | novel | c.3470N>T | p.Cys1157Phe | p.C1157F | protein_coding | deleterious(0) | probably_damaging(1) | TCGA-AQ-A04J-01 | Breast | breast invasive carcinoma | Female | <65 | I/II | Chemotherapy | cytoxan | SD | |
| DENND5B | SNV | Missense_Mutation | novel | c.2072C>A | p.Pro691Gln | p.P691Q | protein_coding | deleterious(0) | probably_damaging(0.999) | TCGA-AQ-A54N-01 | Breast | breast invasive carcinoma | Female | <65 | I/II | Unknown | Unknown | SD | |
| DENND5B | SNV | Missense_Mutation | c.3724N>T | p.Ile1242Phe | p.I1242F | protein_coding | deleterious(0) | benign(0.142) | TCGA-BH-A0B4-01 | Breast | breast invasive carcinoma | Male | >=65 | III/IV | Hormone Therapy | tamoxiphen | SD | ||
| DENND5B | SNV | Missense_Mutation | c.1132C>G | p.Pro378Ala | p.P378A | protein_coding | deleterious(0) | probably_damaging(1) | TCGA-BH-A0E9-01 | Breast | breast invasive carcinoma | Female | <65 | I/II | Chemotherapy | taxotere | CR | ||
| DENND5B | SNV | Missense_Mutation | novel | c.705N>G | p.Phe235Leu | p.F235L | protein_coding | tolerated(0.05) | possibly_damaging(0.623) | TCGA-BH-A18K-01 | Breast | breast invasive carcinoma | Female | <65 | I/II | Unknown | Unknown | PD | |
| DENND5B | SNV | Missense_Mutation | c.3499G>C | p.Glu1167Gln | p.E1167Q | protein_coding | deleterious(0) | probably_damaging(0.994) | TCGA-BH-A18P-01 | Breast | breast invasive carcinoma | Female | <65 | I/II | Unknown | Unknown | PD | ||
| DENND5B | SNV | Missense_Mutation | rs769488013 | c.1766N>C | p.Tyr589Ser | p.Y589S | protein_coding | deleterious(0.04) | benign(0.171) | TCGA-BH-A1F2-01 | Breast | breast invasive carcinoma | Female | <65 | III/IV | Unknown | Unknown | SD |
| Page: 1 2 3 4 5 6 7 8 9 10 11 12 13 14 |
Top |
Related drugs of malignant transformation related genes |
| Identification of chemicals and drugs interact with genes involved in malignant transfromation |
| (DGIdb 4.0) |
| Entrez ID | Symbol | Category | Interaction Types | Drug Claim Name | Drug Name | PMIDs |
| Page: 1 |

Copyright 2023-Present -The University of Texas Health Science Center at Houston |