
|
|||||
|
 | |
| |
| |
| |
| |
| |
|
Gene: DENND5A |
Gene summary for DENND5A |
| Gene information | Species | Human | Gene symbol | DENND5A | Gene ID | 23258 |
| Gene name | DENN domain containing 5A | |
| Gene Alias | DEE49 | |
| Cytomap | 11p15.4 | |
| Gene Type | protein-coding | GO ID | GO:0006810 | UniProtAcc | Q6IQ26 |
Top |
Malignant transformation analysis |
| Identification of the aberrant gene expression in precancerous and cancerous lesions by comparing the gene expression of stem-like cells in diseased tissues with normal stem cells |
| Entrez ID | Symbol | Replicates | Species | Organ | Tissue | Adj P-value | Log2FC | Malignancy |
| 23258 | DENND5A | AEH-subject1 | Human | Endometrium | AEH | 1.38e-16 | 5.49e-01 | -0.3059 |
| 23258 | DENND5A | AEH-subject2 | Human | Endometrium | AEH | 1.35e-07 | 3.46e-01 | -0.2525 |
| 23258 | DENND5A | AEH-subject3 | Human | Endometrium | AEH | 2.69e-11 | 4.67e-01 | -0.2576 |
| 23258 | DENND5A | AEH-subject4 | Human | Endometrium | AEH | 1.17e-29 | 8.39e-01 | -0.2657 |
| 23258 | DENND5A | AEH-subject5 | Human | Endometrium | AEH | 4.08e-25 | 7.77e-01 | -0.2953 |
| 23258 | DENND5A | EEC-subject1 | Human | Endometrium | EEC | 6.13e-35 | 8.52e-01 | -0.2682 |
| 23258 | DENND5A | EEC-subject2 | Human | Endometrium | EEC | 3.01e-14 | 4.80e-01 | -0.2607 |
| 23258 | DENND5A | EEC-subject3 | Human | Endometrium | EEC | 1.09e-03 | 2.45e-01 | -0.2525 |
| 23258 | DENND5A | EEC-subject4 | Human | Endometrium | EEC | 2.74e-04 | 3.71e-01 | -0.2571 |
| 23258 | DENND5A | EEC-subject5 | Human | Endometrium | EEC | 4.33e-12 | 4.61e-01 | -0.249 |
| 23258 | DENND5A | GSM5276934 | Human | Endometrium | EEC | 1.86e-02 | 2.47e-01 | -0.0913 |
| 23258 | DENND5A | GSM6177620_NYU_UCEC1_lib2_lib2 | Human | Endometrium | EEC | 8.90e-05 | 1.53e-02 | -0.1875 |
| 23258 | DENND5A | GSM6177620_NYU_UCEC1_lib3_lib3 | Human | Endometrium | EEC | 7.60e-03 | 2.02e-02 | -0.1883 |
| 23258 | DENND5A | GSM6177621_NYU_UCEC2_lib1_lib1 | Human | Endometrium | EEC | 3.40e-02 | 3.00e-02 | -0.1934 |
| 23258 | DENND5A | GSM6177622_NYU_UCEC3_lib1_lib1 | Human | Endometrium | EEC | 2.90e-03 | -3.02e-02 | -0.1917 |
| 23258 | DENND5A | GSM6177622_NYU_UCEC3_lib2_lib2 | Human | Endometrium | EEC | 9.58e-03 | -5.38e-02 | -0.1916 |
| 23258 | DENND5A | HCC1_Meng | Human | Liver | HCC | 1.15e-48 | 6.02e-03 | 0.0246 |
| 23258 | DENND5A | HCC1 | Human | Liver | HCC | 3.38e-05 | 2.71e+00 | 0.5336 |
| 23258 | DENND5A | HCC2 | Human | Liver | HCC | 5.34e-06 | 3.07e+00 | 0.5341 |
| 23258 | DENND5A | S014 | Human | Liver | HCC | 4.27e-06 | 3.95e-01 | 0.2254 |
| Page: 1 2 3 |
| Tissue | Expression Dynamics | Abbreviation |
| Endometrium | 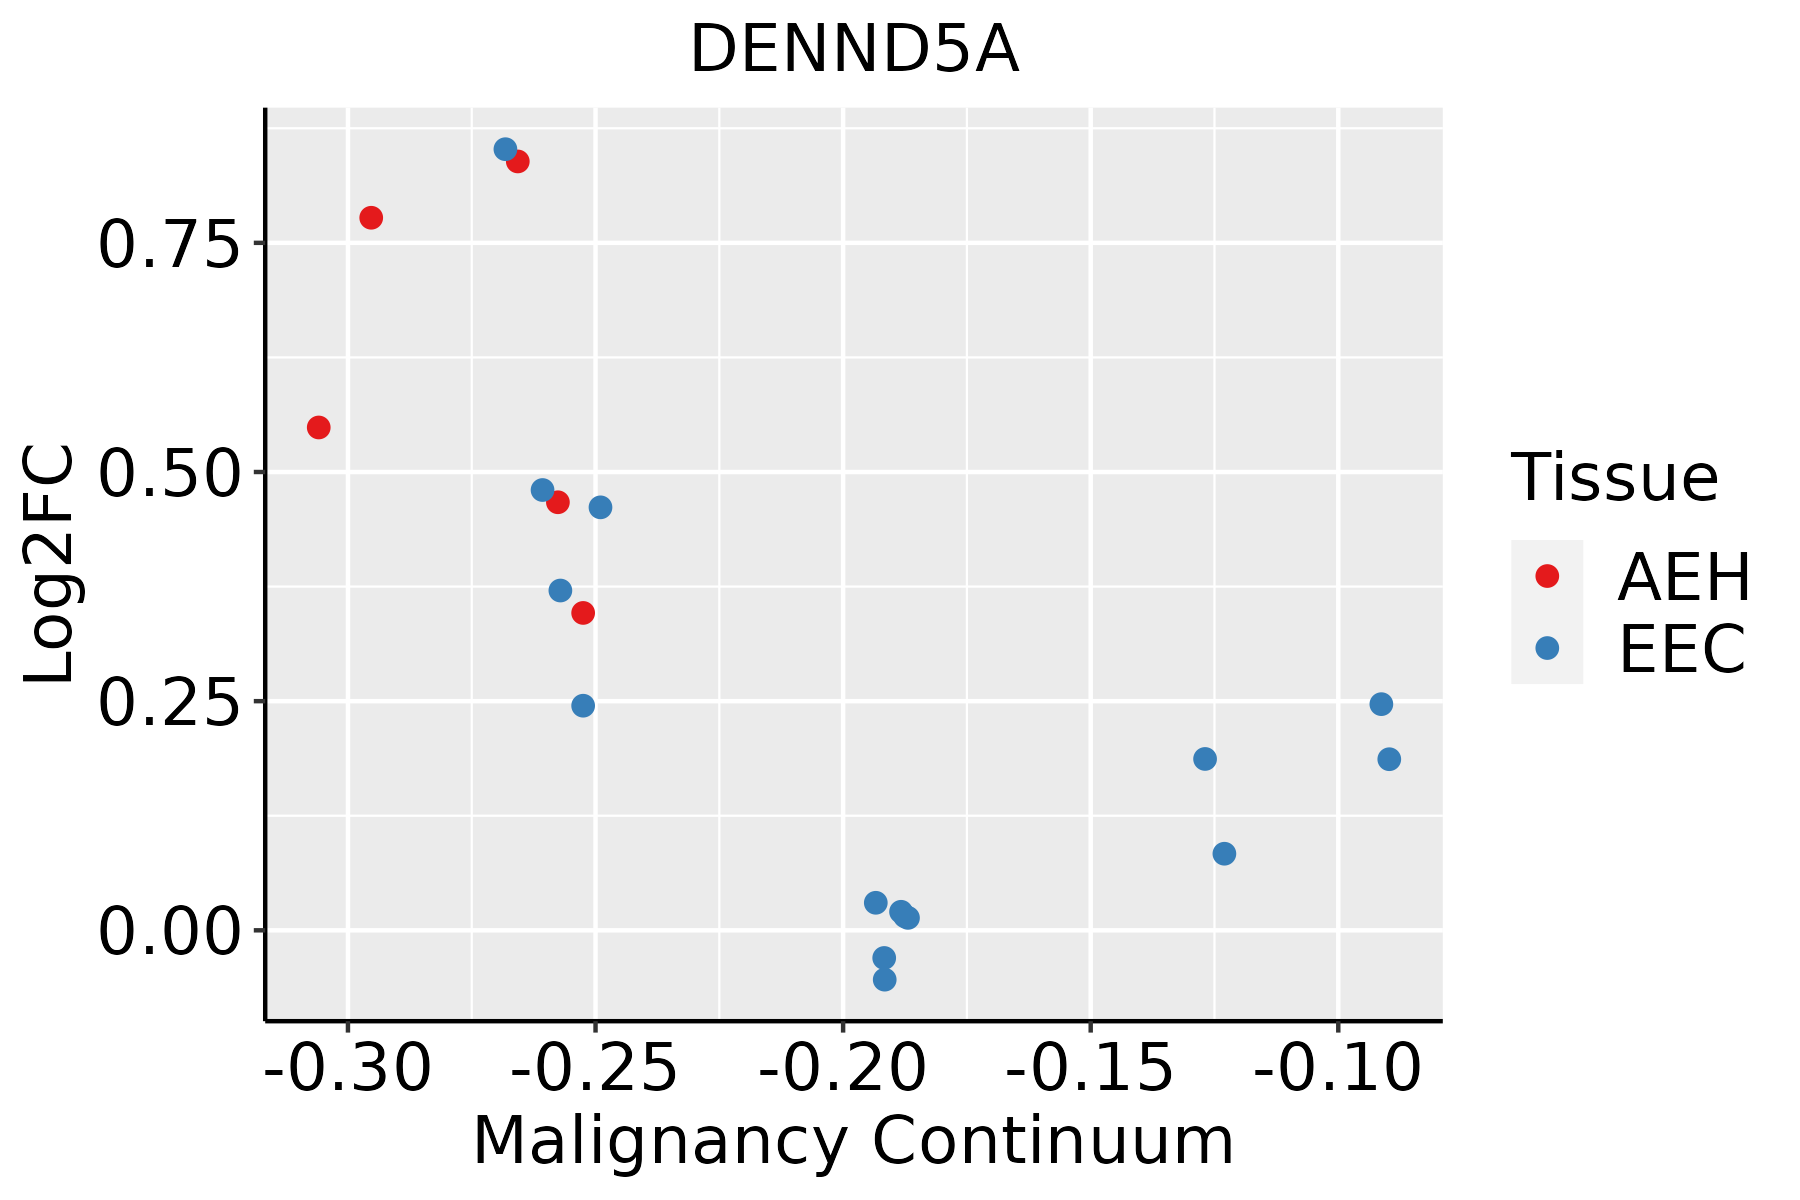 | AEH: Atypical endometrial hyperplasia |
| EEC: Endometrioid Cancer | ||
| Liver |  | HCC: Hepatocellular carcinoma |
| NAFLD: Non-alcoholic fatty liver disease | ||
| Lung | 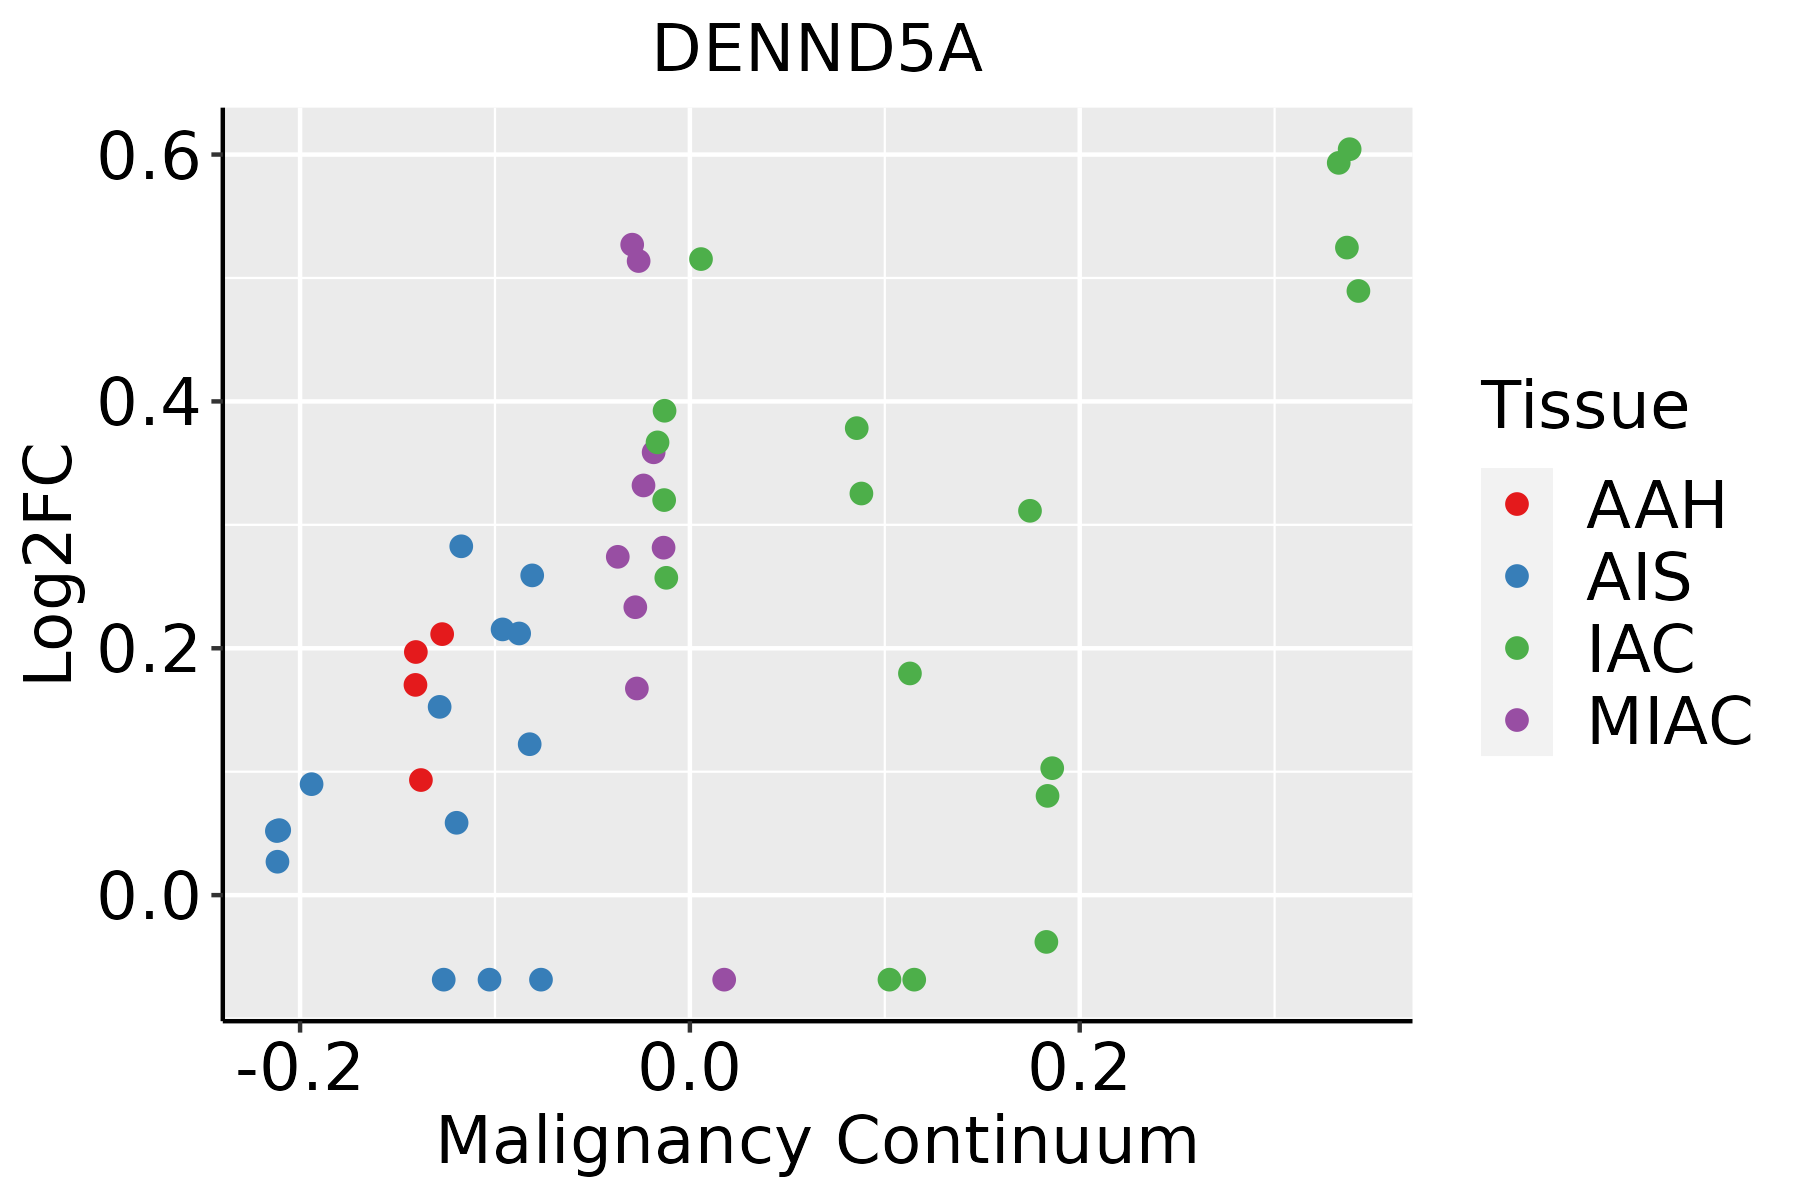 | AAH: Atypical adenomatous hyperplasia |
| AIS: Adenocarcinoma in situ | ||
| IAC: Invasive lung adenocarcinoma | ||
| MIA: Minimally invasive adenocarcinoma | ||
| Oral Cavity | 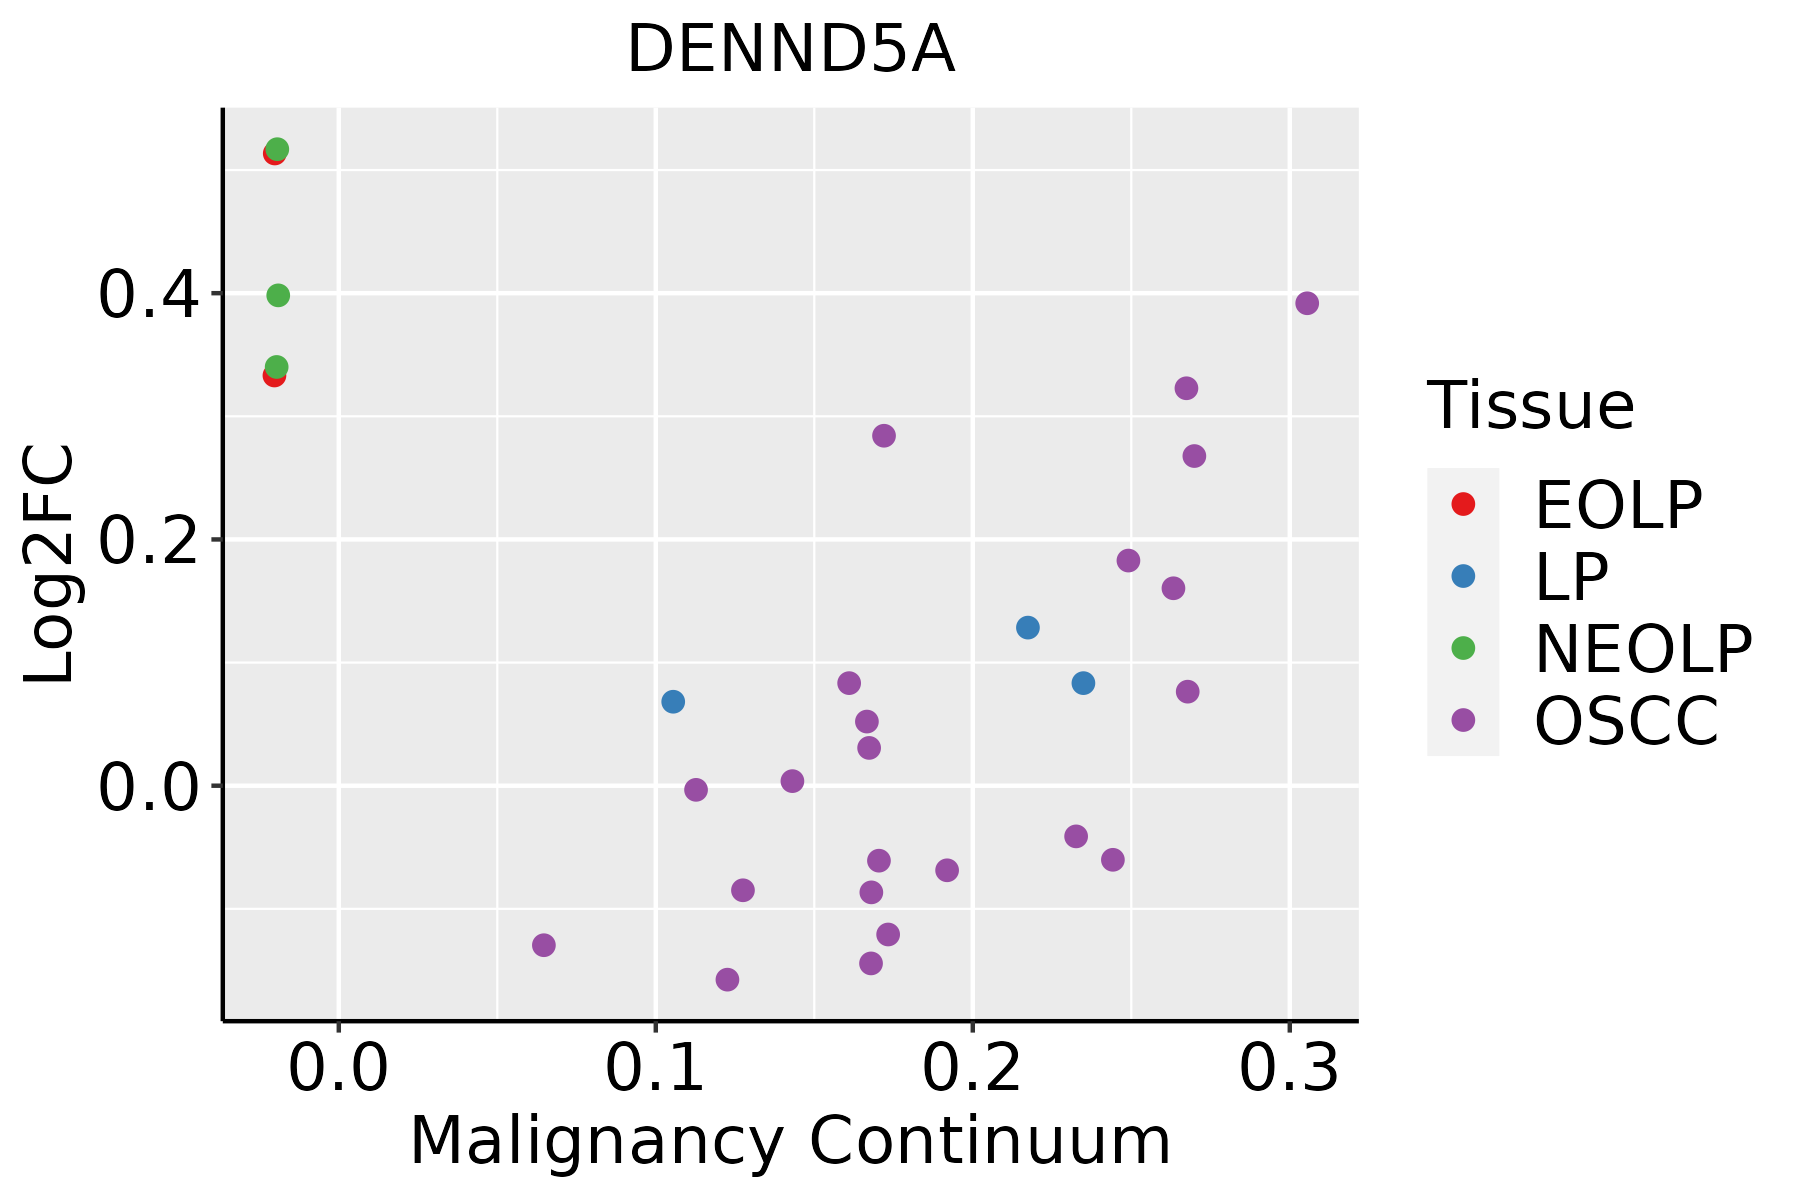 | EOLP: Erosive Oral lichen planus |
| LP: leukoplakia | ||
| NEOLP: Non-erosive oral lichen planus | ||
| OSCC: Oral squamous cell carcinoma | ||
| Prostate |  | BPH: Benign Prostatic Hyperplasia |
| ∗log2FC in expression of this searched gene in stem-like cells from each diseased tissue sample relative to stem-like cells in normal samples in each tissue plotted against the malignancy continuum. Samples are colored based on if they are from different disease stage. |
Top |
Malignant transformation related pathway analysis |
| Find out the enriched GO biological processes and KEGG pathways involved in transition from healthy to precancer to cancer |
| Tissue | Disease Stage | Enriched GO biological Processes |
| Colorectum | AD |  |
| Colorectum | SER |  |
| Colorectum | MSS |  |
| Colorectum | MSI-H |  |
| Colorectum | FAP |  |
| ∗Top 15 enriched GO BP terms are showed in the bar plot of each disease state in each tissue. Each row represents a significant GO biological process which is colored according to the -log10(p.adjust). |
| Page: 1 2 3 4 5 6 7 8 9 |
| GO ID | Tissue | Disease Stage | Description | Gene Ratio | Bg Ratio | pvalue | p.adjust | Count |
| GO:00109758 | Endometrium | AEH | regulation of neuron projection development | 75/2100 | 445/18723 | 2.01e-04 | 2.54e-03 | 75 |
| GO:001097513 | Endometrium | EEC | regulation of neuron projection development | 79/2168 | 445/18723 | 6.80e-05 | 1.01e-03 | 79 |
| GO:001619721 | Liver | HCC | endosomal transport | 154/7958 | 230/18723 | 4.74e-14 | 2.95e-12 | 154 |
| GO:001648221 | Liver | HCC | cytosolic transport | 117/7958 | 168/18723 | 8.83e-13 | 4.48e-11 | 117 |
| GO:004214721 | Liver | HCC | retrograde transport, endosome to Golgi | 61/7958 | 91/18723 | 1.94e-06 | 2.68e-05 | 61 |
| GO:001097511 | Liver | HCC | regulation of neuron projection development | 220/7958 | 445/18723 | 1.68e-03 | 8.78e-03 | 220 |
| GO:00109756 | Lung | IAC | regulation of neuron projection development | 82/2061 | 445/18723 | 1.82e-06 | 8.78e-05 | 82 |
| GO:00313455 | Lung | IAC | negative regulation of cell projection organization | 41/2061 | 186/18723 | 1.01e-05 | 3.23e-04 | 41 |
| GO:00164826 | Lung | IAC | cytosolic transport | 37/2061 | 168/18723 | 2.74e-05 | 7.26e-04 | 37 |
| GO:00161976 | Lung | IAC | endosomal transport | 43/2061 | 230/18723 | 3.53e-04 | 5.50e-03 | 43 |
| GO:00109774 | Lung | IAC | negative regulation of neuron projection development | 27/2061 | 137/18723 | 1.88e-03 | 1.92e-02 | 27 |
| GO:00161979 | Oral cavity | OSCC | endosomal transport | 141/7305 | 230/18723 | 5.40e-12 | 2.06e-10 | 141 |
| GO:00164829 | Oral cavity | OSCC | cytosolic transport | 106/7305 | 168/18723 | 2.08e-10 | 5.90e-09 | 106 |
| GO:00421476 | Oral cavity | OSCC | retrograde transport, endosome to Golgi | 55/7305 | 91/18723 | 2.79e-05 | 2.59e-04 | 55 |
| GO:001097510 | Oral cavity | OSCC | regulation of neuron projection development | 210/7305 | 445/18723 | 2.35e-04 | 1.52e-03 | 210 |
| GO:00313458 | Oral cavity | OSCC | negative regulation of cell projection organization | 89/7305 | 186/18723 | 8.51e-03 | 3.09e-02 | 89 |
| GO:001648223 | Oral cavity | EOLP | cytosolic transport | 44/2218 | 168/18723 | 2.40e-07 | 7.45e-06 | 44 |
| GO:001097515 | Oral cavity | EOLP | regulation of neuron projection development | 86/2218 | 445/18723 | 2.75e-06 | 6.05e-05 | 86 |
| GO:001619722 | Oral cavity | EOLP | endosomal transport | 45/2218 | 230/18723 | 4.63e-04 | 4.07e-03 | 45 |
| GO:004214722 | Oral cavity | EOLP | retrograde transport, endosome to Golgi | 21/2218 | 91/18723 | 1.89e-03 | 1.21e-02 | 21 |
| Page: 1 2 |
| Pathway ID | Tissue | Disease Stage | Description | Gene Ratio | Bg Ratio | pvalue | p.adjust | qvalue | Count |
| Page: 1 |
Top |
Cell-cell communication analysis |
| Identification of potential cell-cell interactions between two cell types and their ligand-receptor pairs for different disease states |
| Ligand | Receptor | LRpair | Pathway | Tissue | Disease Stage |
| Page: 1 |
Top |
Single-cell gene regulatory network inference analysis |
| Find out the significant the regulons (TFs) and the target genes of each regulon across cell types for different disease states |
| TF | Cell Type | Tissue | Disease Stage | Target Gene | RSS | Regulon Activity |
| ∗The dot plots of a searched regulon are shown for all cell subpopulations in each disease state of each tissue based on the regulon specific score inferred using pySCENIC and by calculating the average expression. |
| Page: 1 |
Top |
Somatic mutation of malignant transformation related genes |
| Annotation of somatic variants for genes involved in malignant transformation |
| Hugo Symbol | Variant Class | Variant Classification | dbSNP RS | HGVSc | HGVSp | HGVSp Short | SWISSPROT | BIOTYPE | SIFT | PolyPhen | Tumor Sample Barcode | Tissue | Histology | Sex | Age | Stage | Therapy Types | Drugs | Outcome |
| DENND5A | SNV | Missense_Mutation | novel | c.3253N>C | p.Ser1085Pro | p.S1085P | Q6IQ26 | protein_coding | deleterious(0) | probably_damaging(0.958) | TCGA-A2-A0CM-01 | Breast | breast invasive carcinoma | Female | <65 | I/II | Chemotherapy | adriamycin | PD |
| DENND5A | SNV | Missense_Mutation | rs755714912 | c.2821N>A | p.Asp941Asn | p.D941N | Q6IQ26 | protein_coding | deleterious(0.01) | benign(0.341) | TCGA-AN-A046-01 | Breast | breast invasive carcinoma | Female | >=65 | I/II | Unknown | Unknown | SD |
| DENND5A | SNV | Missense_Mutation | novel | c.1243N>T | p.Leu415Phe | p.L415F | Q6IQ26 | protein_coding | deleterious(0.02) | probably_damaging(0.993) | TCGA-AR-A2LE-01 | Breast | breast invasive carcinoma | Female | >=65 | I/II | Hormone Therapy | tamoxiphen | PD |
| DENND5A | SNV | Missense_Mutation | rs200439974 | c.1412G>A | p.Arg471Gln | p.R471Q | Q6IQ26 | protein_coding | deleterious(0.05) | probably_damaging(0.998) | TCGA-E9-A295-01 | Breast | breast invasive carcinoma | Female | >=65 | I/II | Hormone Therapy | tamoxiphen | SD |
| DENND5A | insertion | Frame_Shift_Ins | novel | c.420_421insCCAGTATTTCTGATTAACTATCTTCATGGCCTTTTGC | p.Val141ProfsTer15 | p.V141Pfs*15 | Q6IQ26 | protein_coding | TCGA-A8-A091-01 | Breast | breast invasive carcinoma | Female | <65 | I/II | Chemotherapy | 5-fluorouracil | PD | ||
| DENND5A | insertion | Frame_Shift_Ins | novel | c.3406_3407insG | p.Leu1136CysfsTer21 | p.L1136Cfs*21 | Q6IQ26 | protein_coding | TCGA-A8-A0A6-01 | Breast | breast invasive carcinoma | Female | <65 | III/IV | Chemotherapy | epirubicin | CR | ||
| DENND5A | insertion | Frame_Shift_Ins | novel | c.3405_3406insATCAAAGACCATACACTTGTCAATTCCT | p.Leu1136IlefsTer30 | p.L1136Ifs*30 | Q6IQ26 | protein_coding | TCGA-A8-A0A6-01 | Breast | breast invasive carcinoma | Female | <65 | III/IV | Chemotherapy | epirubicin | CR | ||
| DENND5A | insertion | Nonsense_Mutation | novel | c.596_597insATCCTTTATATATTGAGAAAATGTGGATGTGTTGCATCTTTTTGTT | p.Asp199GlufsTer6 | p.D199Efs*6 | Q6IQ26 | protein_coding | TCGA-AN-A04A-01 | Breast | breast invasive carcinoma | Female | <65 | III/IV | Unknown | Unknown | SD | ||
| DENND5A | SNV | Missense_Mutation | novel | c.2183N>T | p.Ser728Ile | p.S728I | Q6IQ26 | protein_coding | tolerated(0.06) | benign(0.197) | TCGA-2W-A8YY-01 | Cervix | cervical & endocervical cancer | Female | <65 | I/II | Chemotherapy | cisplatin | CR |
| DENND5A | SNV | Missense_Mutation | c.386N>A | p.Arg129Gln | p.R129Q | Q6IQ26 | protein_coding | deleterious(0) | probably_damaging(0.999) | TCGA-2W-A8YY-01 | Cervix | cervical & endocervical cancer | Female | <65 | I/II | Chemotherapy | cisplatin | CR |
| Page: 1 2 3 4 5 6 7 8 9 10 11 12 13 |
Top |
Related drugs of malignant transformation related genes |
| Identification of chemicals and drugs interact with genes involved in malignant transfromation |
| (DGIdb 4.0) |
| Entrez ID | Symbol | Category | Interaction Types | Drug Claim Name | Drug Name | PMIDs |
| Page: 1 |

Copyright 2023-Present -The University of Texas Health Science Center at Houston |