| Tissue | Expression Dynamics | Abbreviation |
| Cervix | 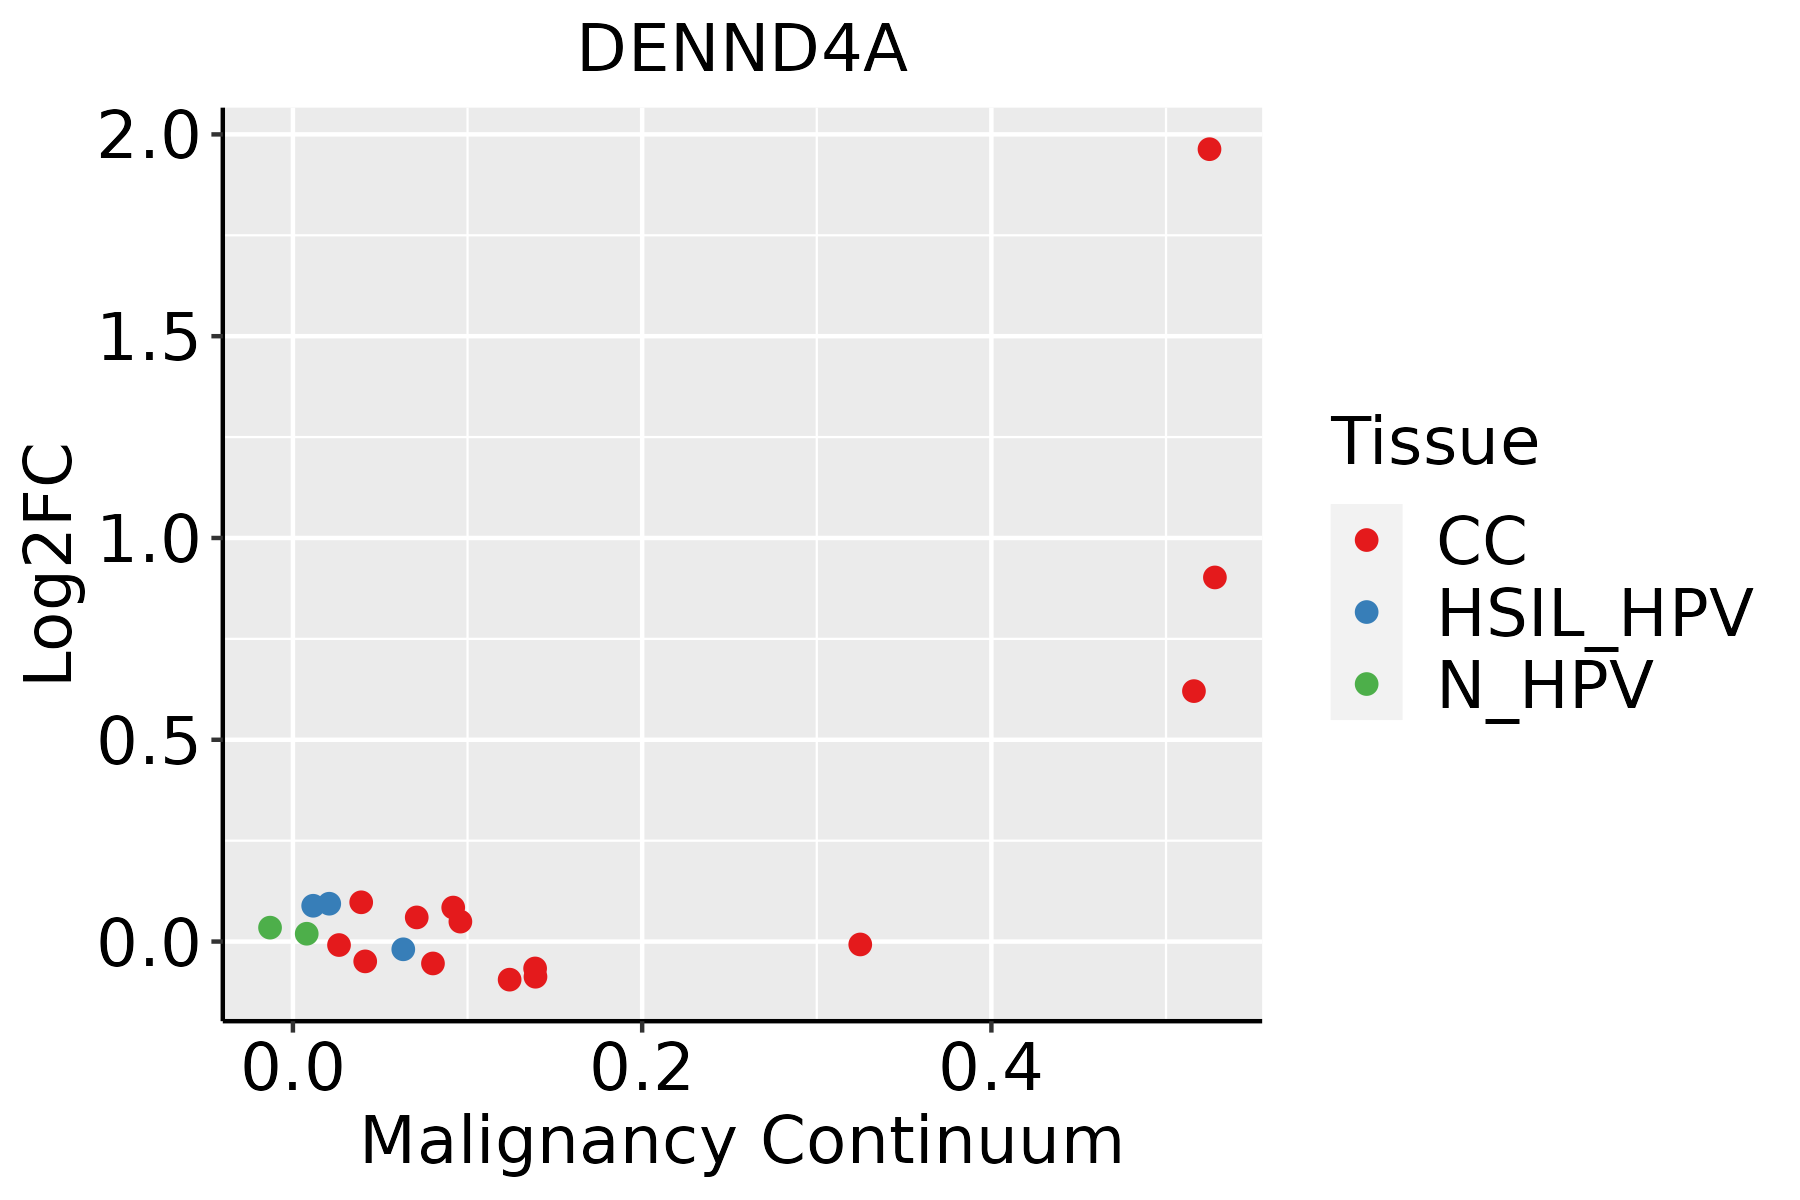 | CC: Cervix cancer |
| HSIL_HPV: HPV-infected high-grade squamous intraepithelial lesions |
| N_HPV: HPV-infected normal cervix |
| Colorectum (GSE201348) |  | FAP: Familial adenomatous polyposis |
| CRC: Colorectal cancer |
| Colorectum (HTA11) |  | AD: Adenomas |
| SER: Sessile serrated lesions |
| MSI-H: Microsatellite-high colorectal cancer |
| MSS: Microsatellite stable colorectal cancer |
| Endometrium | 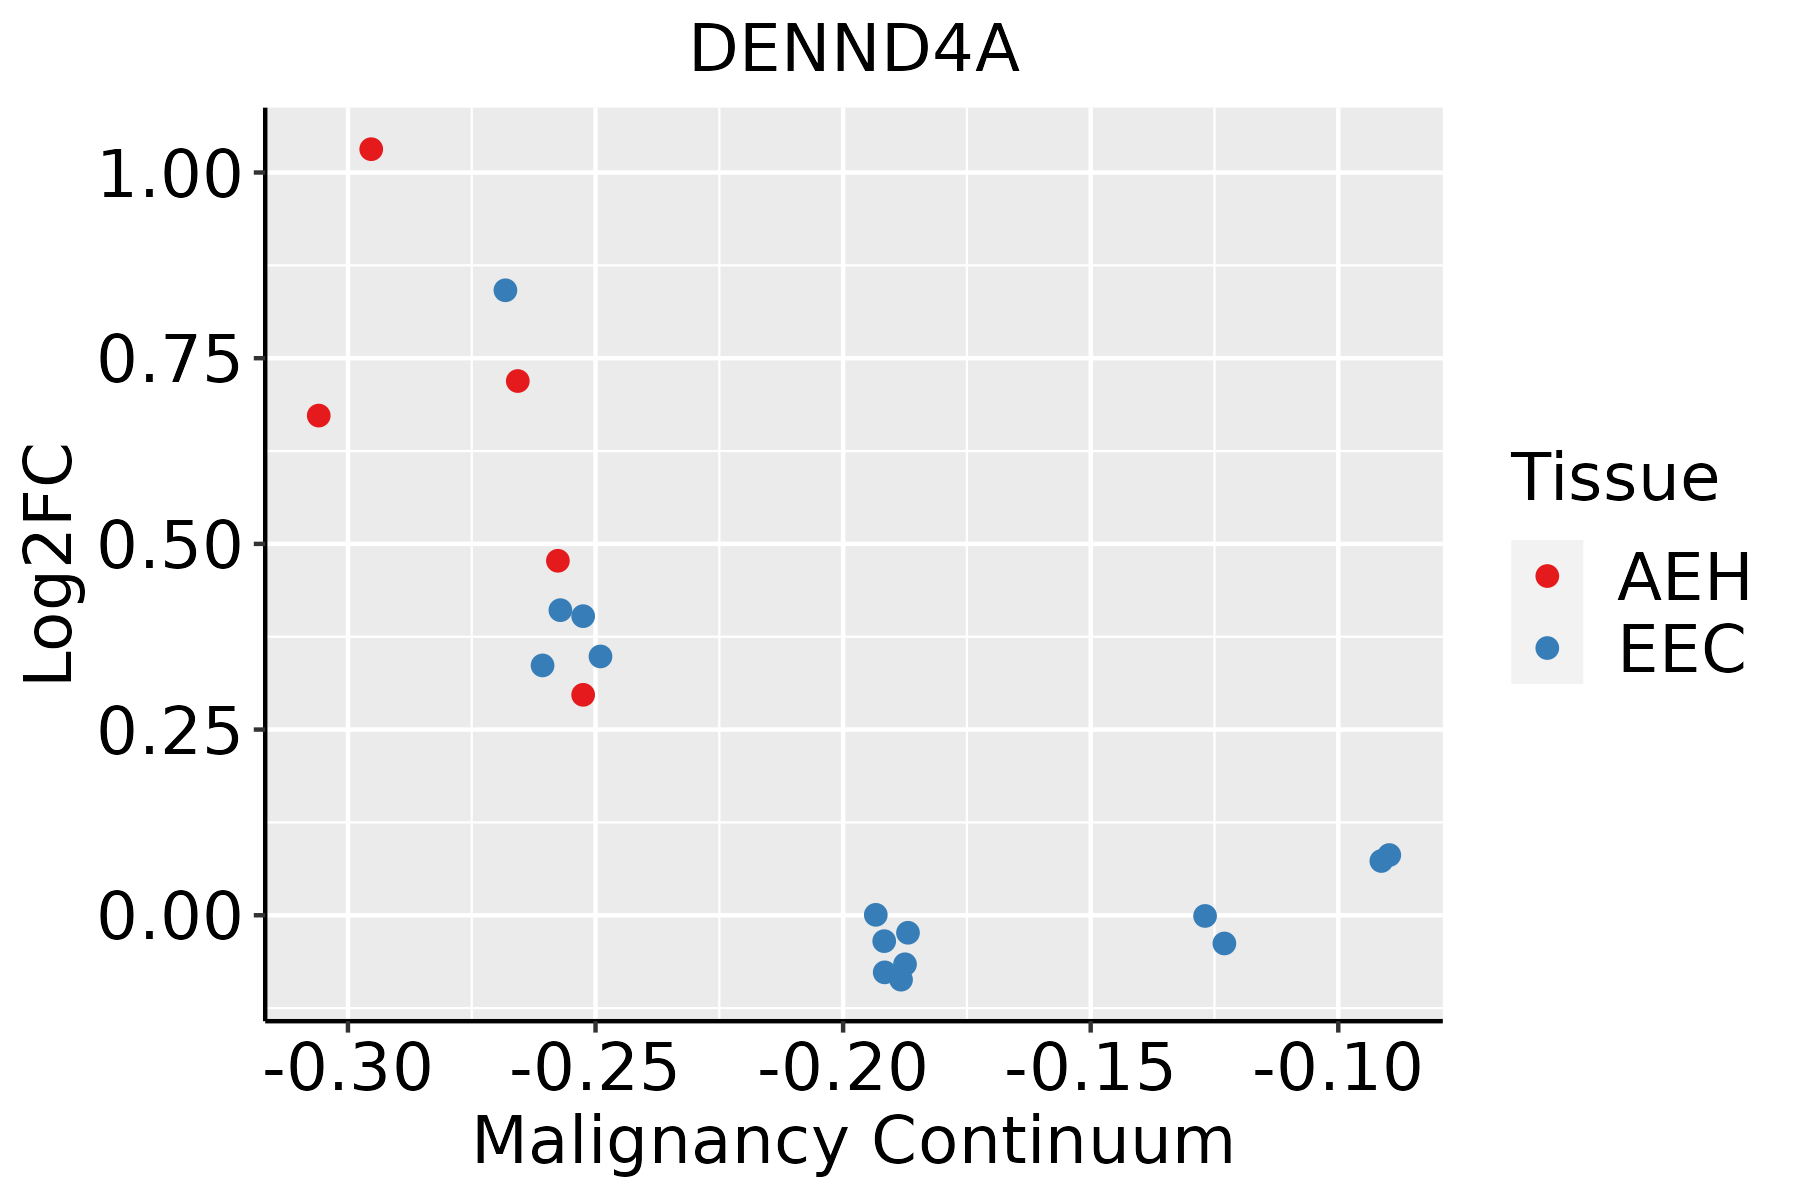 | AEH: Atypical endometrial hyperplasia |
| EEC: Endometrioid Cancer |
| Esophagus | 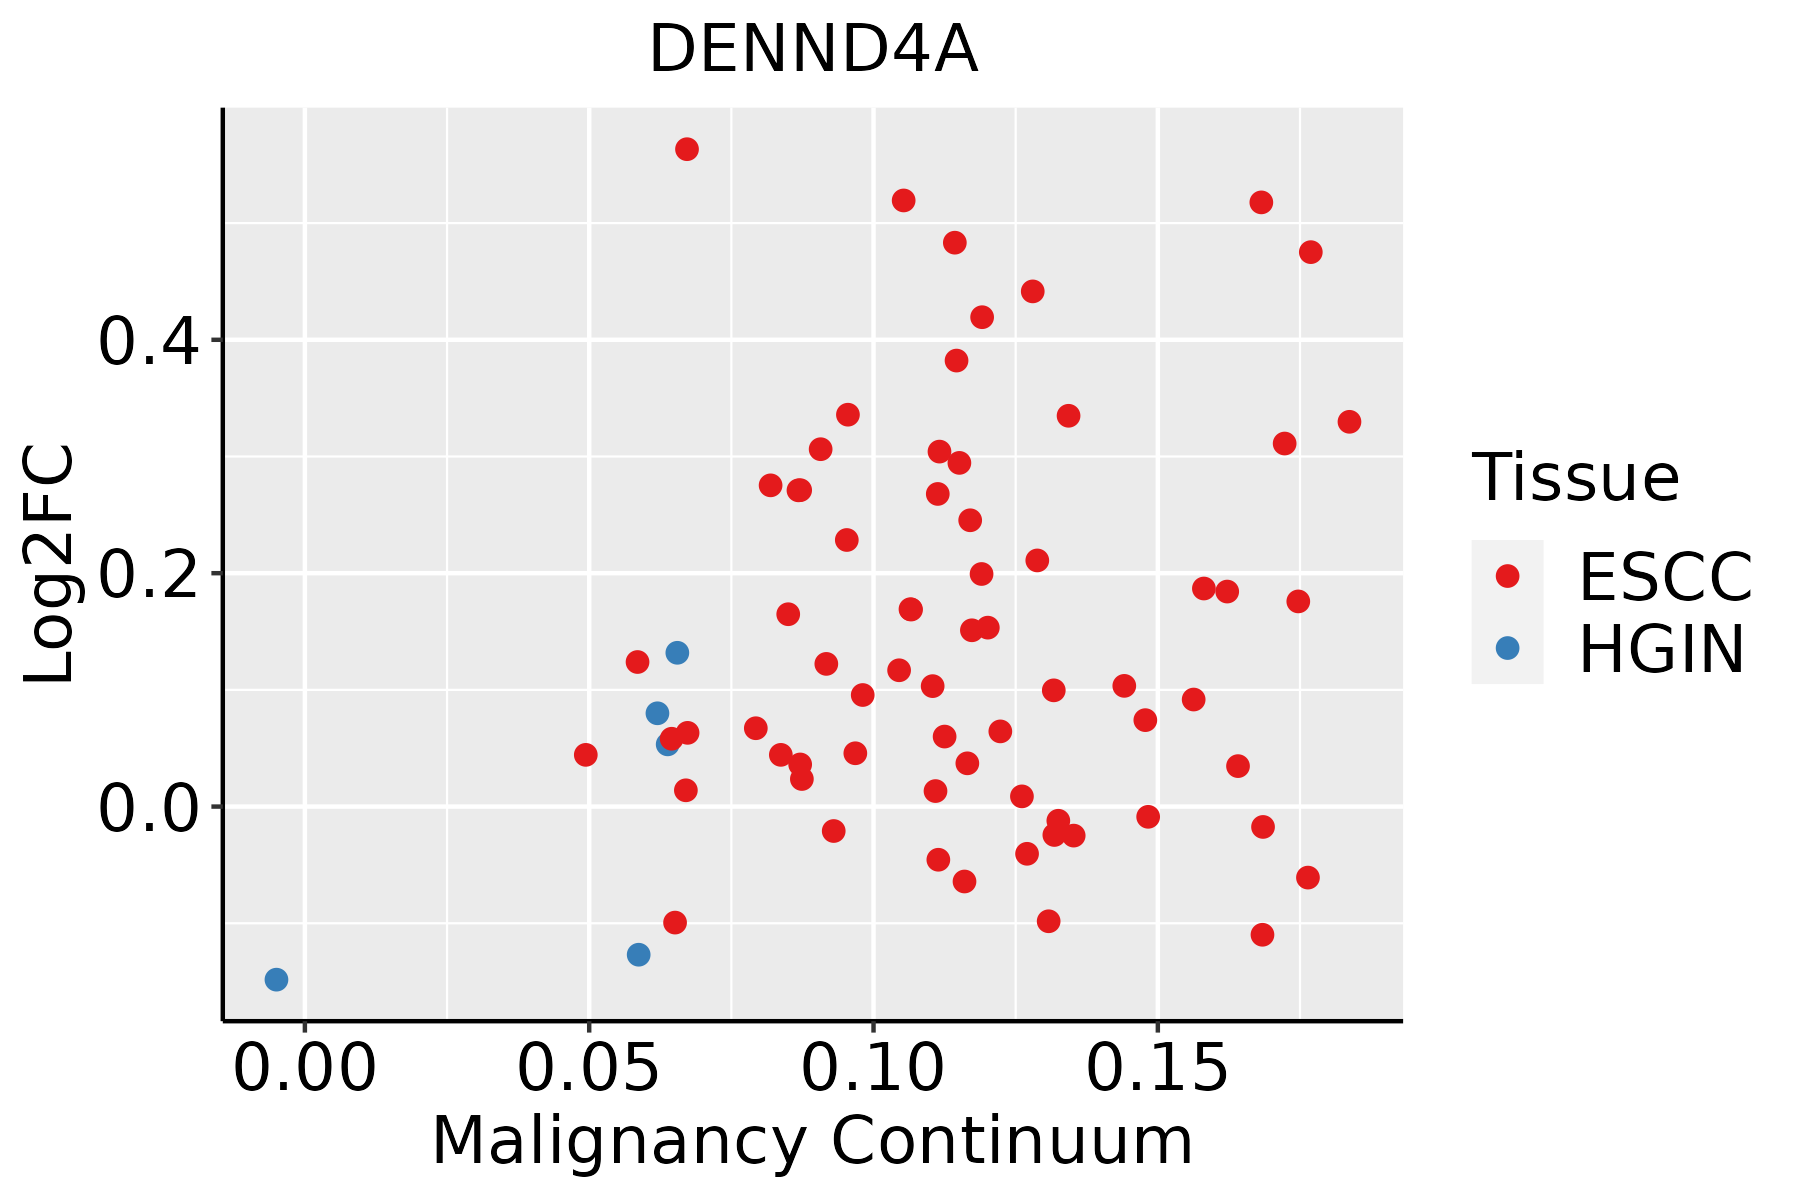 | ESCC: Esophageal squamous cell carcinoma |
| HGIN: High-grade intraepithelial neoplasias |
| LGIN: Low-grade intraepithelial neoplasias |
| Liver | 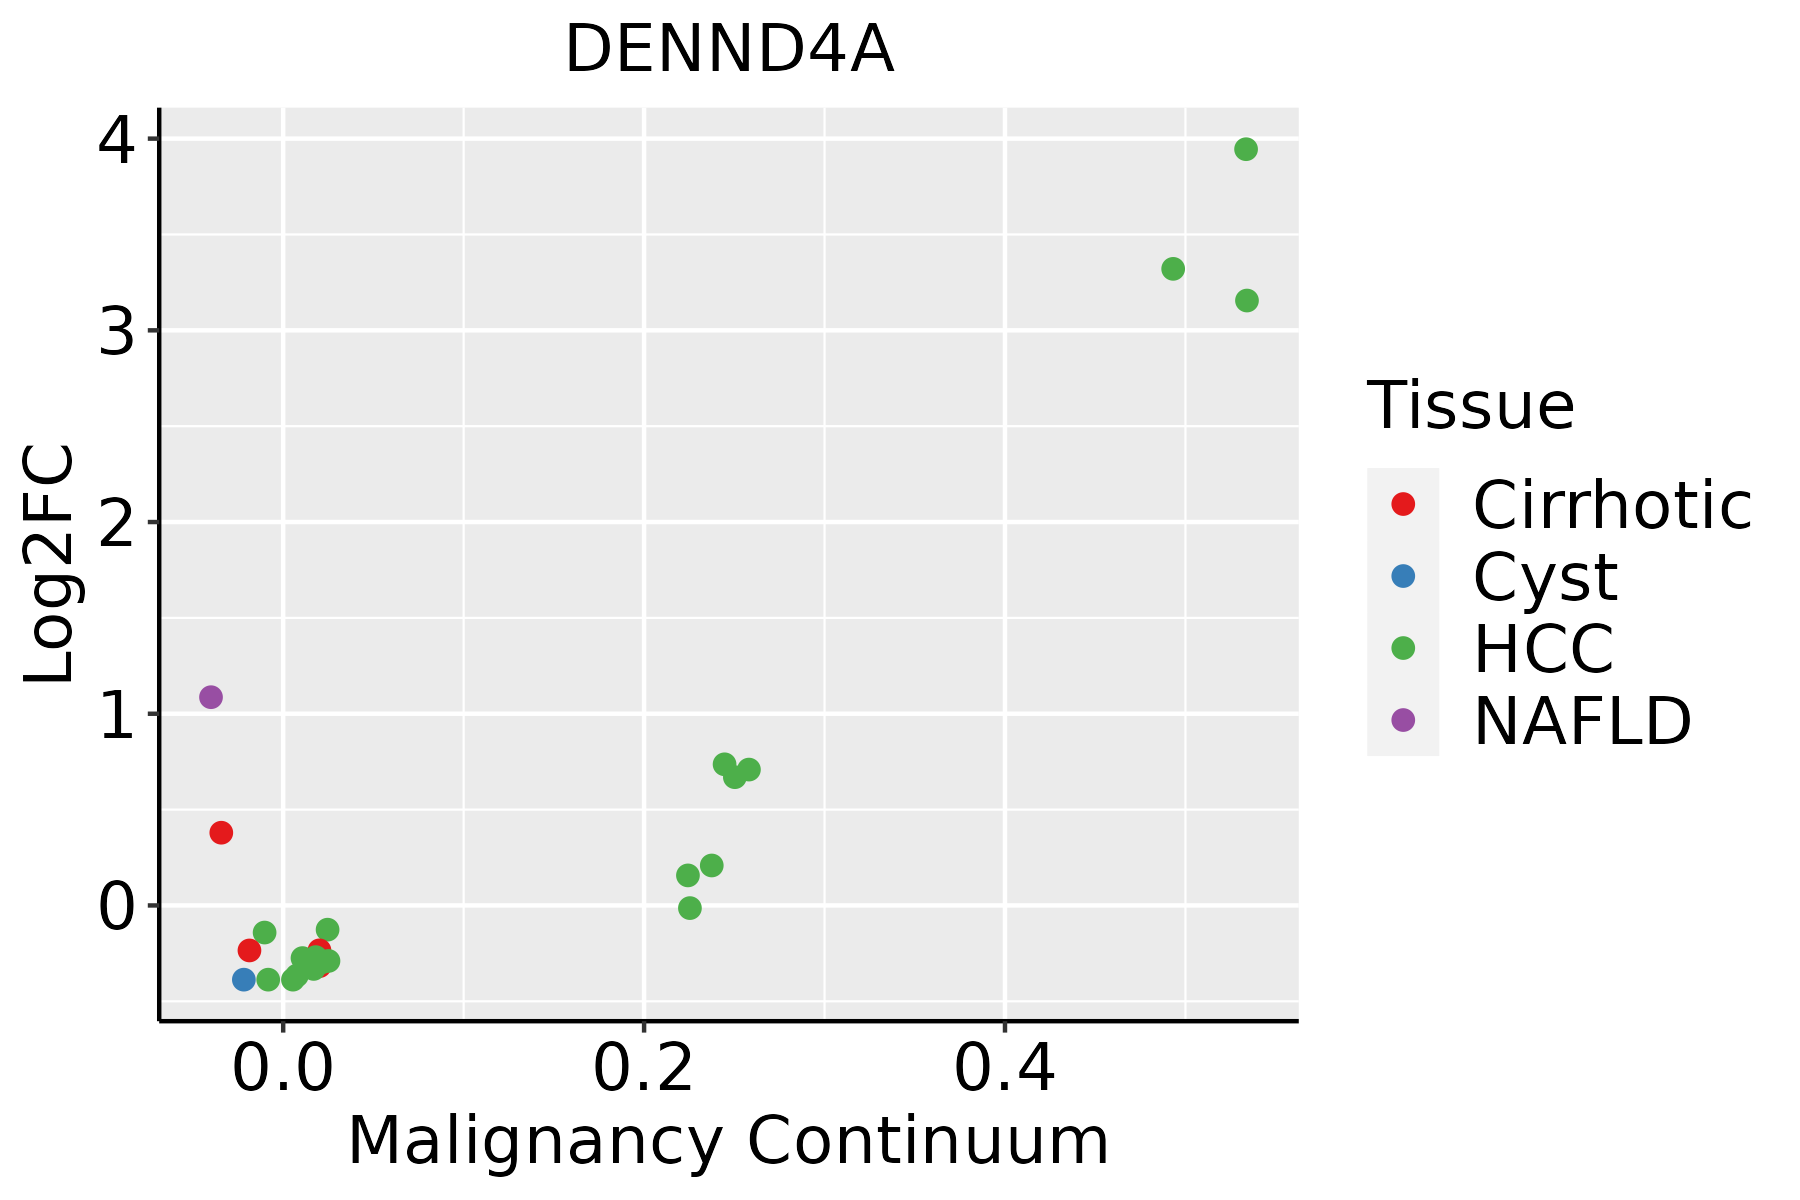 | HCC: Hepatocellular carcinoma |
| NAFLD: Non-alcoholic fatty liver disease |
| Lung | 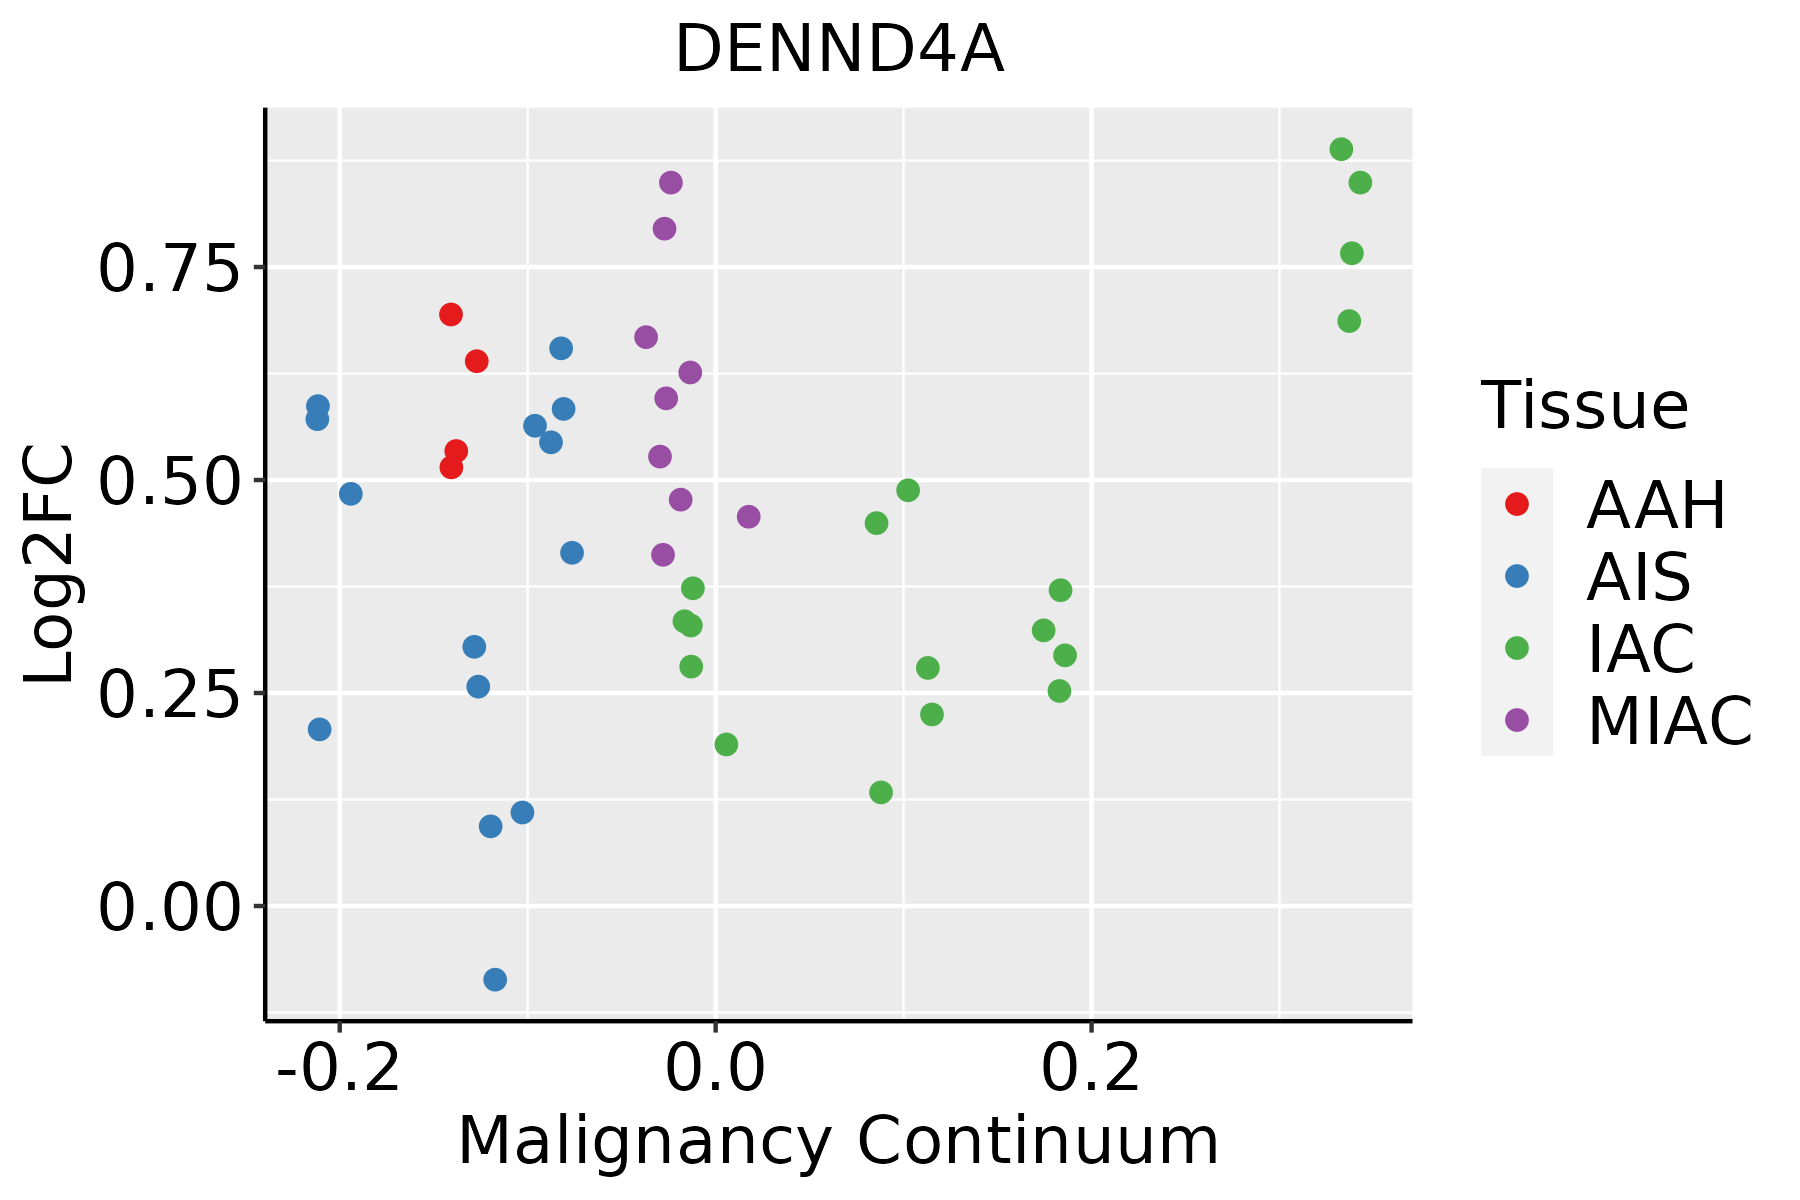 | AAH: Atypical adenomatous hyperplasia |
| AIS: Adenocarcinoma in situ |
| IAC: Invasive lung adenocarcinoma |
| MIA: Minimally invasive adenocarcinoma |
| Oral Cavity | 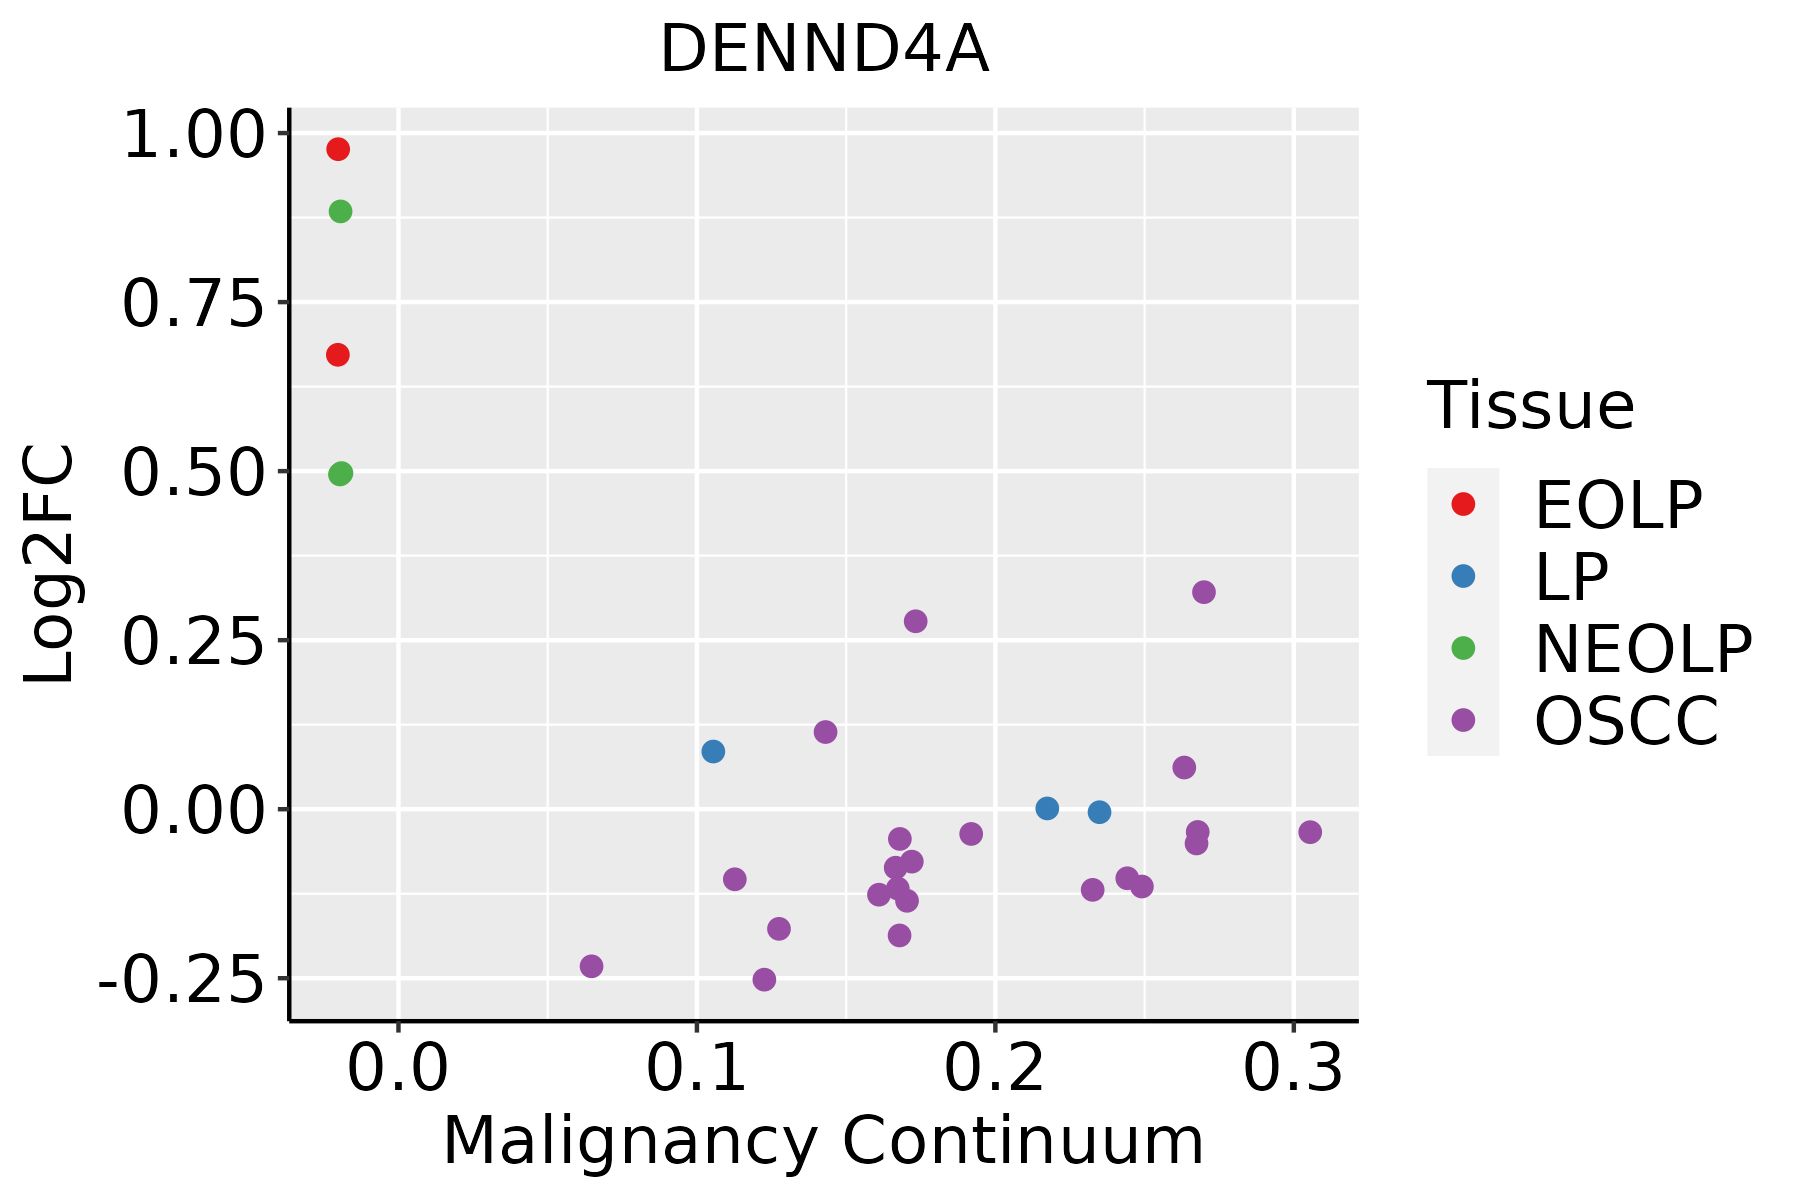 | EOLP: Erosive Oral lichen planus |
| LP: leukoplakia |
| NEOLP: Non-erosive oral lichen planus |
| OSCC: Oral squamous cell carcinoma |
| Prostate | 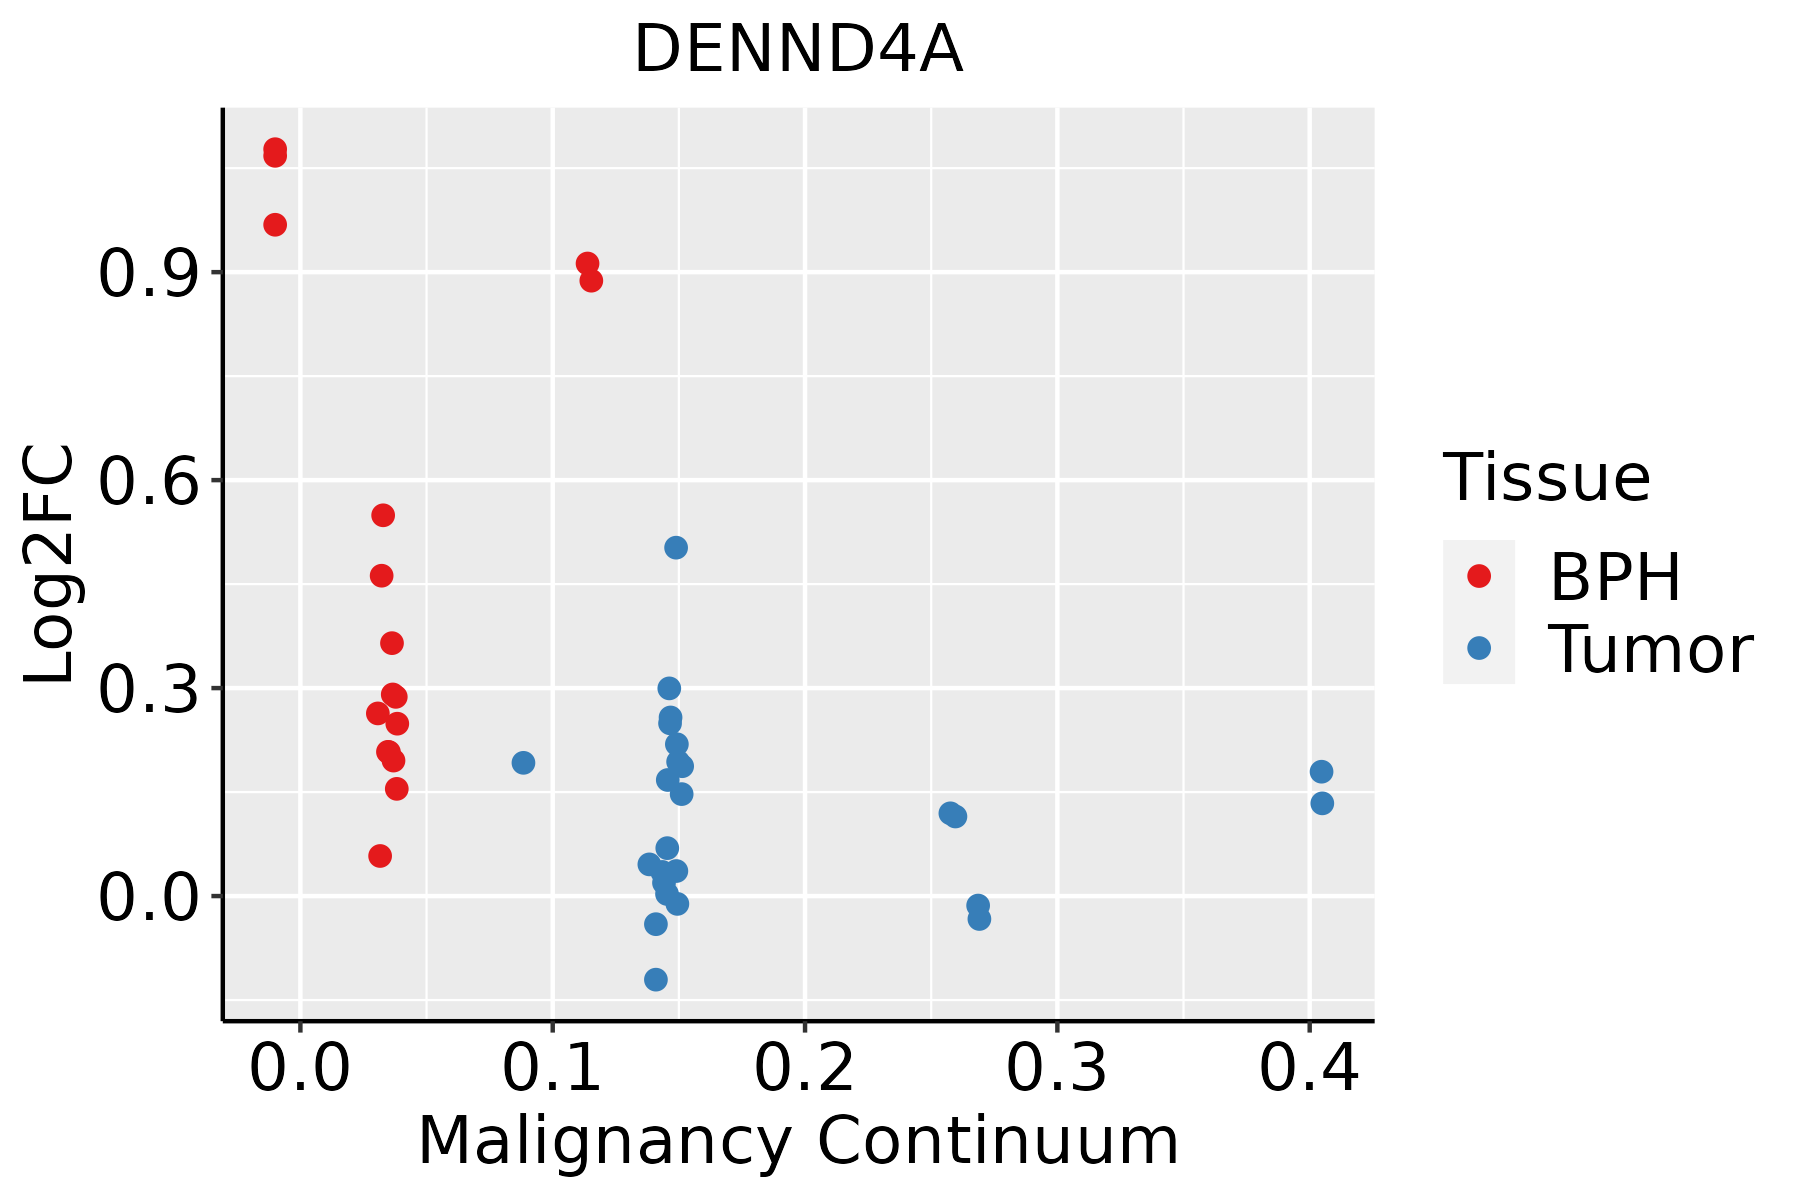 | BPH: Benign Prostatic Hyperplasia |
| Skin | 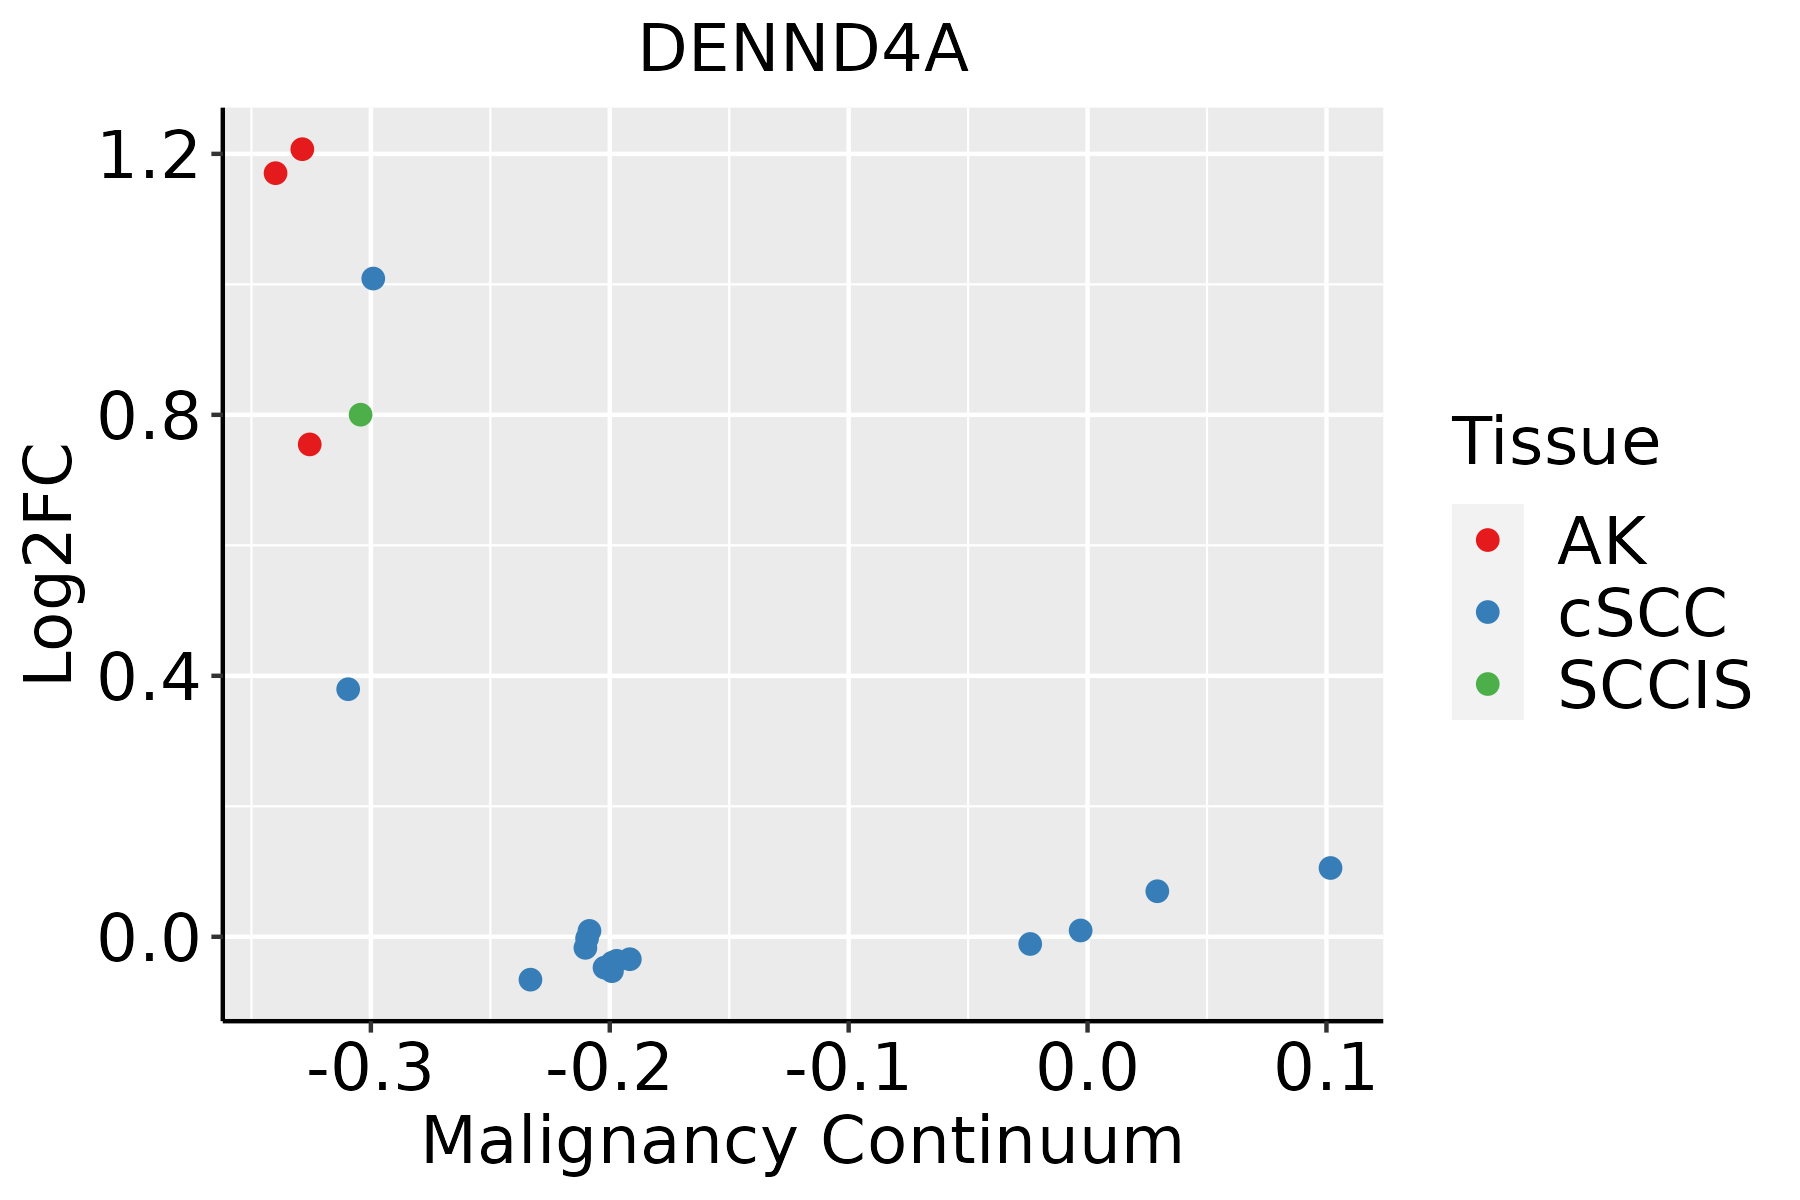 | AK: Actinic keratosis |
| cSCC: Cutaneous squamous cell carcinoma |
| SCCIS:squamous cell carcinoma in situ |
| GO ID | Tissue | Disease Stage | Description | Gene Ratio | Bg Ratio | pvalue | p.adjust | Count |
| GO:00510566 | Cervix | CC | regulation of small GTPase mediated signal transduction | 75/2311 | 302/18723 | 1.54e-09 | 1.74e-07 | 75 |
| GO:00072656 | Cervix | CC | Ras protein signal transduction | 79/2311 | 337/18723 | 9.49e-09 | 7.77e-07 | 79 |
| GO:00465785 | Cervix | CC | regulation of Ras protein signal transduction | 44/2311 | 189/18723 | 2.05e-05 | 3.73e-04 | 44 |
| GO:0007265 | Colorectum | AD | Ras protein signal transduction | 104/3918 | 337/18723 | 1.01e-05 | 2.35e-04 | 104 |
| GO:0051056 | Colorectum | AD | regulation of small GTPase mediated signal transduction | 94/3918 | 302/18723 | 1.81e-05 | 3.76e-04 | 94 |
| GO:0046578 | Colorectum | AD | regulation of Ras protein signal transduction | 56/3918 | 189/18723 | 2.85e-03 | 2.14e-02 | 56 |
| GO:00072651 | Colorectum | MSS | Ras protein signal transduction | 91/3467 | 337/18723 | 7.20e-05 | 1.21e-03 | 91 |
| GO:00510561 | Colorectum | MSS | regulation of small GTPase mediated signal transduction | 82/3467 | 302/18723 | 1.31e-04 | 1.99e-03 | 82 |
| GO:00510562 | Colorectum | FAP | regulation of small GTPase mediated signal transduction | 78/2622 | 302/18723 | 3.25e-08 | 2.85e-06 | 78 |
| GO:00072652 | Colorectum | FAP | Ras protein signal transduction | 80/2622 | 337/18723 | 9.61e-07 | 4.33e-05 | 80 |
| GO:00465781 | Colorectum | FAP | regulation of Ras protein signal transduction | 47/2622 | 189/18723 | 4.67e-05 | 9.60e-04 | 47 |
| GO:00510563 | Colorectum | CRC | regulation of small GTPase mediated signal transduction | 69/2078 | 302/18723 | 3.34e-09 | 9.08e-07 | 69 |
| GO:00072653 | Colorectum | CRC | Ras protein signal transduction | 70/2078 | 337/18723 | 1.49e-07 | 1.66e-05 | 70 |
| GO:00465782 | Colorectum | CRC | regulation of Ras protein signal transduction | 43/2078 | 189/18723 | 3.26e-06 | 1.47e-04 | 43 |
| GO:00510567 | Endometrium | AEH | regulation of small GTPase mediated signal transduction | 59/2100 | 302/18723 | 1.43e-05 | 3.03e-04 | 59 |
| GO:00072657 | Endometrium | AEH | Ras protein signal transduction | 63/2100 | 337/18723 | 3.09e-05 | 5.66e-04 | 63 |
| GO:00465786 | Endometrium | AEH | regulation of Ras protein signal transduction | 36/2100 | 189/18723 | 1.01e-03 | 8.97e-03 | 36 |
| GO:005105612 | Endometrium | EEC | regulation of small GTPase mediated signal transduction | 61/2168 | 302/18723 | 9.42e-06 | 2.08e-04 | 61 |
| GO:000726513 | Endometrium | EEC | Ras protein signal transduction | 64/2168 | 337/18723 | 4.31e-05 | 7.10e-04 | 64 |
| GO:004657813 | Endometrium | EEC | regulation of Ras protein signal transduction | 37/2168 | 189/18723 | 9.23e-04 | 8.32e-03 | 37 |
| Hugo Symbol | Variant Class | Variant Classification | dbSNP RS | HGVSc | HGVSp | HGVSp Short | SWISSPROT | BIOTYPE | SIFT | PolyPhen | Tumor Sample Barcode | Tissue | Histology | Sex | Age | Stage | Therapy Types | Drugs | Outcome |
| DENND4A | SNV | Missense_Mutation | | c.4609N>C | p.Glu1537Gln | p.E1537Q | Q7Z401 | protein_coding | deleterious(0) | probably_damaging(0.99) | TCGA-A2-A0CX-01 | Breast | breast invasive carcinoma | Female | <65 | I/II | Chemotherapy | adriamycin | SD |
| DENND4A | SNV | Missense_Mutation | rs371626371 | c.2208N>A | p.Phe736Leu | p.F736L | Q7Z401 | protein_coding | tolerated(0.09) | possibly_damaging(0.703) | TCGA-A2-A4S3-01 | Breast | breast invasive carcinoma | Female | <65 | I/II | Unknown | Unknown | SD |
| DENND4A | SNV | Missense_Mutation | novel | c.4988C>A | p.Ser1663Tyr | p.S1663Y | Q7Z401 | protein_coding | tolerated(0.08) | benign(0.241) | TCGA-AN-A046-01 | Breast | breast invasive carcinoma | Female | >=65 | I/II | Unknown | Unknown | SD |
| DENND4A | SNV | Missense_Mutation | novel | c.1471N>G | p.Thr491Ala | p.T491A | Q7Z401 | protein_coding | deleterious(0.01) | probably_damaging(0.999) | TCGA-BH-A18G-01 | Breast | breast invasive carcinoma | Female | >=65 | I/II | Unknown | Unknown | SD |
| DENND4A | SNV | Missense_Mutation | | c.4289N>G | p.Gln1430Arg | p.Q1430R | Q7Z401 | protein_coding | tolerated(0.6) | benign(0.081) | TCGA-D8-A1JK-01 | Breast | breast invasive carcinoma | Female | >=65 | I/II | Unknown | Unknown | SD |
| DENND4A | SNV | Missense_Mutation | rs368880135 | c.2531N>G | p.Asn844Ser | p.N844S | Q7Z401 | protein_coding | deleterious(0.04) | probably_damaging(0.996) | TCGA-EW-A1PA-01 | Breast | breast invasive carcinoma | Female | <65 | I/II | Chemotherapy | cyclophosphamide | SD |
| DENND4A | insertion | Nonsense_Mutation | novel | c.668_669insTTTCAGTAGTAAGGTAACATGAGAATAGCACTATATAGTTCTTAGAT | p.Leu226SerfsTer5 | p.L226Sfs*5 | Q7Z401 | protein_coding | | | TCGA-A8-A07J-01 | Breast | breast invasive carcinoma | Female | <65 | I/II | Chemotherapy | 5-fluorouracil | CR |
| DENND4A | insertion | Frame_Shift_Ins | novel | c.1176_1177insAATTTAGC | p.Phe393AsnfsTer11 | p.F393Nfs*11 | Q7Z401 | protein_coding | | | TCGA-A8-A09Z-01 | Breast | breast invasive carcinoma | Female | >=65 | I/II | Unknown | Unknown | SD |
| DENND4A | insertion | Nonsense_Mutation | novel | c.2385_2386insCCCAGCACCTTGGGAAGCTAAGGTGG | p.Val796ProfsTer7 | p.V796Pfs*7 | Q7Z401 | protein_coding | | | TCGA-AR-A0TY-01 | Breast | breast invasive carcinoma | Female | <65 | I/II | Unspecific | Paclitaxel | PD |
| DENND4A | deletion | Frame_Shift_Del | novel | c.1851delN | p.Asn617LysfsTer2 | p.N617Kfs*2 | Q7Z401 | protein_coding | | | TCGA-D8-A27V-01 | Breast | breast invasive carcinoma | Female | <65 | I/II | Hormone Therapy | tamoxiphen | SD |


