
|
|||||
|
 | |
| |
| |
| |
| |
| |
|
Gene: DENND2C |
Gene summary for DENND2C |
| Gene information | Species | Human | Gene symbol | DENND2C | Gene ID | 163259 |
| Gene name | DENN domain containing 2C | |
| Gene Alias | dJ1156J9.1 | |
| Cytomap | 1p13.2 | |
| Gene Type | protein-coding | GO ID | GO:0008150 | UniProtAcc | Q68D51 |
Top |
Malignant transformation analysis |
| Identification of the aberrant gene expression in precancerous and cancerous lesions by comparing the gene expression of stem-like cells in diseased tissues with normal stem cells |
| Entrez ID | Symbol | Replicates | Species | Organ | Tissue | Adj P-value | Log2FC | Malignancy |
| 163259 | DENND2C | CA_HPV_2 | Human | Cervix | CC | 1.19e-05 | 3.75e-01 | 0.0391 |
| 163259 | DENND2C | CCI_1 | Human | Cervix | CC | 4.53e-24 | 1.82e+00 | 0.528 |
| 163259 | DENND2C | CCI_2 | Human | Cervix | CC | 2.13e-02 | 4.03e-01 | 0.5249 |
| 163259 | DENND2C | CCI_3 | Human | Cervix | CC | 4.63e-12 | 8.12e-01 | 0.516 |
| 163259 | DENND2C | sample3 | Human | Cervix | CC | 4.10e-10 | 3.21e-01 | 0.1387 |
| 163259 | DENND2C | T1 | Human | Cervix | CC | 3.11e-02 | 1.96e-01 | 0.0918 |
| 163259 | DENND2C | T3 | Human | Cervix | CC | 1.06e-13 | 3.47e-01 | 0.1389 |
| 163259 | DENND2C | LZE4T | Human | Esophagus | ESCC | 3.24e-14 | 3.96e-01 | 0.0811 |
| 163259 | DENND2C | LZE7T | Human | Esophagus | ESCC | 9.82e-05 | 2.65e-01 | 0.0667 |
| 163259 | DENND2C | LZE8T | Human | Esophagus | ESCC | 2.37e-02 | 1.79e-01 | 0.067 |
| 163259 | DENND2C | LZE20T | Human | Esophagus | ESCC | 3.55e-04 | 1.75e-01 | 0.0662 |
| 163259 | DENND2C | LZE24T | Human | Esophagus | ESCC | 2.39e-09 | 3.75e-01 | 0.0596 |
| 163259 | DENND2C | LZE21T | Human | Esophagus | ESCC | 4.73e-03 | 4.80e-01 | 0.0655 |
| 163259 | DENND2C | P1T-E | Human | Esophagus | ESCC | 5.98e-10 | 6.51e-01 | 0.0875 |
| 163259 | DENND2C | P2T-E | Human | Esophagus | ESCC | 3.44e-10 | 8.73e-02 | 0.1177 |
| 163259 | DENND2C | P4T-E | Human | Esophagus | ESCC | 1.68e-05 | 2.05e-01 | 0.1323 |
| 163259 | DENND2C | P5T-E | Human | Esophagus | ESCC | 7.31e-20 | 4.90e-01 | 0.1327 |
| 163259 | DENND2C | P8T-E | Human | Esophagus | ESCC | 6.01e-04 | 1.08e-01 | 0.0889 |
| 163259 | DENND2C | P9T-E | Human | Esophagus | ESCC | 5.17e-21 | 5.83e-01 | 0.1131 |
| 163259 | DENND2C | P10T-E | Human | Esophagus | ESCC | 3.65e-03 | 1.65e-02 | 0.116 |
| Page: 1 2 3 4 |
| Tissue | Expression Dynamics | Abbreviation |
| Cervix | 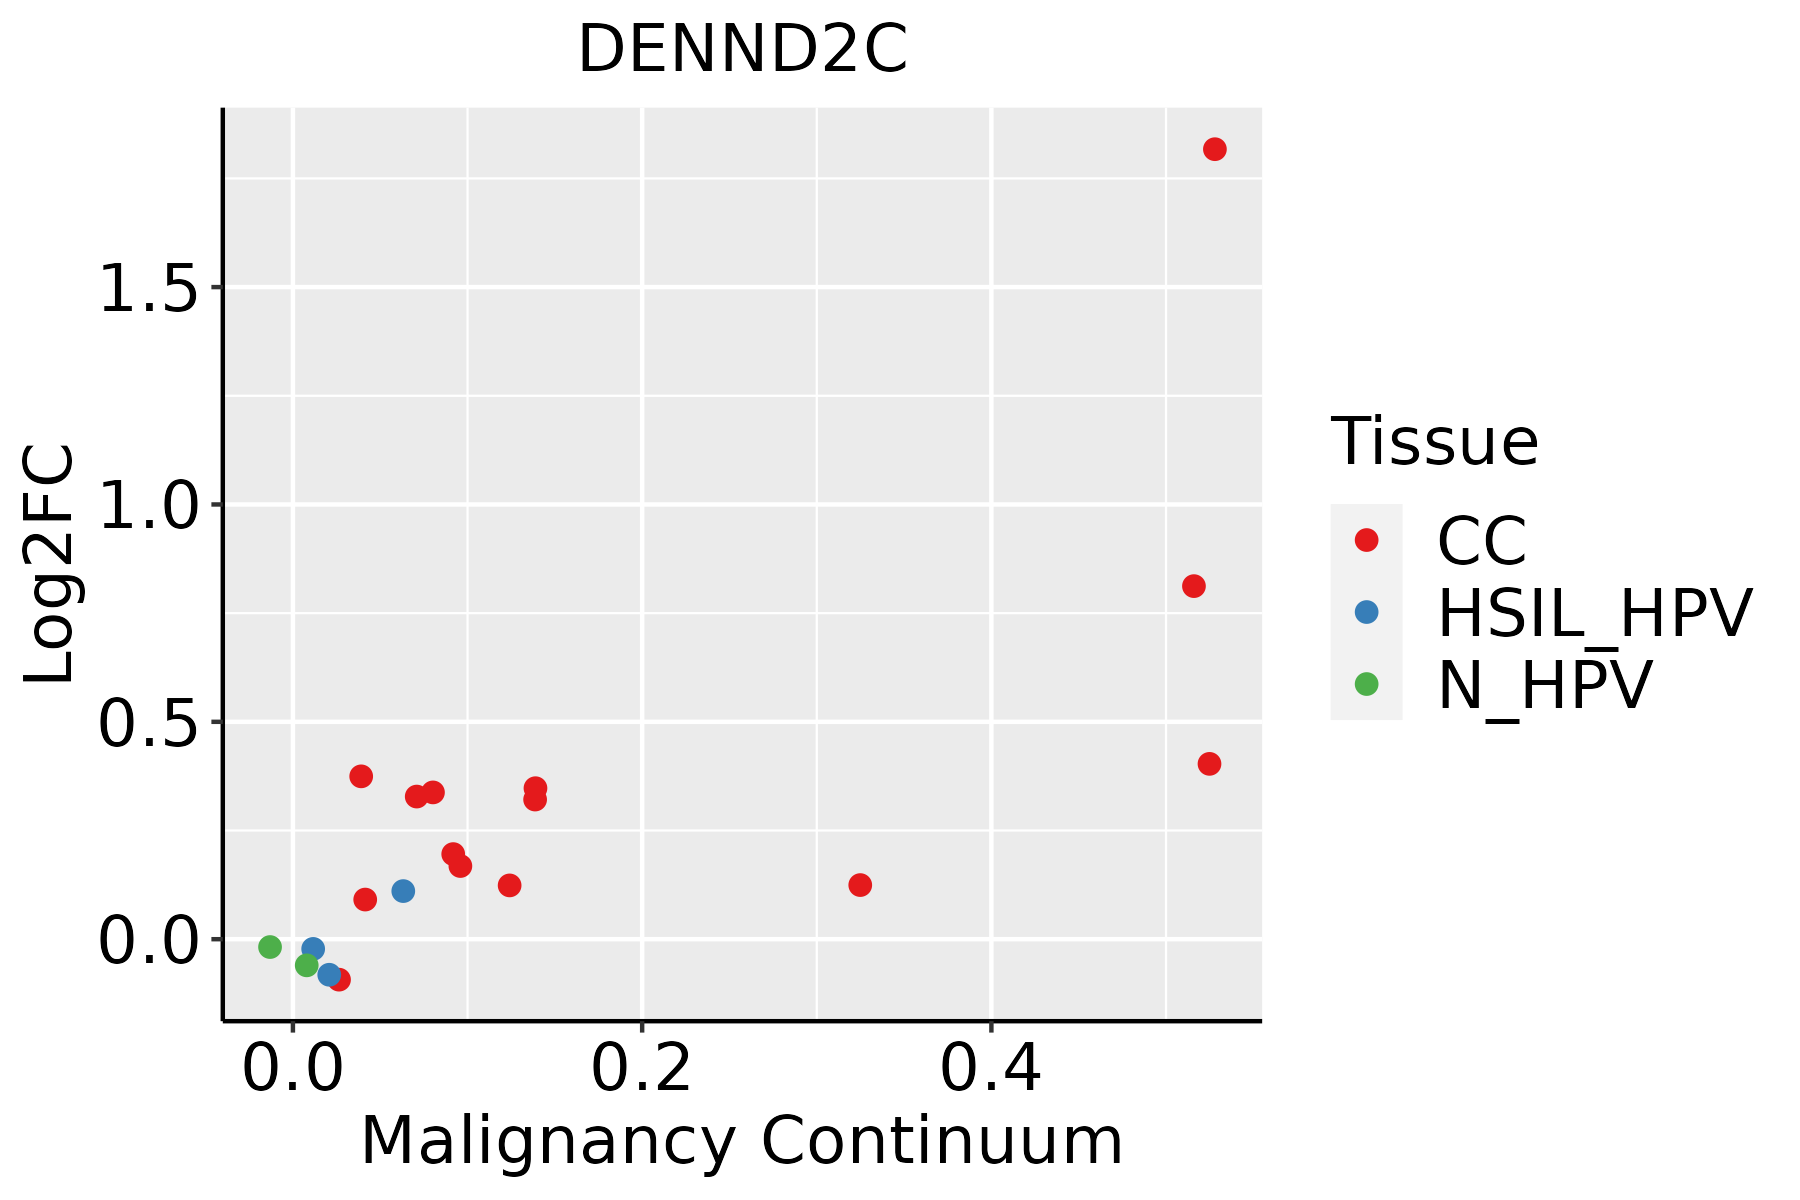 | CC: Cervix cancer |
| HSIL_HPV: HPV-infected high-grade squamous intraepithelial lesions | ||
| N_HPV: HPV-infected normal cervix | ||
| Esophagus | 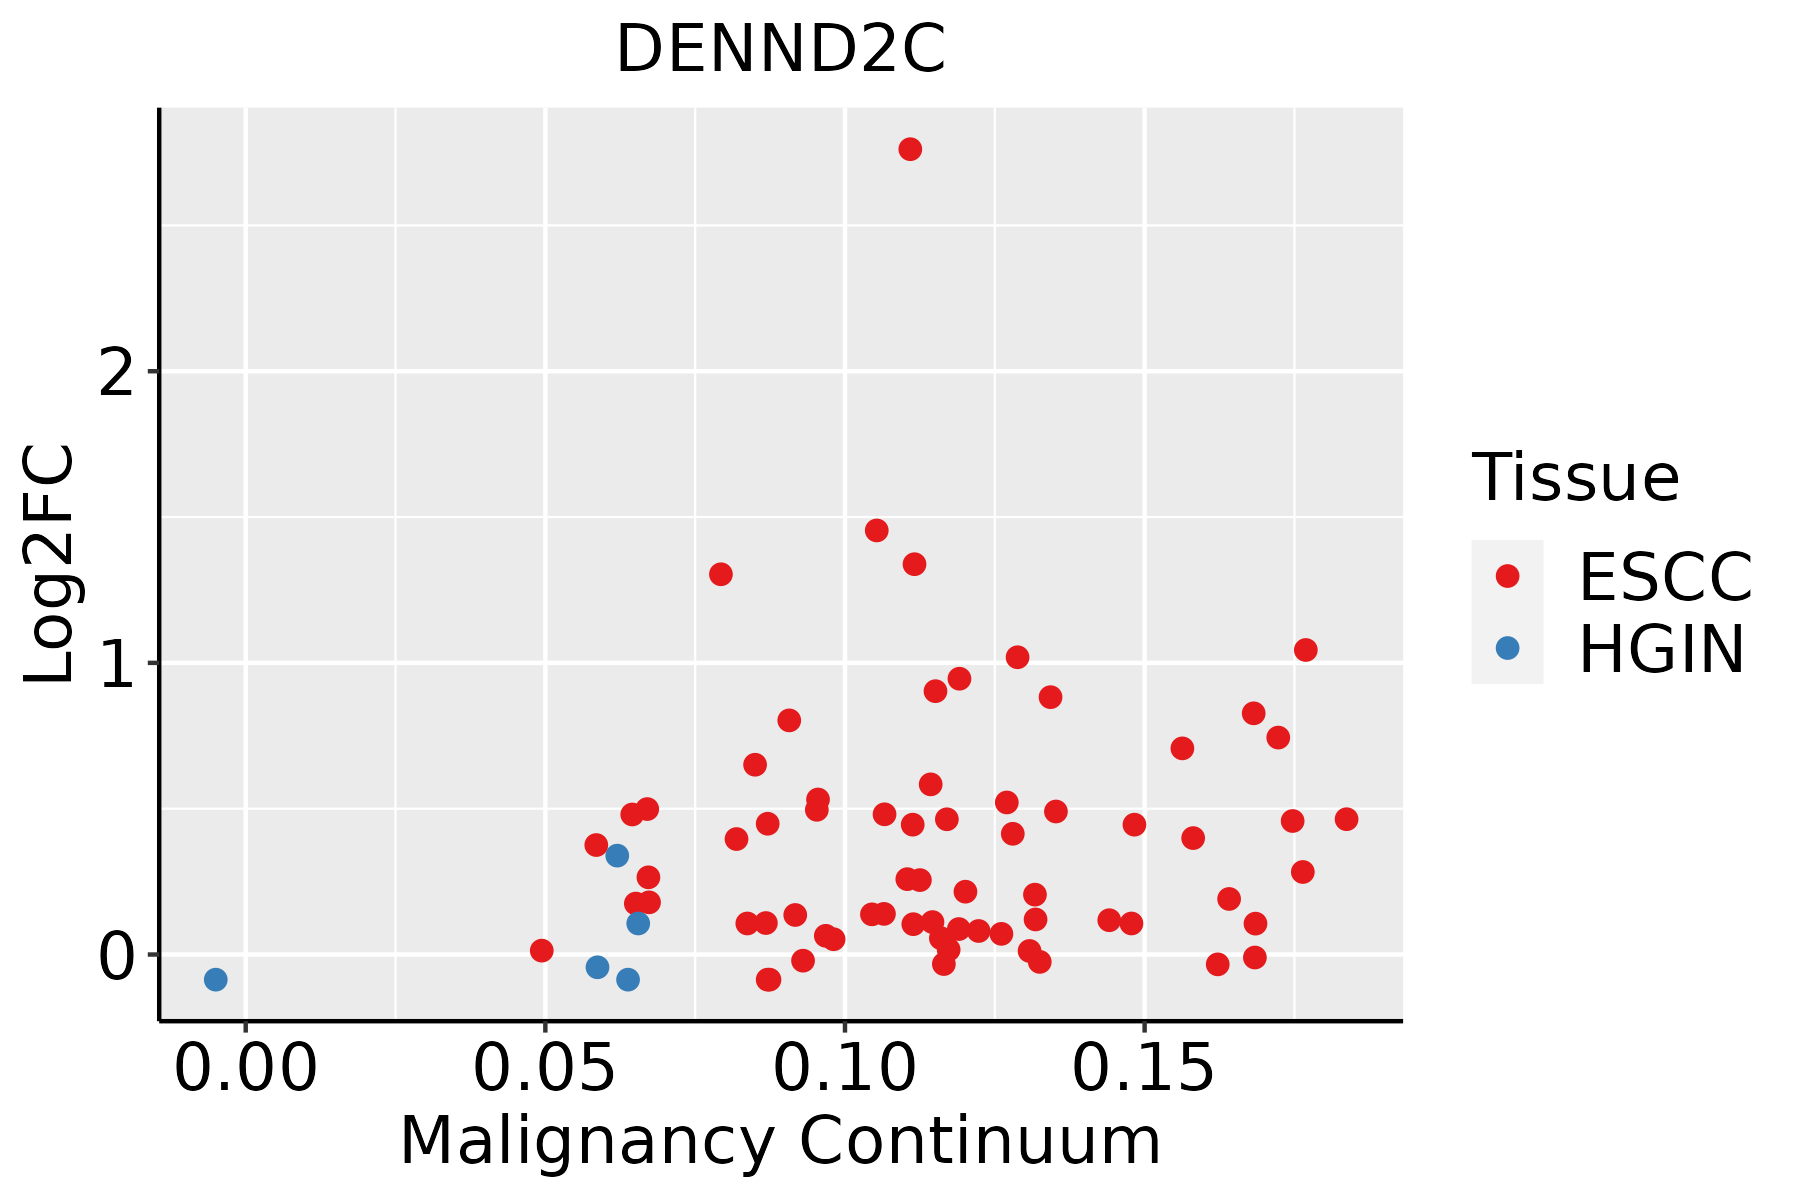 | ESCC: Esophageal squamous cell carcinoma |
| HGIN: High-grade intraepithelial neoplasias | ||
| LGIN: Low-grade intraepithelial neoplasias | ||
| Oral Cavity | 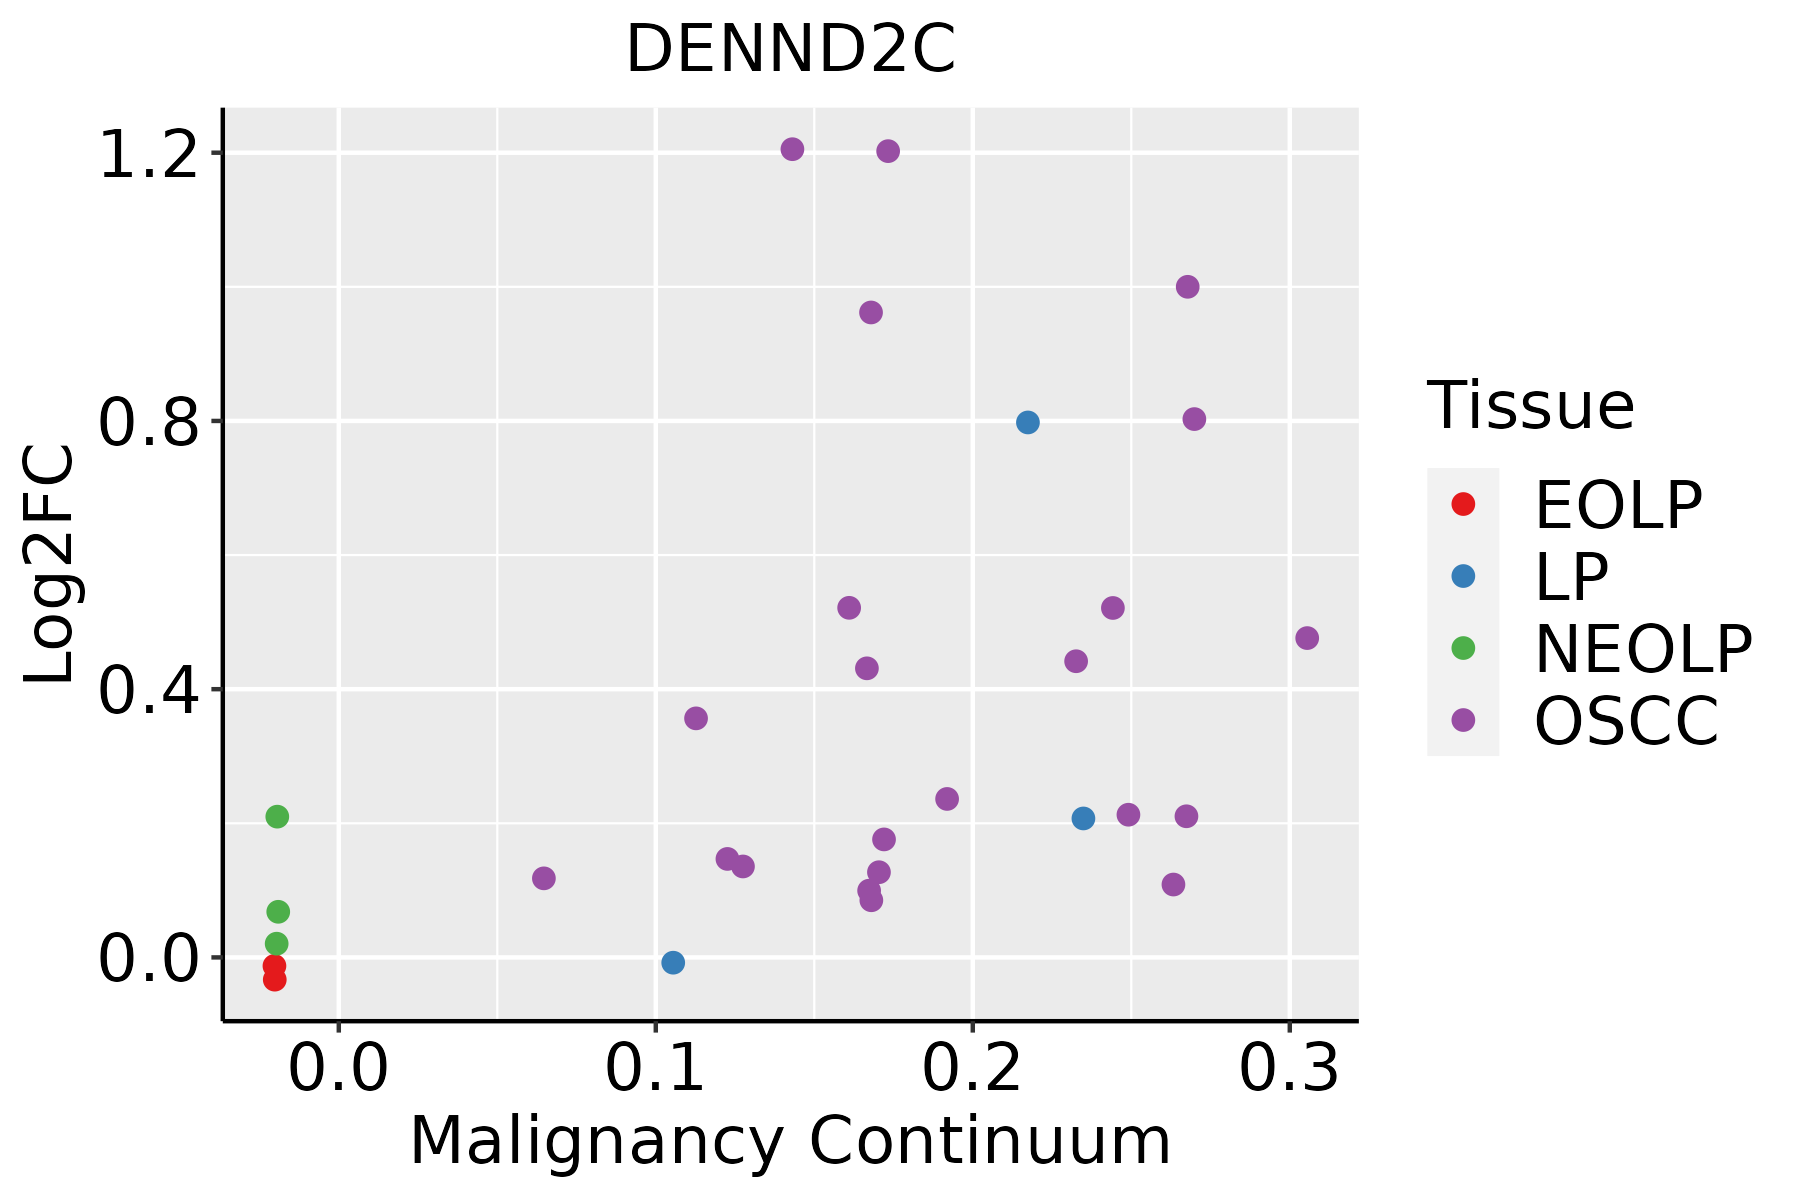 | EOLP: Erosive Oral lichen planus |
| LP: leukoplakia | ||
| NEOLP: Non-erosive oral lichen planus | ||
| OSCC: Oral squamous cell carcinoma | ||
| Skin | 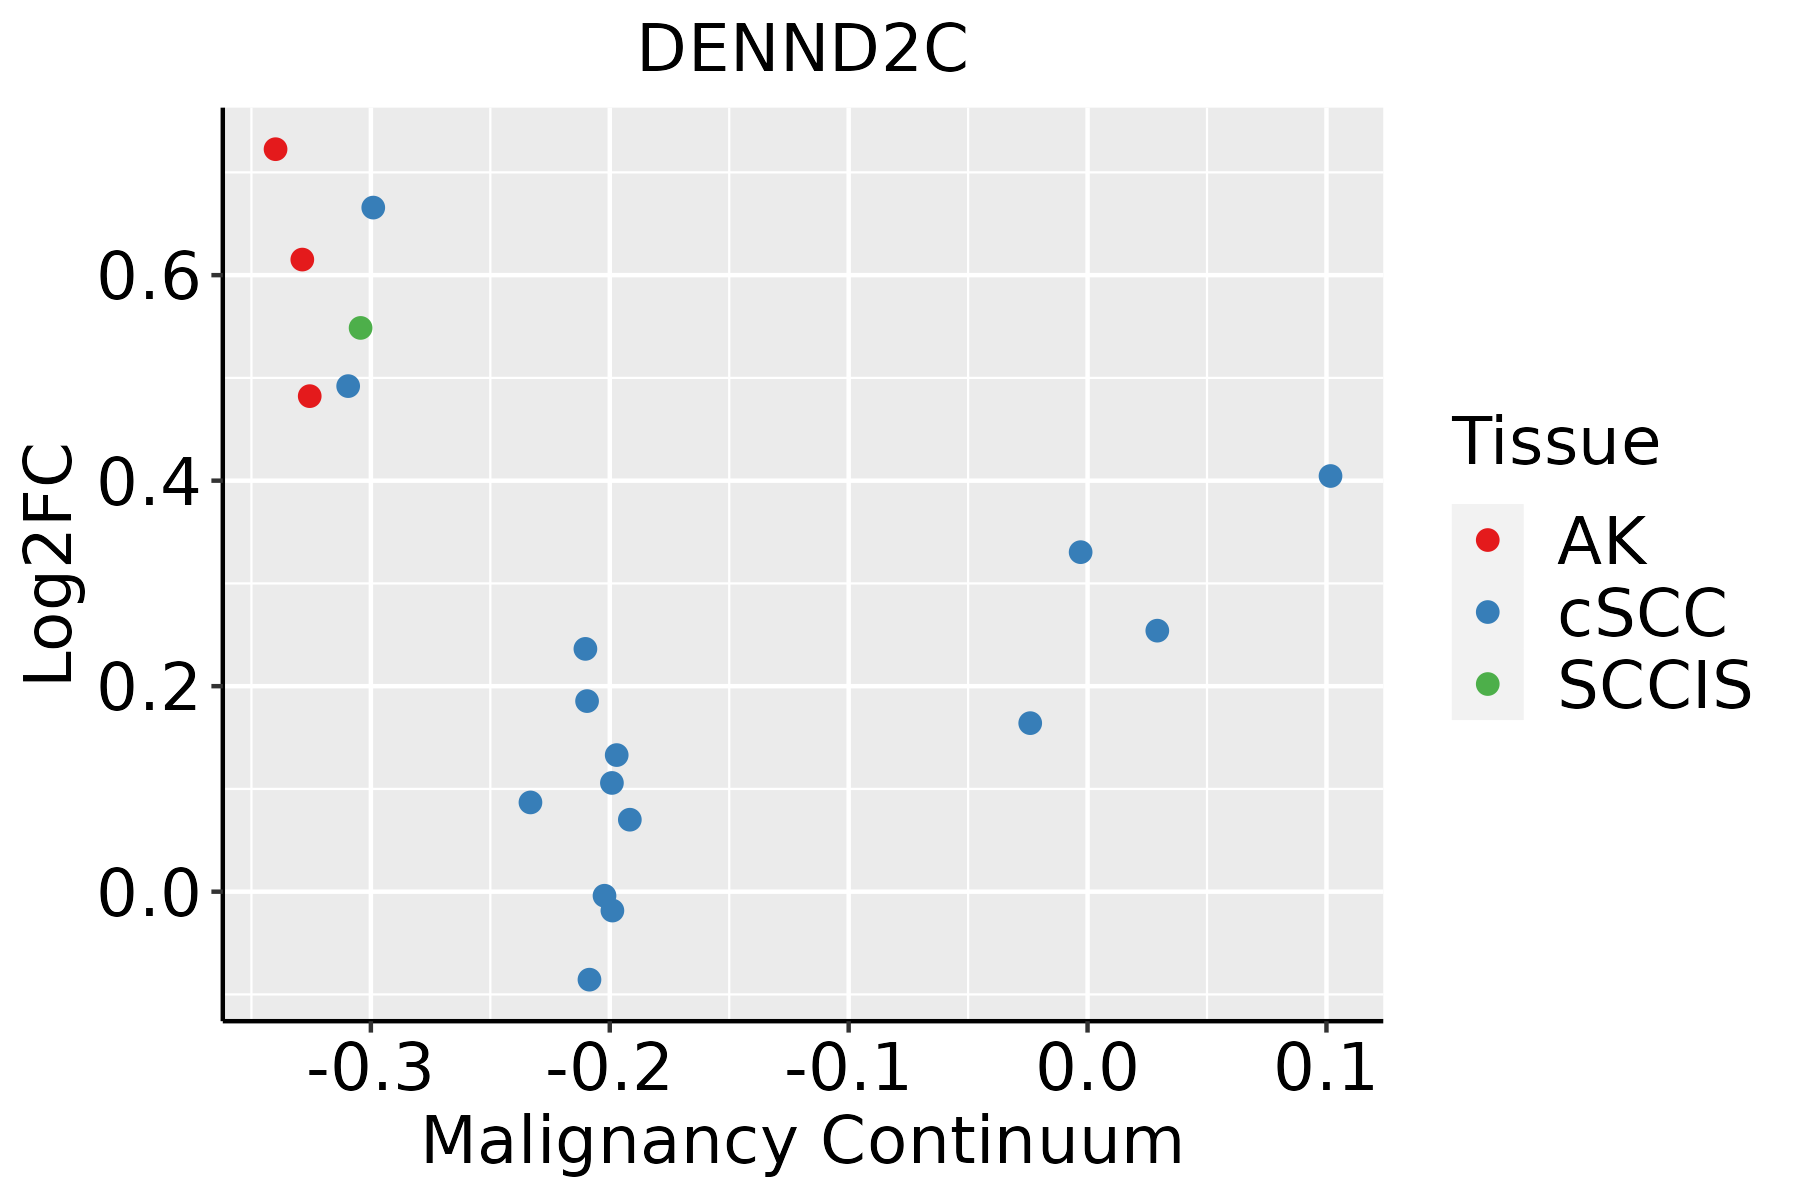 | AK: Actinic keratosis |
| cSCC: Cutaneous squamous cell carcinoma | ||
| SCCIS:squamous cell carcinoma in situ |
| ∗log2FC in expression of this searched gene in stem-like cells from each diseased tissue sample relative to stem-like cells in normal samples in each tissue plotted against the malignancy continuum. Samples are colored based on if they are from different disease stage. |
Top |
Malignant transformation related pathway analysis |
| Find out the enriched GO biological processes and KEGG pathways involved in transition from healthy to precancer to cancer |
| Tissue | Disease Stage | Enriched GO biological Processes |
| Colorectum | AD |  |
| Colorectum | SER |  |
| Colorectum | MSS |  |
| Colorectum | MSI-H |  |
| Colorectum | FAP |  |
| ∗Top 15 enriched GO BP terms are showed in the bar plot of each disease state in each tissue. Each row represents a significant GO biological process which is colored according to the -log10(p.adjust). |
| Page: 1 2 3 4 5 6 7 8 9 |
| GO ID | Tissue | Disease Stage | Description | Gene Ratio | Bg Ratio | pvalue | p.adjust | Count |
| Page: 1 |
| Pathway ID | Tissue | Disease Stage | Description | Gene Ratio | Bg Ratio | pvalue | p.adjust | qvalue | Count |
| Page: 1 |
Top |
Cell-cell communication analysis |
| Identification of potential cell-cell interactions between two cell types and their ligand-receptor pairs for different disease states |
| Ligand | Receptor | LRpair | Pathway | Tissue | Disease Stage |
| Page: 1 |
Top |
Single-cell gene regulatory network inference analysis |
| Find out the significant the regulons (TFs) and the target genes of each regulon across cell types for different disease states |
| TF | Cell Type | Tissue | Disease Stage | Target Gene | RSS | Regulon Activity |
| ∗The dot plots of a searched regulon are shown for all cell subpopulations in each disease state of each tissue based on the regulon specific score inferred using pySCENIC and by calculating the average expression. |
| Page: 1 |
Top |
Somatic mutation of malignant transformation related genes |
| Annotation of somatic variants for genes involved in malignant transformation |
| Hugo Symbol | Variant Class | Variant Classification | dbSNP RS | HGVSc | HGVSp | HGVSp Short | SWISSPROT | BIOTYPE | SIFT | PolyPhen | Tumor Sample Barcode | Tissue | Histology | Sex | Age | Stage | Therapy Types | Drugs | Outcome |
| DENND2C | SNV | Missense_Mutation | novel | c.824N>C | p.Glu275Ala | p.E275A | Q68D51 | protein_coding | deleterious(0) | probably_damaging(0.998) | TCGA-A7-A6VX-01 | Breast | breast invasive carcinoma | Female | >=65 | I/II | Chemotherapy | docetaxel | CR |
| DENND2C | SNV | Missense_Mutation | c.80N>T | p.Gln27Leu | p.Q27L | Q68D51 | protein_coding | deleterious(0.02) | benign(0.297) | TCGA-AN-A0FW-01 | Breast | breast invasive carcinoma | Female | >=65 | III/IV | Unknown | Unknown | SD | |
| DENND2C | SNV | Missense_Mutation | c.2501N>G | p.Ser834Cys | p.S834C | Q68D51 | protein_coding | deleterious(0) | probably_damaging(0.998) | TCGA-AR-A250-01 | Breast | breast invasive carcinoma | Female | <65 | I/II | Chemotherapy | doxorubicin | SD | |
| DENND2C | SNV | Missense_Mutation | novel | c.397N>C | p.Asp133His | p.D133H | Q68D51 | protein_coding | deleterious(0.03) | benign(0.003) | TCGA-E2-A2P6-01 | Breast | breast invasive carcinoma | Female | >=65 | I/II | Hormone Therapy | anastrozole | SD |
| DENND2C | SNV | Missense_Mutation | c.2398N>C | p.Glu800Gln | p.E800Q | Q68D51 | protein_coding | deleterious(0.01) | possibly_damaging(0.776) | TCGA-GM-A2D9-01 | Breast | breast invasive carcinoma | Female | >=65 | I/II | Hormone Therapy | arimidex | SD | |
| DENND2C | deletion | Frame_Shift_Del | novel | c.2077delA | p.Arg693GlyfsTer2 | p.R693Gfs*2 | Q68D51 | protein_coding | TCGA-D8-A27V-01 | Breast | breast invasive carcinoma | Female | <65 | I/II | Hormone Therapy | tamoxiphen | SD | ||
| DENND2C | SNV | Missense_Mutation | novel | c.916G>A | p.Glu306Lys | p.E306K | Q68D51 | protein_coding | deleterious(0.01) | probably_damaging(0.955) | TCGA-C5-A1M7-01 | Cervix | cervical & endocervical cancer | Female | <65 | I/II | Unknown | Unknown | SD |
| DENND2C | SNV | Missense_Mutation | rs772944552 | c.310N>A | p.Asp104Asn | p.D104N | Q68D51 | protein_coding | tolerated(0.34) | benign(0.001) | TCGA-C5-A1ME-01 | Cervix | cervical & endocervical cancer | Female | <65 | I/II | Unknown | Unknown | SD |
| DENND2C | SNV | Missense_Mutation | c.193G>A | p.Glu65Lys | p.E65K | Q68D51 | protein_coding | tolerated(0.4) | benign(0.013) | TCGA-C5-A3HE-01 | Cervix | cervical & endocervical cancer | Female | <65 | I/II | Unknown | Unknown | PD | |
| DENND2C | SNV | Missense_Mutation | rs746690091 | c.1988N>A | p.Arg663Gln | p.R663Q | Q68D51 | protein_coding | deleterious(0) | probably_damaging(0.999) | TCGA-DS-A1OD-01 | Cervix | cervical & endocervical cancer | Female | <65 | I/II | Chemotherapy | cisplatin | SD |
| Page: 1 2 3 4 5 6 7 8 9 10 11 12 13 |
Top |
Related drugs of malignant transformation related genes |
| Identification of chemicals and drugs interact with genes involved in malignant transfromation |
| (DGIdb 4.0) |
| Entrez ID | Symbol | Category | Interaction Types | Drug Claim Name | Drug Name | PMIDs |
| Page: 1 |

Copyright 2023-Present -The University of Texas Health Science Center at Houston |