
|
|||||
|
 | |
| |
| |
| |
| |
| |
|
Gene: DENND2A |
Gene summary for DENND2A |
| Gene information | Species | Human | Gene symbol | DENND2A | Gene ID | 27147 |
| Gene name | DENN domain containing 2A | |
| Gene Alias | FAM31D | |
| Cytomap | 7q34 | |
| Gene Type | protein-coding | GO ID | GO:0006810 | UniProtAcc | Q9ULE3 |
Top |
Malignant transformation analysis |
| Identification of the aberrant gene expression in precancerous and cancerous lesions by comparing the gene expression of stem-like cells in diseased tissues with normal stem cells |
| Entrez ID | Symbol | Replicates | Species | Organ | Tissue | Adj P-value | Log2FC | Malignancy |
| 27147 | DENND2A | HCC1 | Human | Liver | HCC | 1.06e-25 | 2.78e+00 | 0.5336 |
| 27147 | DENND2A | HCC2 | Human | Liver | HCC | 1.52e-34 | 2.23e+00 | 0.5341 |
| 27147 | DENND2A | HCC5 | Human | Liver | HCC | 7.27e-29 | 1.96e+00 | 0.4932 |
| 27147 | DENND2A | ATC11 | Human | Thyroid | ATC | 1.60e-07 | 5.38e-01 | 0.3386 |
| 27147 | DENND2A | ATC12 | Human | Thyroid | ATC | 2.76e-08 | 2.02e-01 | 0.34 |
| 27147 | DENND2A | ATC13 | Human | Thyroid | ATC | 9.88e-36 | 5.67e-01 | 0.34 |
| 27147 | DENND2A | ATC3 | Human | Thyroid | ATC | 3.03e-13 | 6.07e-01 | 0.338 |
| 27147 | DENND2A | ATC4 | Human | Thyroid | ATC | 1.14e-11 | 2.58e-01 | 0.34 |
| 27147 | DENND2A | ATC5 | Human | Thyroid | ATC | 2.95e-31 | 6.11e-01 | 0.34 |
| Page: 1 |
| Tissue | Expression Dynamics | Abbreviation |
| Liver | 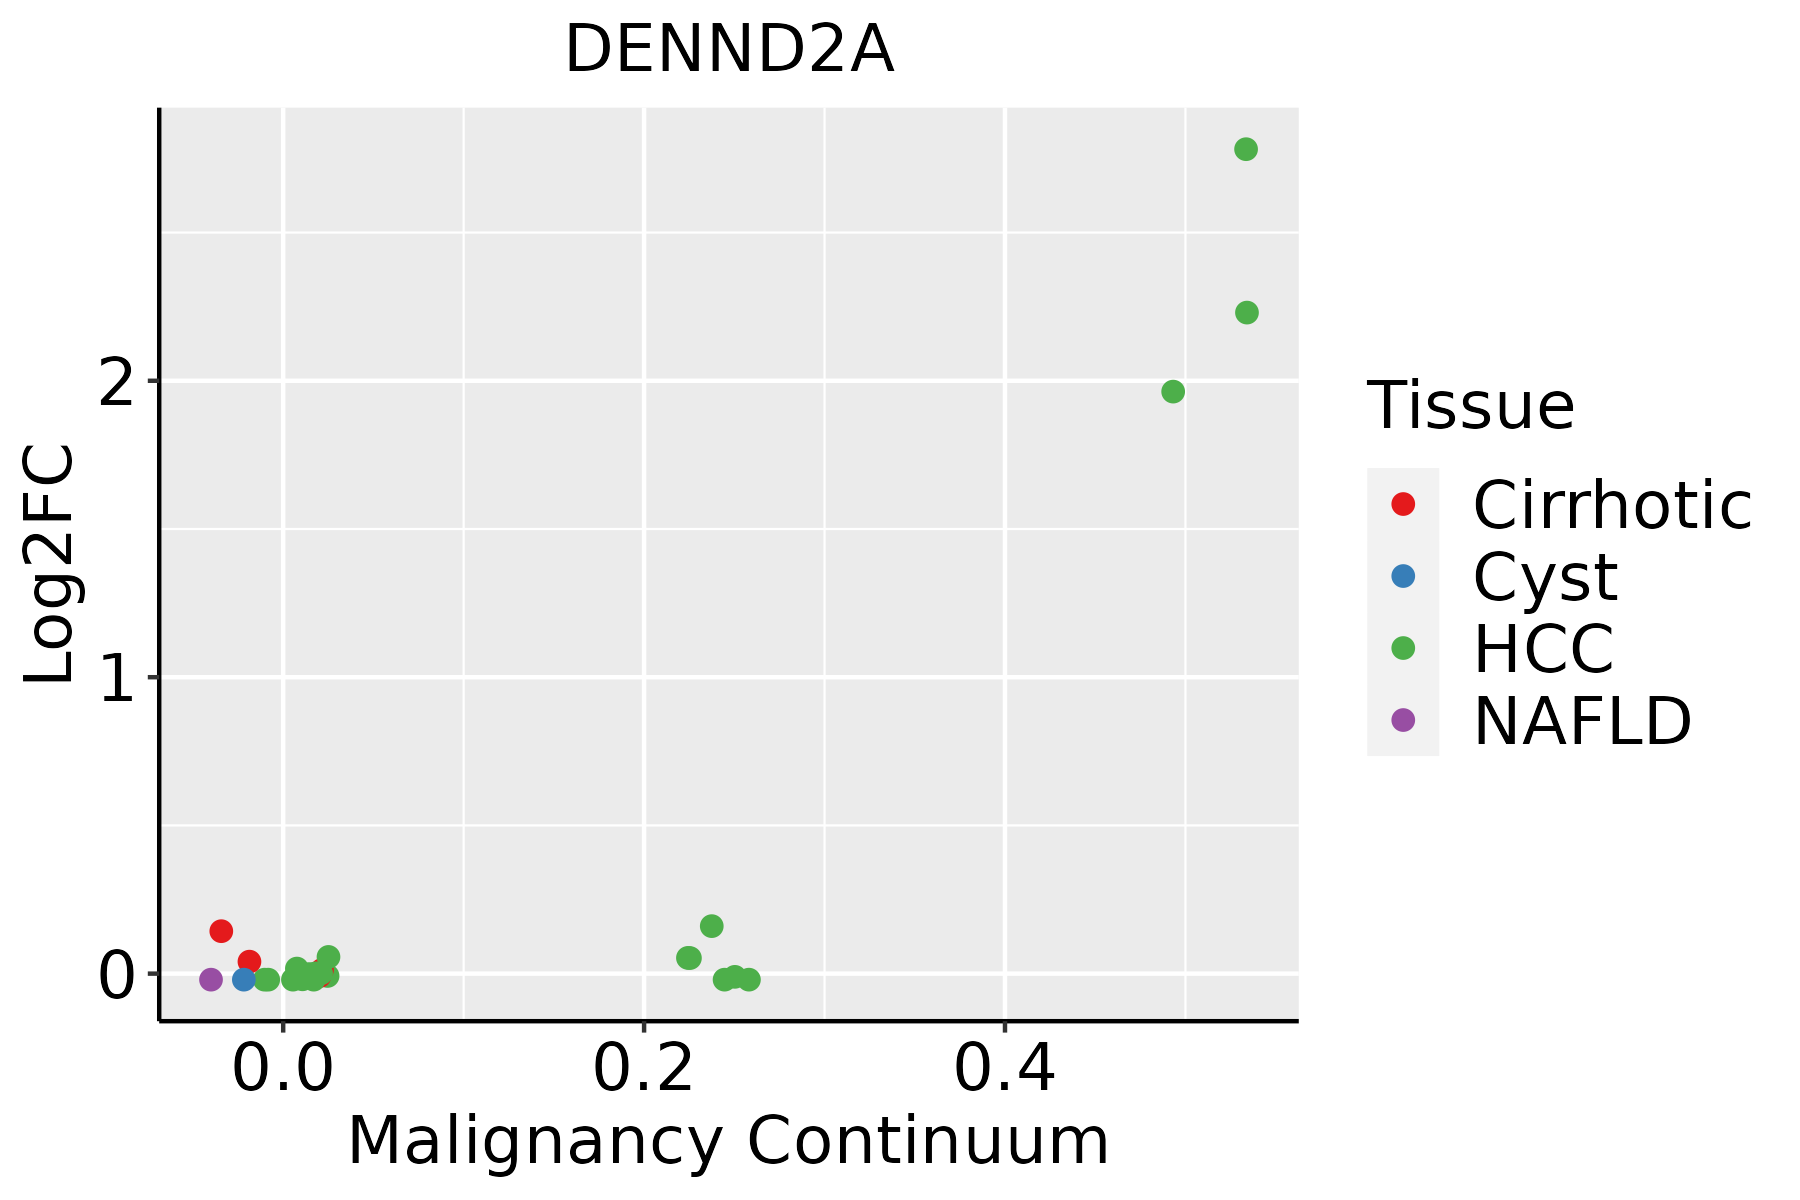 | HCC: Hepatocellular carcinoma |
| NAFLD: Non-alcoholic fatty liver disease | ||
| Thyroid | 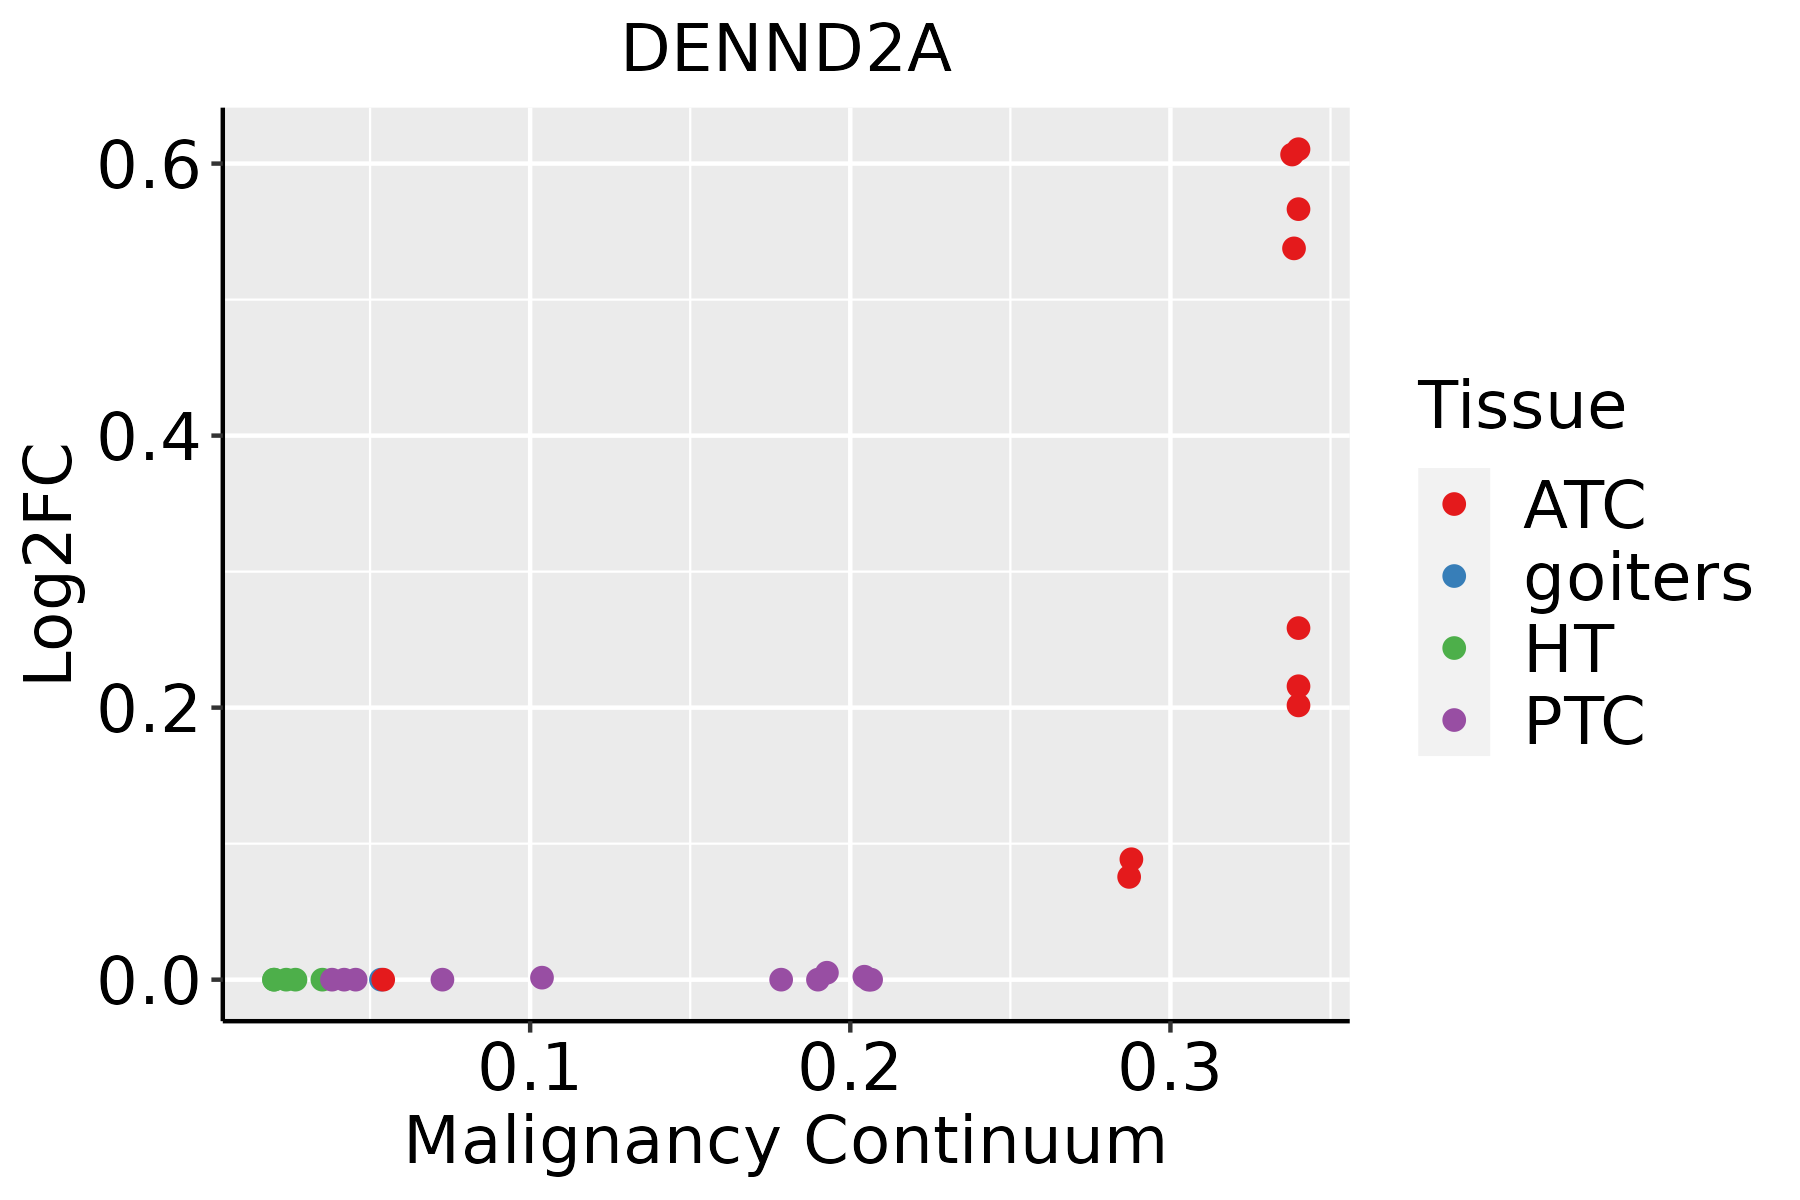 | ATC: Anaplastic thyroid cancer |
| HT: Hashimoto's thyroiditis | ||
| PTC: Papillary thyroid cancer |
| ∗log2FC in expression of this searched gene in stem-like cells from each diseased tissue sample relative to stem-like cells in normal samples in each tissue plotted against the malignancy continuum. Samples are colored based on if they are from different disease stage. |
Top |
Malignant transformation related pathway analysis |
| Find out the enriched GO biological processes and KEGG pathways involved in transition from healthy to precancer to cancer |
| Tissue | Disease Stage | Enriched GO biological Processes |
| Colorectum | AD |  |
| Colorectum | SER |  |
| Colorectum | MSS |  |
| Colorectum | MSI-H |  |
| Colorectum | FAP |  |
| ∗Top 15 enriched GO BP terms are showed in the bar plot of each disease state in each tissue. Each row represents a significant GO biological process which is colored according to the -log10(p.adjust). |
| Page: 1 2 3 4 5 6 7 8 9 |
| GO ID | Tissue | Disease Stage | Description | Gene Ratio | Bg Ratio | pvalue | p.adjust | Count |
| GO:001619721 | Liver | HCC | endosomal transport | 154/7958 | 230/18723 | 4.74e-14 | 2.95e-12 | 154 |
| GO:001648221 | Liver | HCC | cytosolic transport | 117/7958 | 168/18723 | 8.83e-13 | 4.48e-11 | 117 |
| GO:004214721 | Liver | HCC | retrograde transport, endosome to Golgi | 61/7958 | 91/18723 | 1.94e-06 | 2.68e-05 | 61 |
| GO:001619719 | Thyroid | ATC | endosomal transport | 128/6293 | 230/18723 | 4.44e-12 | 1.75e-10 | 128 |
| GO:001648218 | Thyroid | ATC | cytosolic transport | 93/6293 | 168/18723 | 5.19e-09 | 1.15e-07 | 93 |
| GO:004214715 | Thyroid | ATC | retrograde transport, endosome to Golgi | 49/6293 | 91/18723 | 5.48e-05 | 4.23e-04 | 49 |
| Page: 1 |
| Pathway ID | Tissue | Disease Stage | Description | Gene Ratio | Bg Ratio | pvalue | p.adjust | qvalue | Count |
| Page: 1 |
Top |
Cell-cell communication analysis |
| Identification of potential cell-cell interactions between two cell types and their ligand-receptor pairs for different disease states |
| Ligand | Receptor | LRpair | Pathway | Tissue | Disease Stage |
| Page: 1 |
Top |
Single-cell gene regulatory network inference analysis |
| Find out the significant the regulons (TFs) and the target genes of each regulon across cell types for different disease states |
| TF | Cell Type | Tissue | Disease Stage | Target Gene | RSS | Regulon Activity |
| ∗The dot plots of a searched regulon are shown for all cell subpopulations in each disease state of each tissue based on the regulon specific score inferred using pySCENIC and by calculating the average expression. |
| Page: 1 |
Top |
Somatic mutation of malignant transformation related genes |
| Annotation of somatic variants for genes involved in malignant transformation |
| Hugo Symbol | Variant Class | Variant Classification | dbSNP RS | HGVSc | HGVSp | HGVSp Short | SWISSPROT | BIOTYPE | SIFT | PolyPhen | Tumor Sample Barcode | Tissue | Histology | Sex | Age | Stage | Therapy Types | Drugs | Outcome |
| DENND2A | SNV | Missense_Mutation | novel | c.2186A>C | p.Glu729Ala | p.E729A | Q9ULE3 | protein_coding | deleterious(0) | benign(0.303) | TCGA-A8-A07U-01 | Breast | breast invasive carcinoma | Female | >=65 | III/IV | Chemotherapy | 5-fluorouracil | SD |
| DENND2A | SNV | Missense_Mutation | novel | c.819N>G | p.Phe273Leu | p.F273L | Q9ULE3 | protein_coding | deleterious(0) | probably_damaging(0.999) | TCGA-AC-A3W6-01 | Breast | breast invasive carcinoma | Female | >=65 | III/IV | Unknown | Unknown | SD |
| DENND2A | SNV | Missense_Mutation | novel | c.1337N>G | p.Thr446Ser | p.T446S | Q9ULE3 | protein_coding | tolerated(0.14) | benign(0.007) | TCGA-B6-A0IJ-01 | Breast | breast invasive carcinoma | Female | <65 | I/II | Unknown | Unknown | SD |
| DENND2A | SNV | Missense_Mutation | rs751864937 | c.1901C>T | p.Ser634Leu | p.S634L | Q9ULE3 | protein_coding | deleterious(0) | probably_damaging(0.997) | TCGA-BH-A2L8-01 | Breast | breast invasive carcinoma | Female | <65 | I/II | Chemotherapy | cytoxan | CR |
| DENND2A | SNV | Missense_Mutation | c.742G>C | p.Glu248Gln | p.E248Q | Q9ULE3 | protein_coding | deleterious(0.01) | benign(0.41) | TCGA-D8-A1J8-01 | Breast | breast invasive carcinoma | Female | >=65 | I/II | Hormone Therapy | nolvadex | SD | |
| DENND2A | SNV | Missense_Mutation | rs755191369 | c.2063N>A | p.Arg688Gln | p.R688Q | Q9ULE3 | protein_coding | deleterious(0) | probably_damaging(0.989) | TCGA-PE-A5DD-01 | Breast | breast invasive carcinoma | Female | <65 | I/II | Chemotherapy | CR | |
| DENND2A | insertion | In_Frame_Ins | novel | c.1463_1464insTTG | p.Asn488_Ala489insCys | p.N488_A489insC | Q9ULE3 | protein_coding | TCGA-A8-A08H-01 | Breast | breast invasive carcinoma | Female | >=65 | I/II | Unknown | Unknown | SD | ||
| DENND2A | insertion | In_Frame_Ins | novel | c.1462_1463insCTGGAACCTGGAAGGCAGAGGTTGCAGTGAGCCGAG | p.Asn488delinsThrGlyThrTrpLysAlaGluValAlaValSerArgAsp | p.N488delinsTGTWKAEVAVSRD | Q9ULE3 | protein_coding | TCGA-A8-A08H-01 | Breast | breast invasive carcinoma | Female | >=65 | I/II | Unknown | Unknown | SD | ||
| DENND2A | insertion | Nonsense_Mutation | novel | c.2844_2845insAGGAGTTCGAGACCAACCTGGCCAACTTGGTGAAACCCTGT | p.Phe949ArgfsTer11 | p.F949Rfs*11 | Q9ULE3 | protein_coding | TCGA-BH-A0DP-01 | Breast | breast invasive carcinoma | Female | <65 | I/II | Hormone Therapy | arimidex | SD | ||
| DENND2A | deletion | Frame_Shift_Del | novel | c.624delN | p.Ser209ValfsTer108 | p.S209Vfs*108 | Q9ULE3 | protein_coding | TCGA-EW-A2FV-01 | Breast | breast invasive carcinoma | Female | <65 | III/IV | Chemotherapy | docetaxel | SD |
| Page: 1 2 3 4 5 6 7 8 9 10 11 12 13 14 |
Top |
Related drugs of malignant transformation related genes |
| Identification of chemicals and drugs interact with genes involved in malignant transfromation |
| (DGIdb 4.0) |
| Entrez ID | Symbol | Category | Interaction Types | Drug Claim Name | Drug Name | PMIDs |
| Page: 1 |

Copyright 2023-Present -The University of Texas Health Science Center at Houston |