| Tissue | Expression Dynamics | Abbreviation |
| Breast |  | IDC: Invasive ductal carcinoma |
| DCIS: Ductal carcinoma in situ |
| Precancer(BRCA1-mut): Precancerous lesion from BRCA1 mutation carriers |
| Cervix | 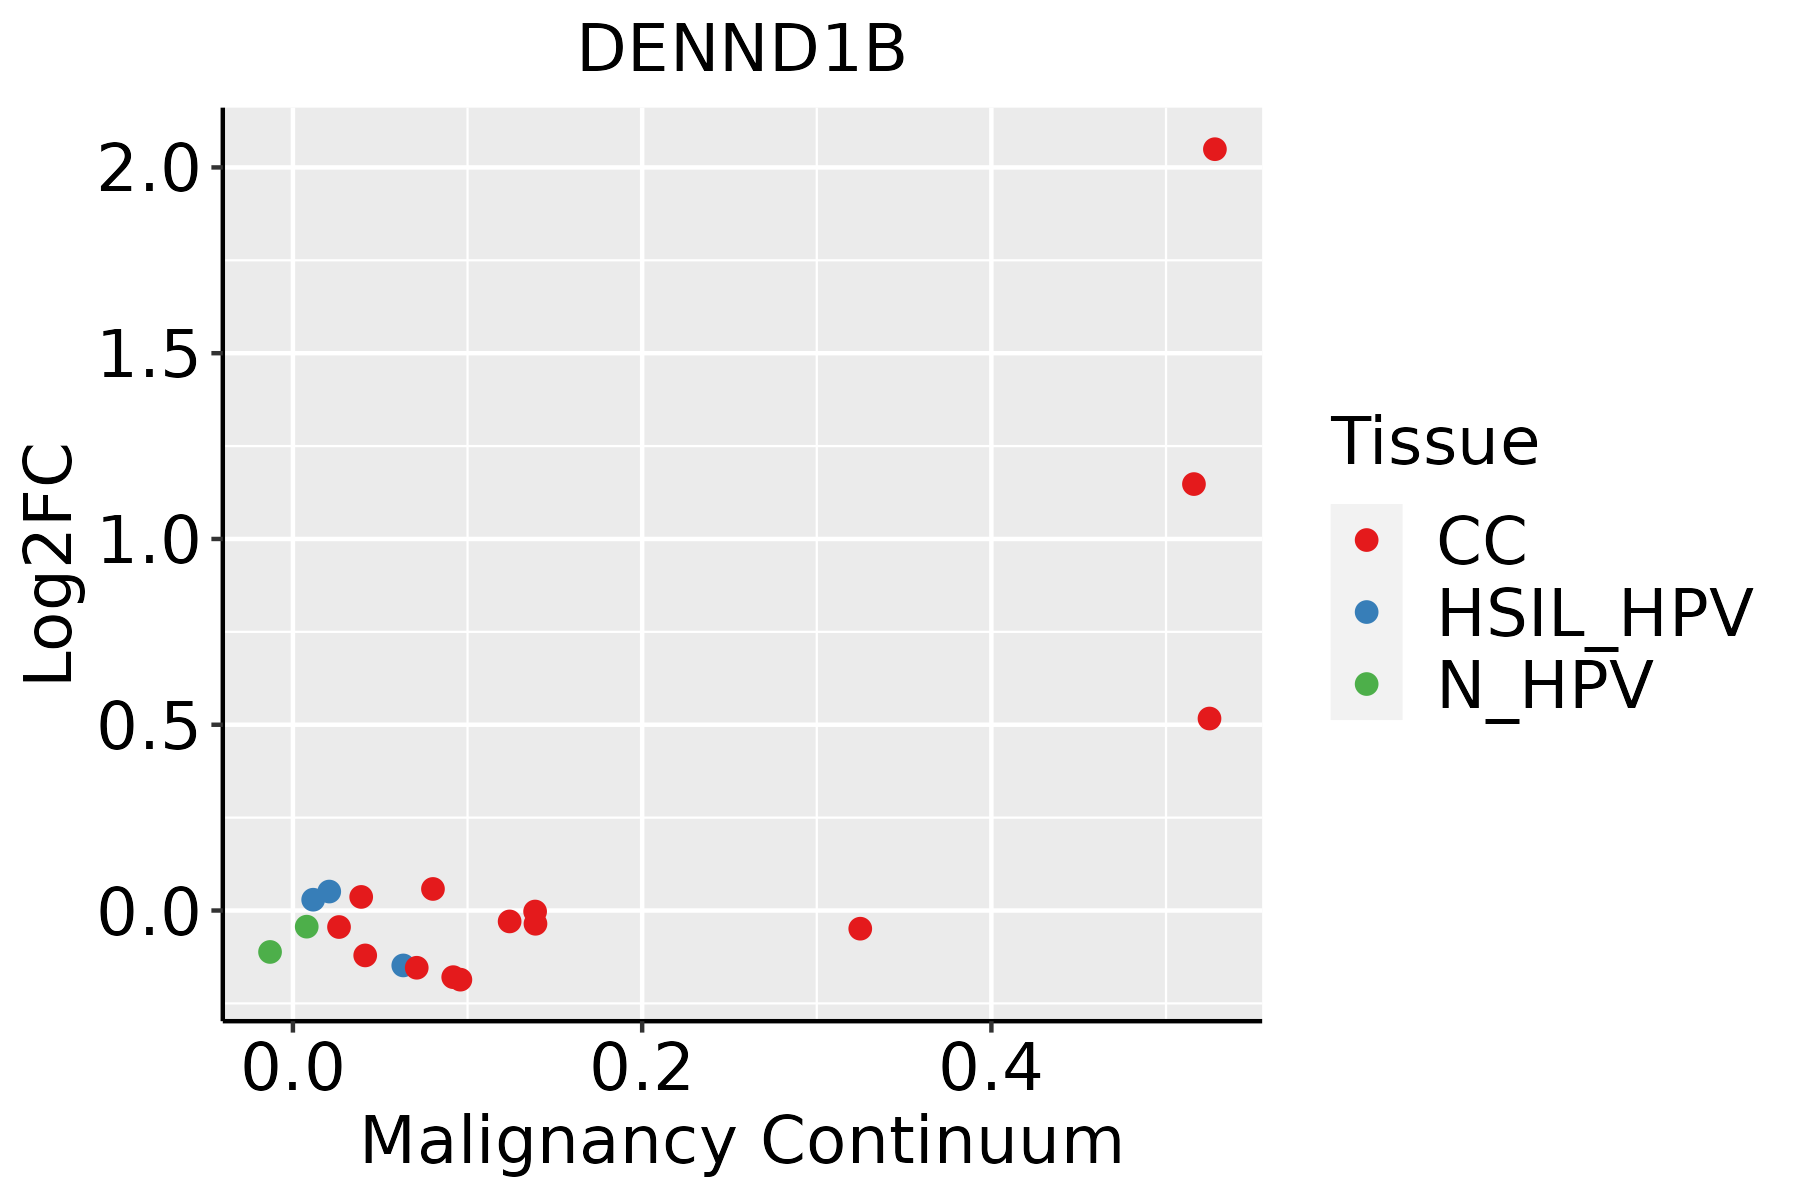 | CC: Cervix cancer |
| HSIL_HPV: HPV-infected high-grade squamous intraepithelial lesions |
| N_HPV: HPV-infected normal cervix |
| Colorectum (GSE201348) |  | FAP: Familial adenomatous polyposis |
| CRC: Colorectal cancer |
| Colorectum (HTA11) | 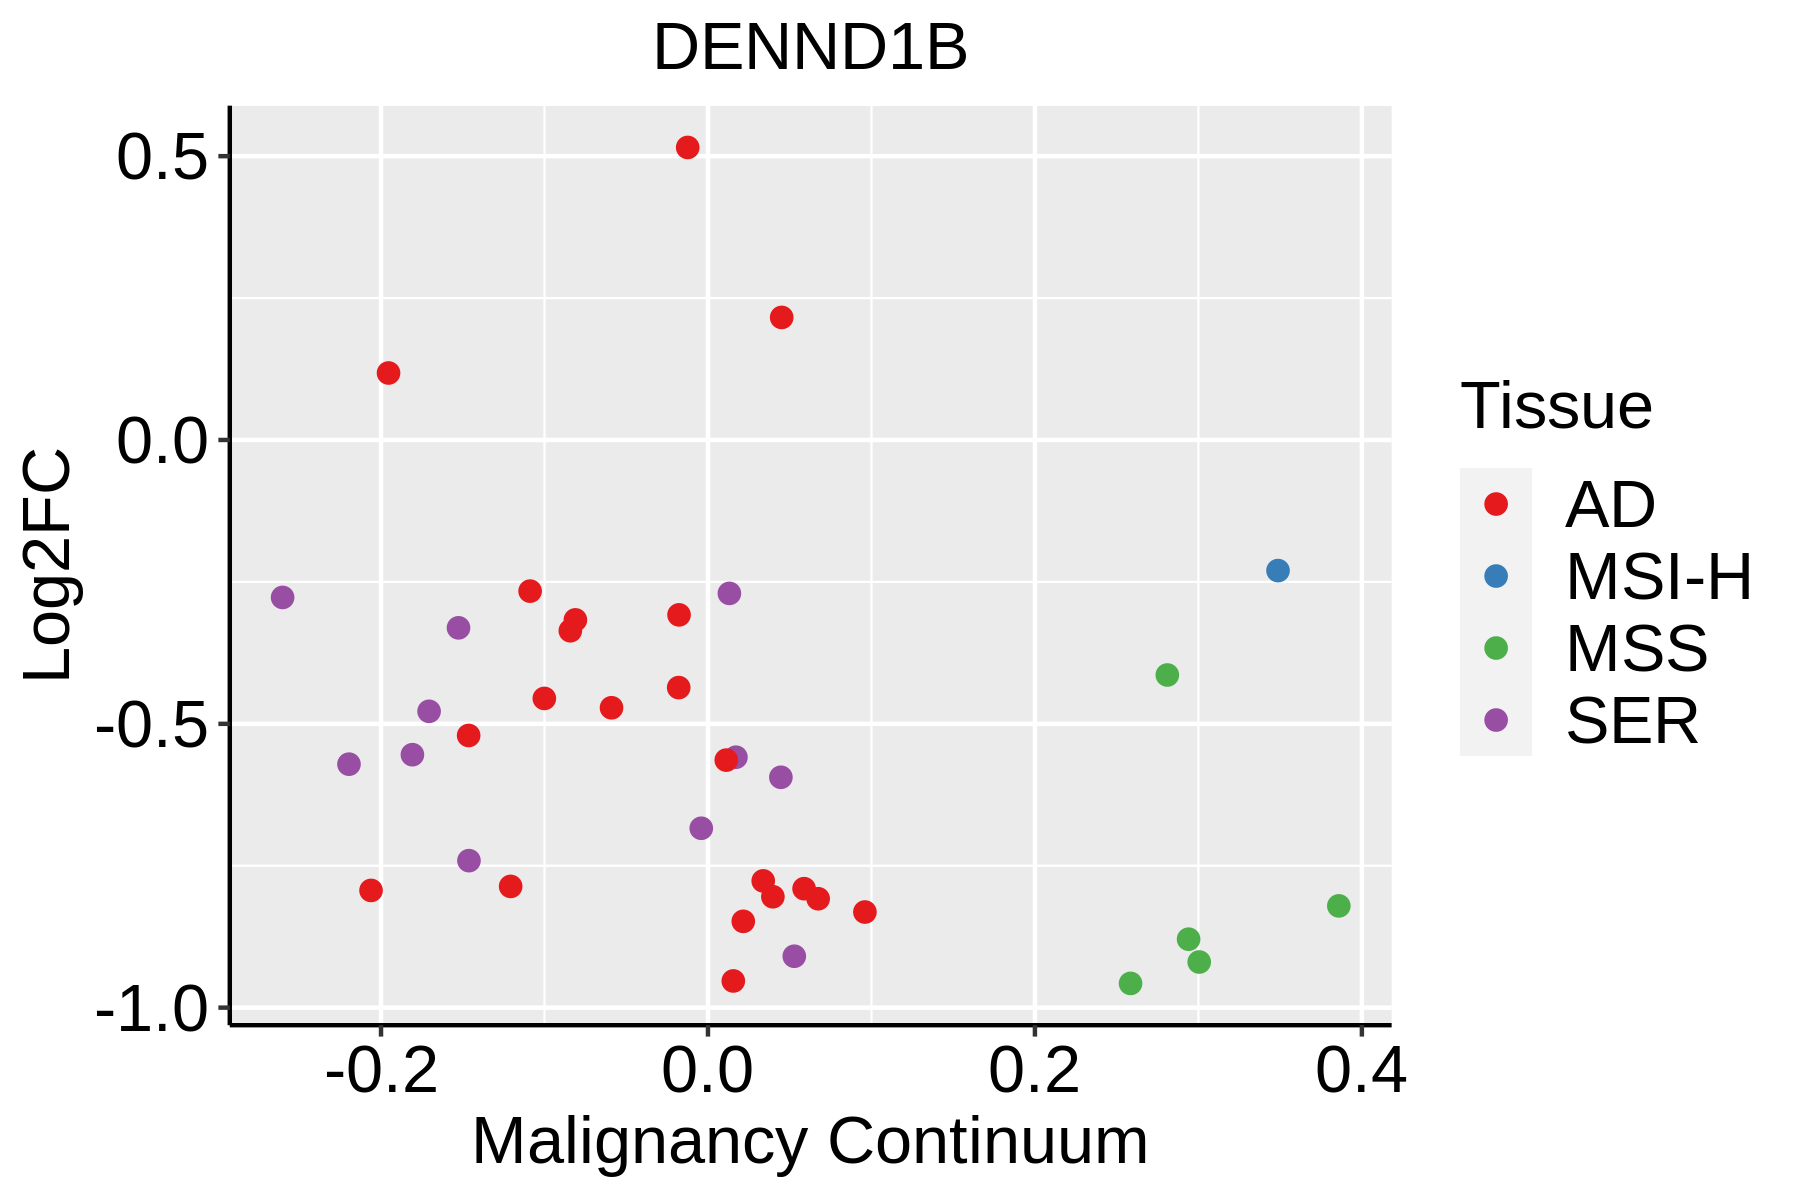 | AD: Adenomas |
| SER: Sessile serrated lesions |
| MSI-H: Microsatellite-high colorectal cancer |
| MSS: Microsatellite stable colorectal cancer |
| Esophagus | 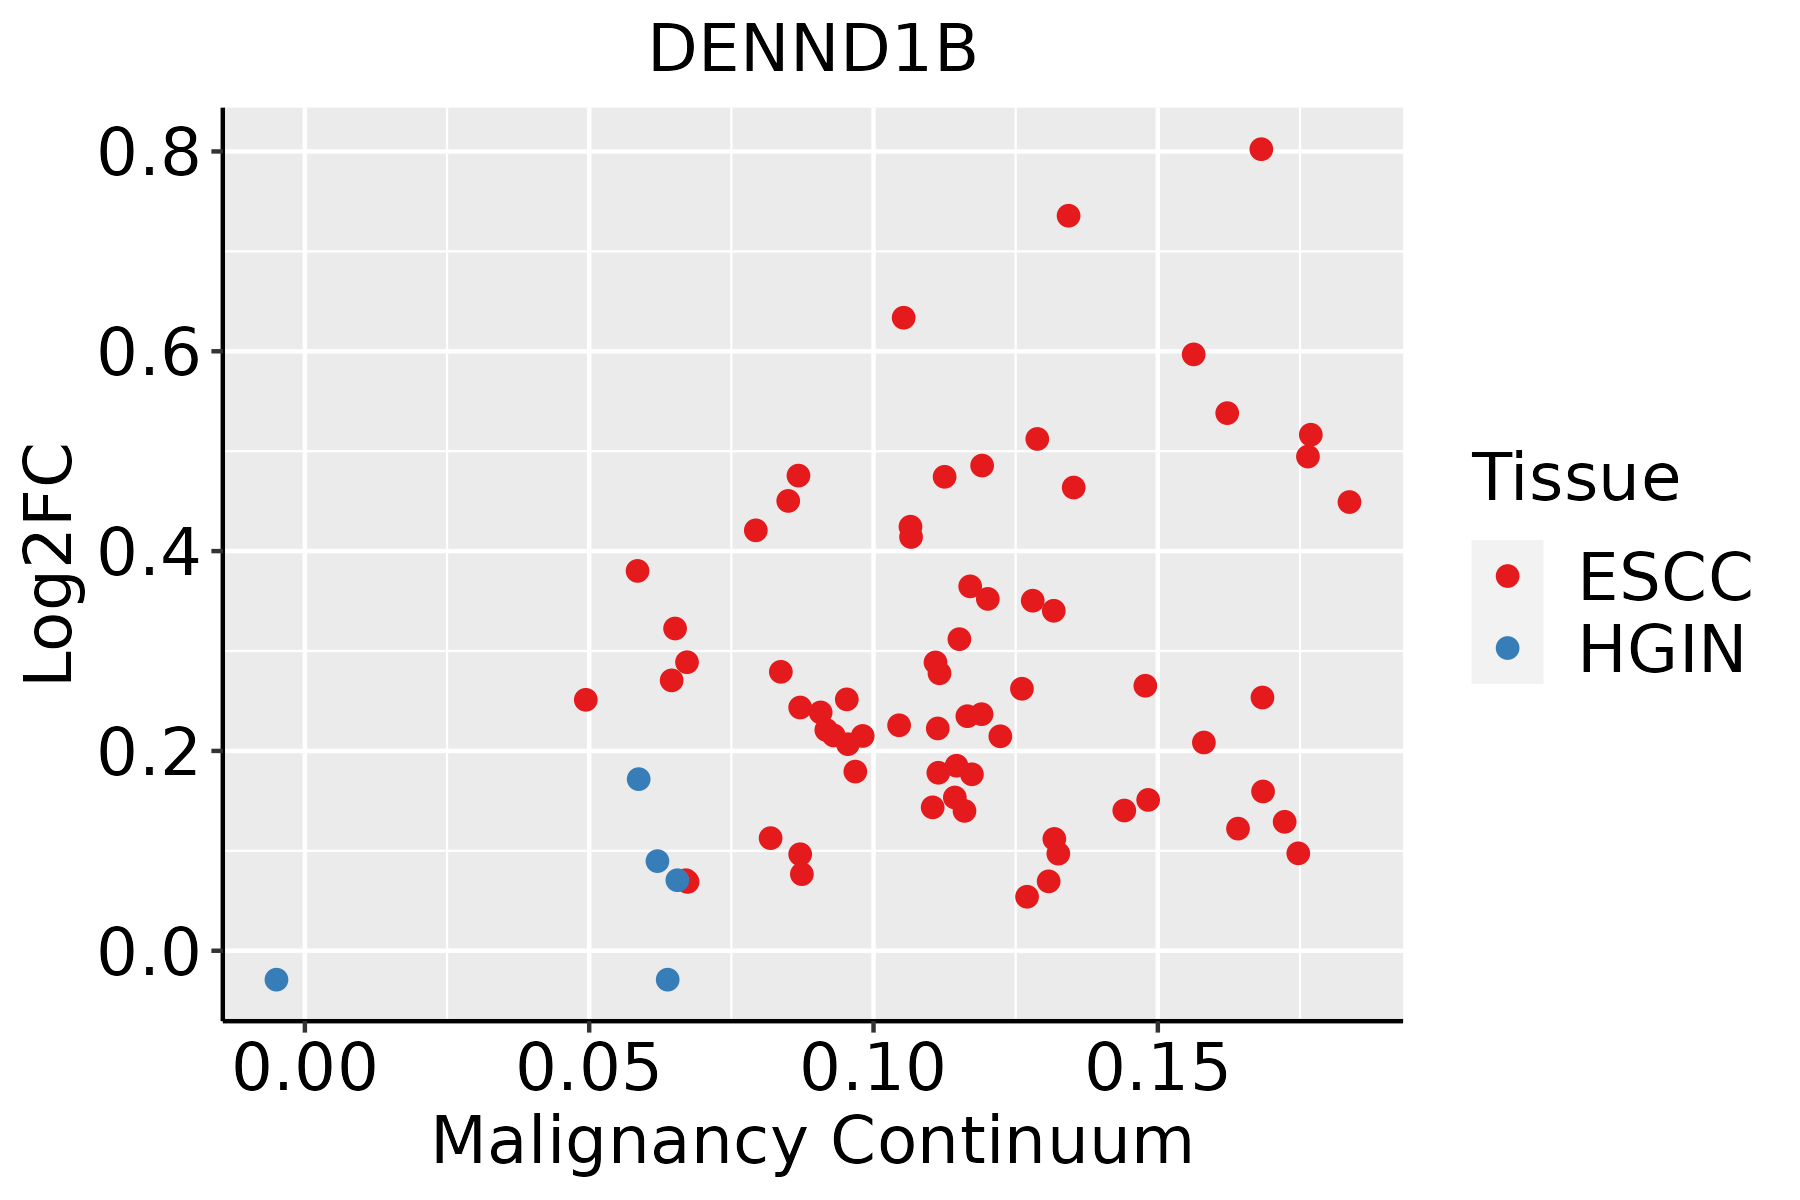 | ESCC: Esophageal squamous cell carcinoma |
| HGIN: High-grade intraepithelial neoplasias |
| LGIN: Low-grade intraepithelial neoplasias |
| Liver |  | HCC: Hepatocellular carcinoma |
| NAFLD: Non-alcoholic fatty liver disease |
| Lung | 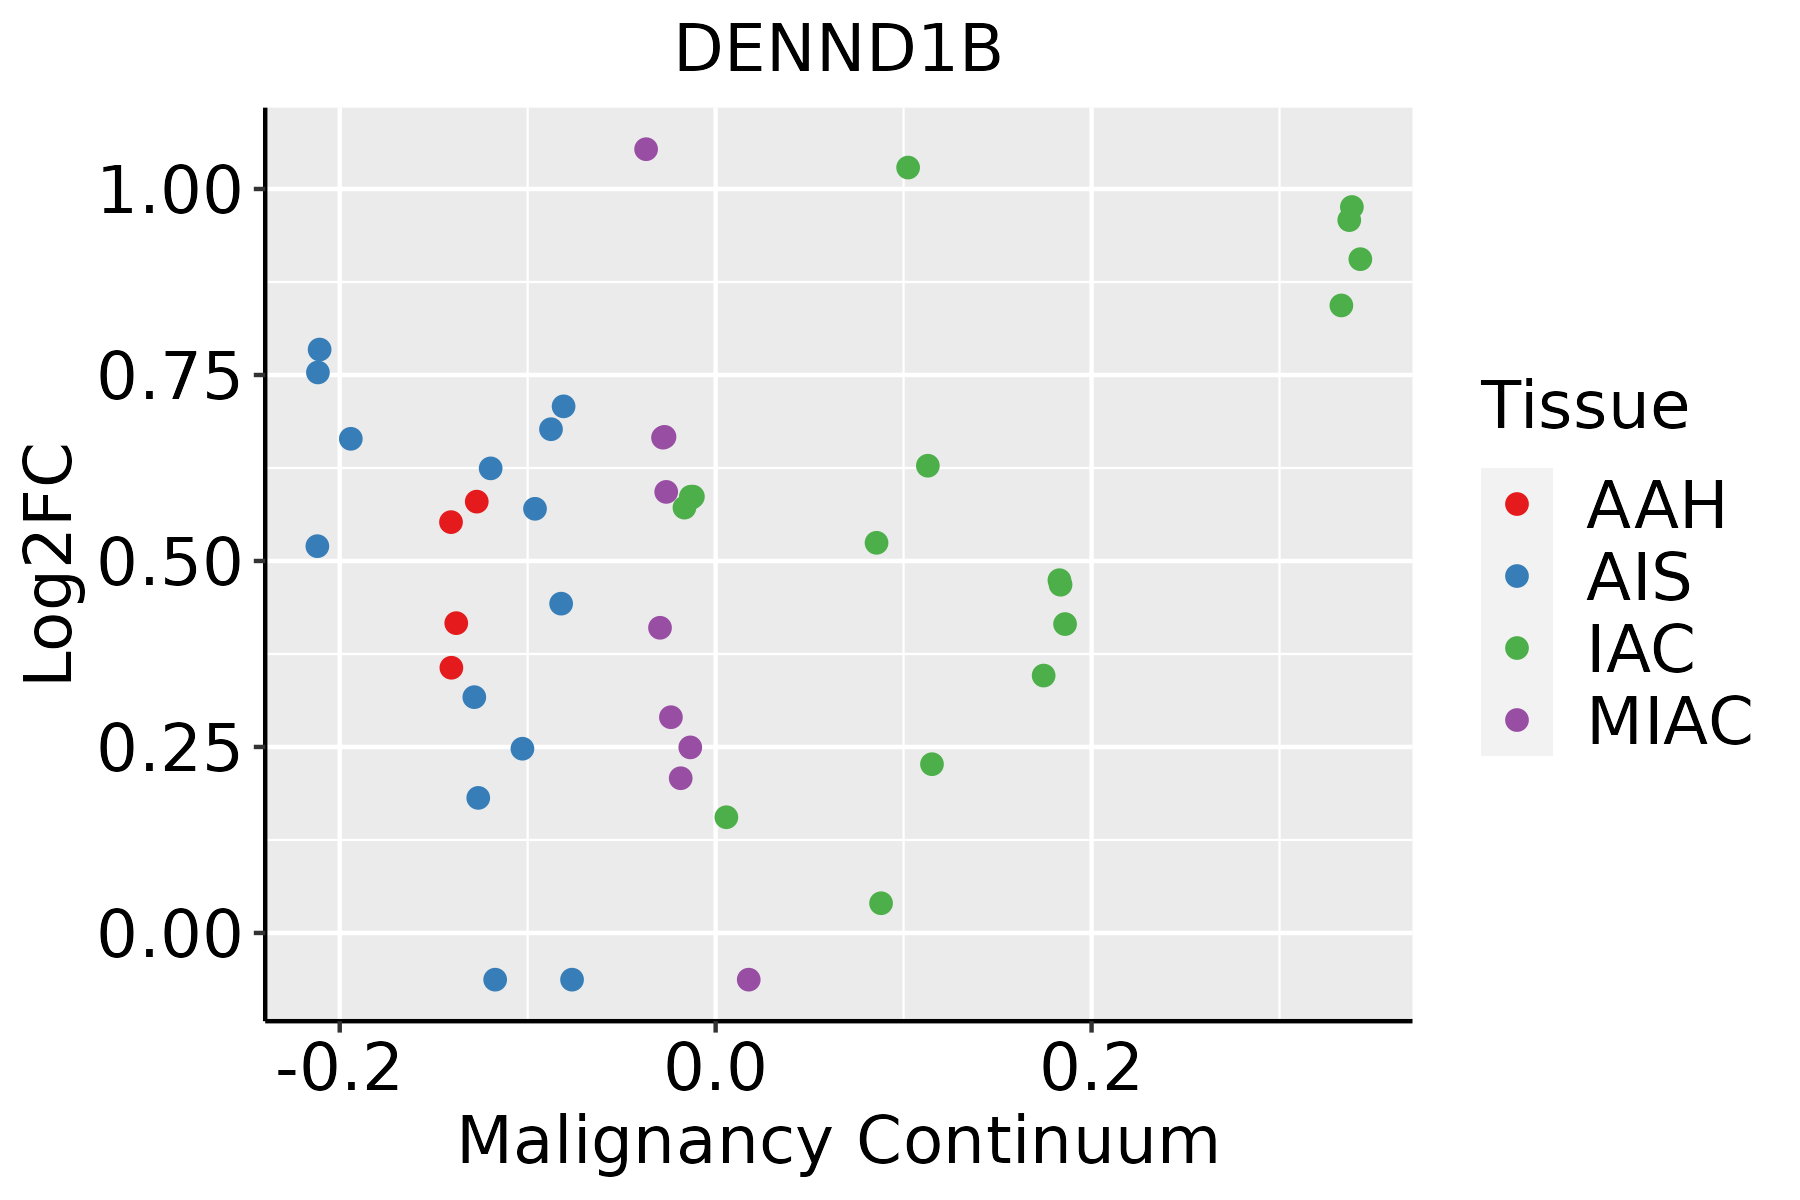 | AAH: Atypical adenomatous hyperplasia |
| AIS: Adenocarcinoma in situ |
| IAC: Invasive lung adenocarcinoma |
| MIA: Minimally invasive adenocarcinoma |
| Oral Cavity | 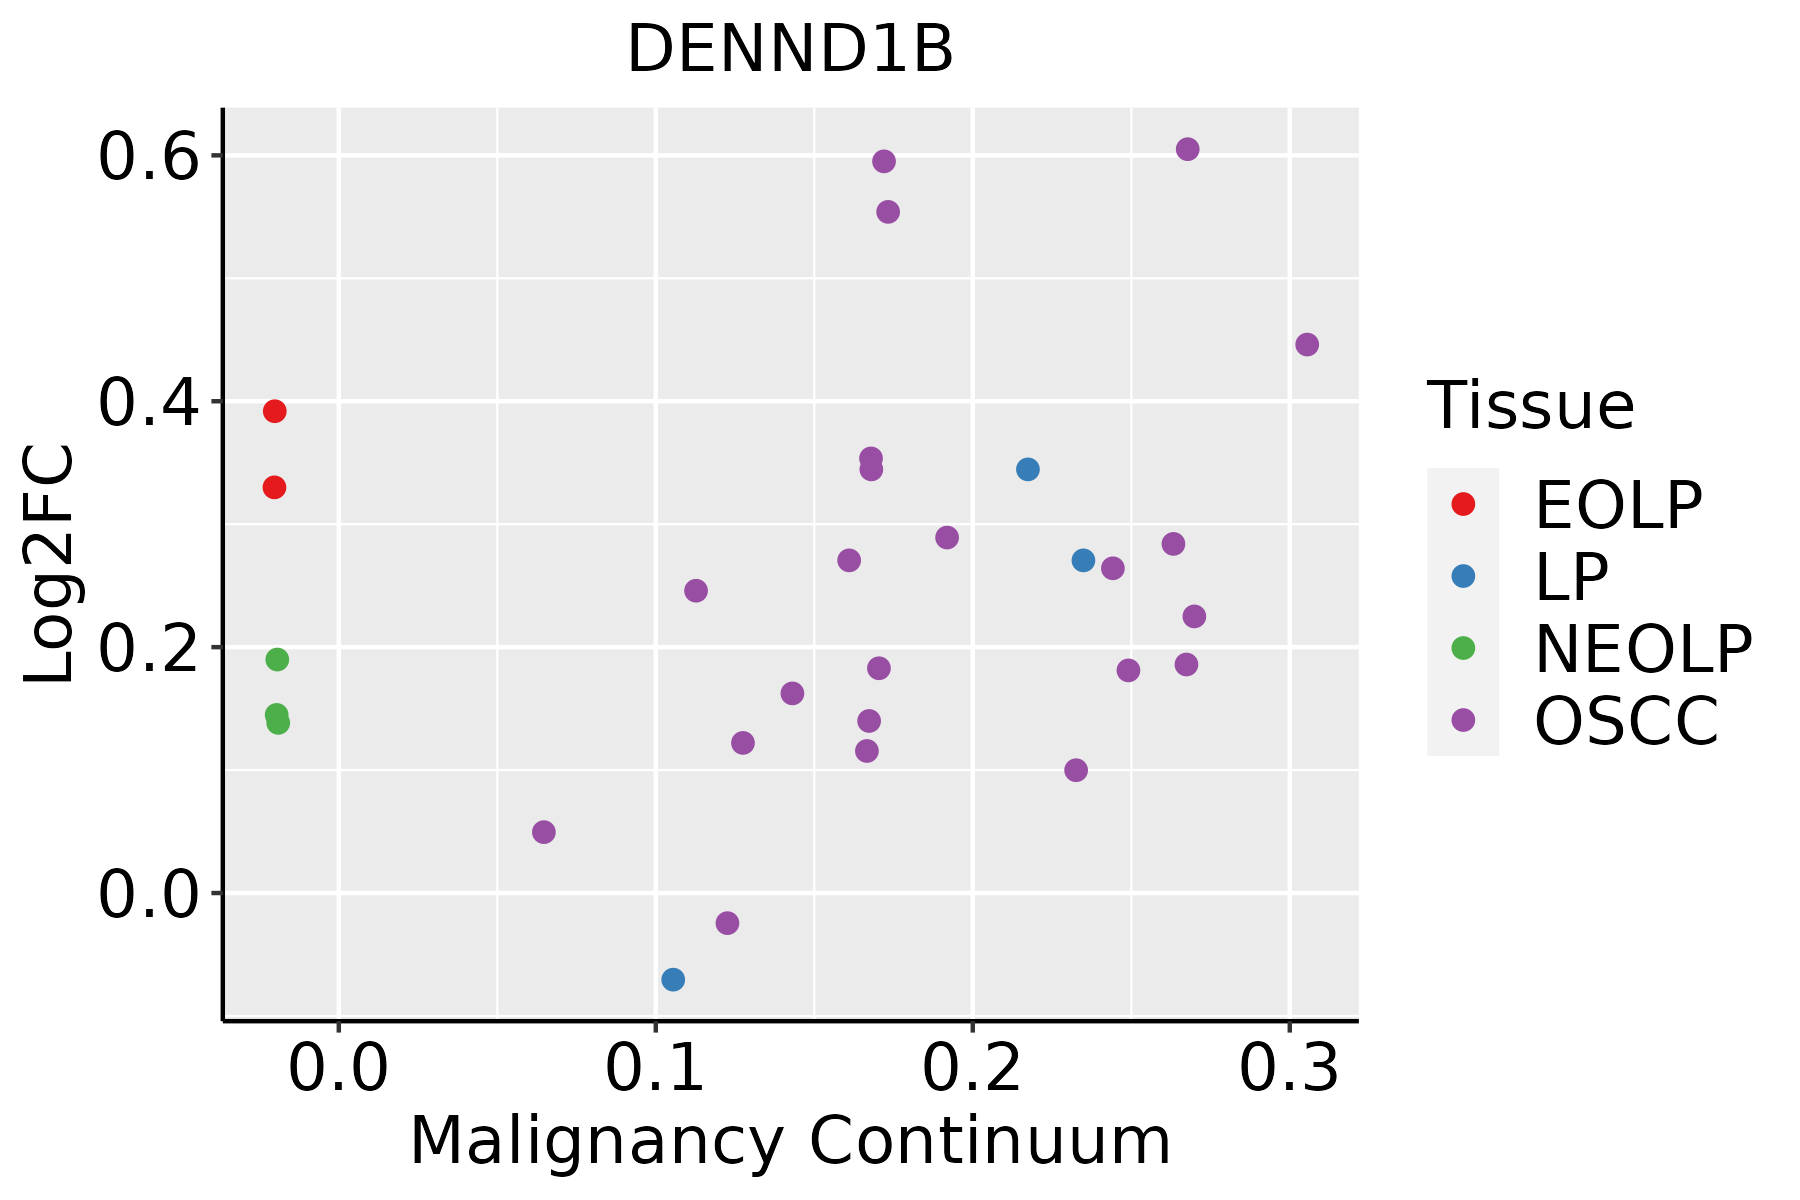 | EOLP: Erosive Oral lichen planus |
| LP: leukoplakia |
| NEOLP: Non-erosive oral lichen planus |
| OSCC: Oral squamous cell carcinoma |
| Prostate | 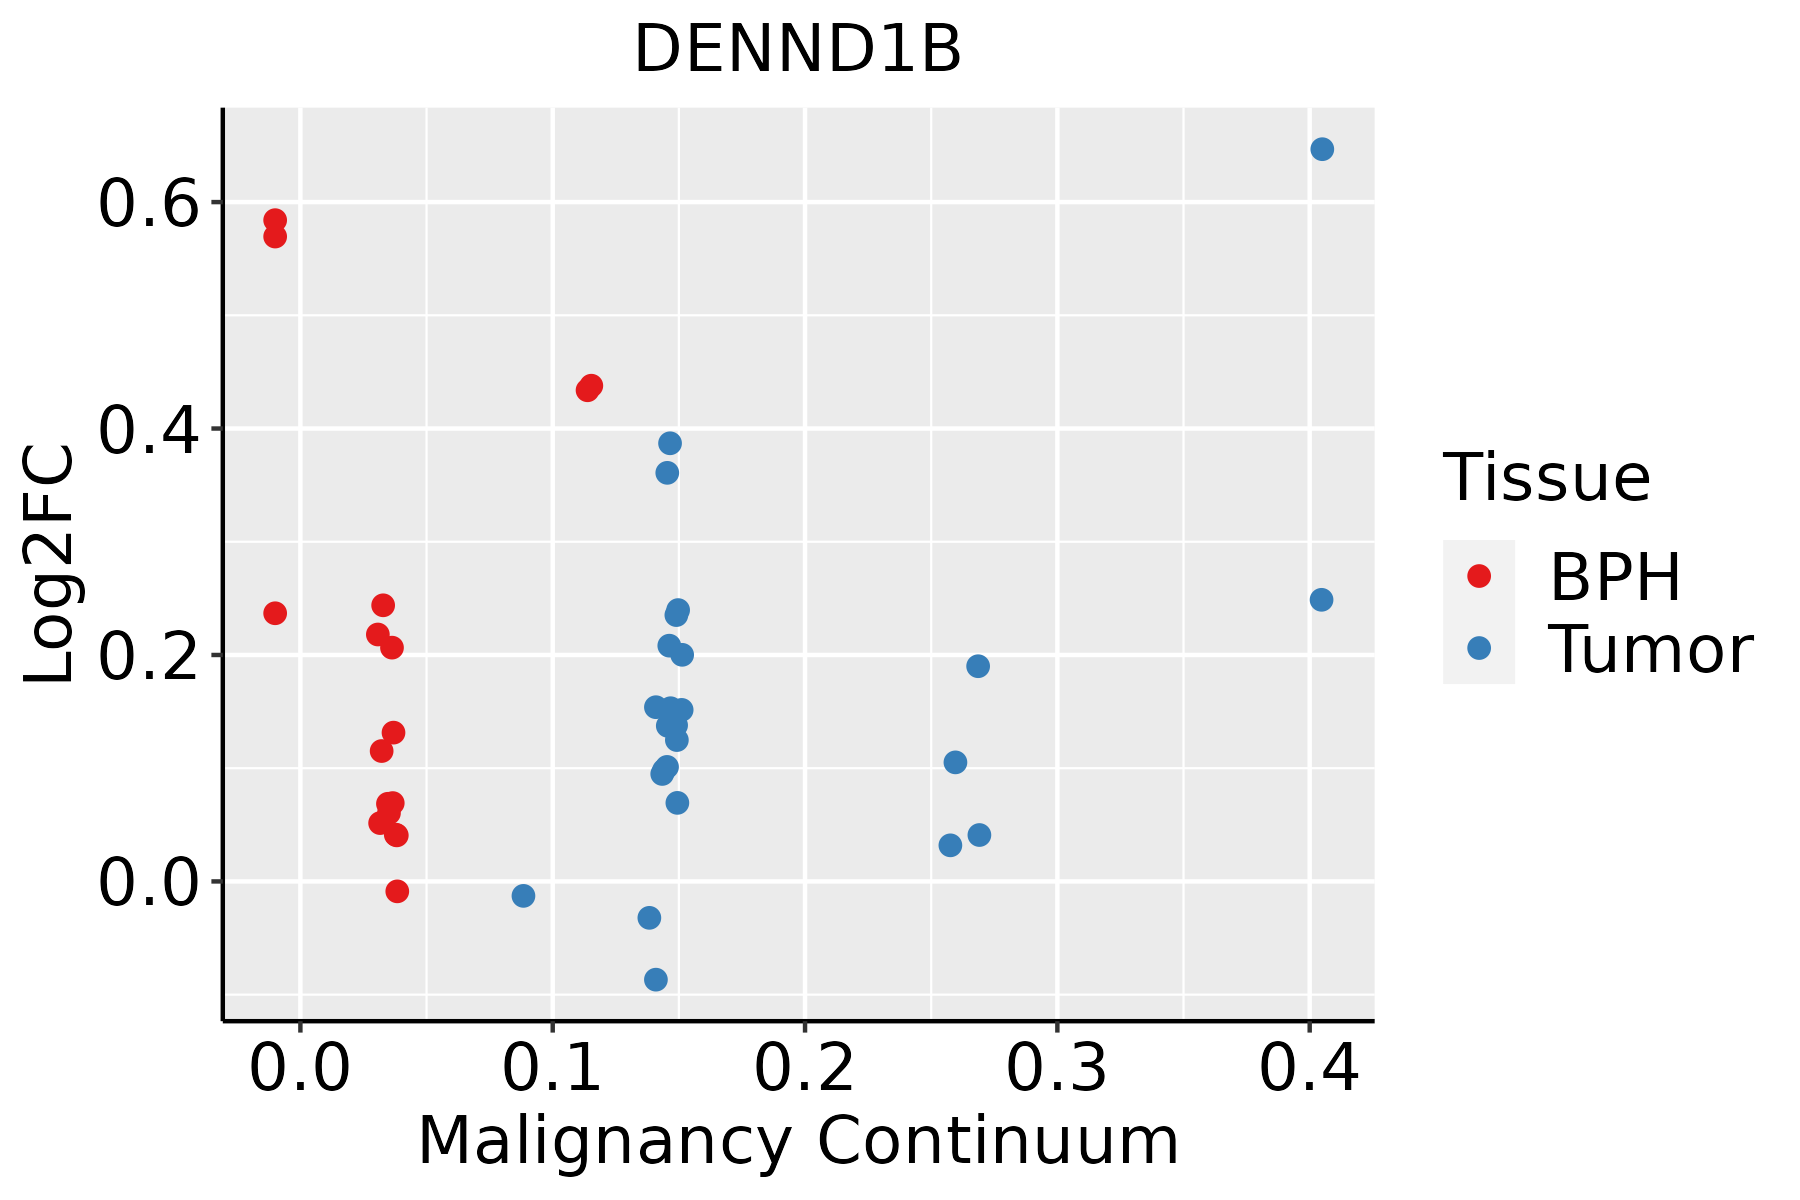 | BPH: Benign Prostatic Hyperplasia |
| GO ID | Tissue | Disease Stage | Description | Gene Ratio | Bg Ratio | pvalue | p.adjust | Count |
| GO:000181911 | Breast | IDC | positive regulation of cytokine production | 61/1434 | 467/18723 | 2.81e-05 | 6.58e-04 | 61 |
| GO:000271111 | Breast | IDC | positive regulation of T cell mediated immunity | 13/1434 | 56/18723 | 2.48e-04 | 3.87e-03 | 13 |
| GO:00508521 | Breast | IDC | T cell receptor signaling pathway | 20/1434 | 123/18723 | 1.05e-03 | 1.16e-02 | 20 |
| GO:000270911 | Breast | IDC | regulation of T cell mediated immunity | 14/1434 | 85/18723 | 4.98e-03 | 3.77e-02 | 14 |
| GO:00022532 | Breast | IDC | activation of immune response | 43/1434 | 375/18723 | 5.16e-03 | 3.84e-02 | 43 |
| GO:000181921 | Breast | DCIS | positive regulation of cytokine production | 63/1390 | 467/18723 | 2.76e-06 | 9.42e-05 | 63 |
| GO:000271121 | Breast | DCIS | positive regulation of T cell mediated immunity | 13/1390 | 56/18723 | 1.82e-04 | 2.98e-03 | 13 |
| GO:00508522 | Breast | DCIS | T cell receptor signaling pathway | 20/1390 | 123/18723 | 7.14e-04 | 8.56e-03 | 20 |
| GO:000225311 | Breast | DCIS | activation of immune response | 43/1390 | 375/18723 | 2.96e-03 | 2.54e-02 | 43 |
| GO:000270921 | Breast | DCIS | regulation of T cell mediated immunity | 14/1390 | 85/18723 | 3.78e-03 | 3.03e-02 | 14 |
| GO:000245612 | Breast | DCIS | T cell mediated immunity | 16/1390 | 109/18723 | 6.56e-03 | 4.60e-02 | 16 |
| GO:00430877 | Cervix | CC | regulation of GTPase activity | 79/2311 | 348/18723 | 4.21e-08 | 2.60e-06 | 79 |
| GO:00027644 | Cervix | CC | immune response-regulating signaling pathway | 97/2311 | 468/18723 | 1.49e-07 | 7.07e-06 | 97 |
| GO:00018197 | Cervix | CC | positive regulation of cytokine production | 95/2311 | 467/18723 | 4.88e-07 | 1.85e-05 | 95 |
| GO:00988767 | Cervix | CC | vesicle-mediated transport to the plasma membrane | 34/2311 | 136/18723 | 3.75e-05 | 5.91e-04 | 34 |
| GO:00022533 | Cervix | CC | activation of immune response | 72/2311 | 375/18723 | 8.26e-05 | 1.11e-03 | 72 |
| GO:00435476 | Cervix | CC | positive regulation of GTPase activity | 53/2311 | 255/18723 | 8.72e-05 | 1.16e-03 | 53 |
| GO:00161977 | Cervix | CC | endosomal transport | 48/2311 | 230/18723 | 1.65e-04 | 1.97e-03 | 48 |
| GO:00024564 | Cervix | CC | T cell mediated immunity | 26/2311 | 109/18723 | 6.39e-04 | 5.97e-03 | 26 |
| GO:0002768 | Cervix | CC | immune response-regulating cell surface receptor signaling pathway | 59/2311 | 315/18723 | 6.64e-04 | 6.11e-03 | 59 |
| Hugo Symbol | Variant Class | Variant Classification | dbSNP RS | HGVSc | HGVSp | HGVSp Short | SWISSPROT | BIOTYPE | SIFT | PolyPhen | Tumor Sample Barcode | Tissue | Histology | Sex | Age | Stage | Therapy Types | Drugs | Outcome |
| DENND1B | SNV | Missense_Mutation | rs756637931 | c.263N>T | p.Thr88Met | p.T88M | Q6P3S1 | protein_coding | deleterious(0) | possibly_damaging(0.635) | TCGA-A1-A0SO-01 | Breast | breast invasive carcinoma | Female | >=65 | I/II | Chemotherapy | | SD |
| DENND1B | SNV | Missense_Mutation | | c.650N>G | p.Ile217Ser | p.I217S | Q6P3S1 | protein_coding | deleterious(0) | possibly_damaging(0.802) | TCGA-A8-A06U-01 | Breast | breast invasive carcinoma | Female | >=65 | I/II | Unknown | Unknown | SD |
| DENND1B | SNV | Missense_Mutation | | c.976N>A | p.Val326Ile | p.V326I | Q6P3S1 | protein_coding | deleterious(0.01) | possibly_damaging(0.646) | TCGA-A8-A07L-01 | Breast | breast invasive carcinoma | Female | <65 | III/IV | Chemotherapy | | CR |
| DENND1B | SNV | Missense_Mutation | novel | c.2139N>A | p.Asp713Glu | p.D713E | Q6P3S1 | protein_coding | tolerated_low_confidence(0.13) | possibly_damaging(0.647) | TCGA-A8-A09W-01 | Breast | breast invasive carcinoma | Female | >=65 | III/IV | Unknown | Unknown | SD |
| DENND1B | SNV | Missense_Mutation | novel | c.1623A>C | p.Glu541Asp | p.E541D | Q6P3S1 | protein_coding | tolerated(0.15) | benign(0.088) | TCGA-AO-A0JB-01 | Breast | breast invasive carcinoma | Female | <65 | III/IV | Chemotherapy | cyclophosphamide | SD |
| DENND1B | SNV | Missense_Mutation | novel | c.1958N>G | p.Ser653Cys | p.S653C | Q6P3S1 | protein_coding | tolerated(0.06) | probably_damaging(0.965) | TCGA-BH-A0DZ-01 | Breast | breast invasive carcinoma | Female | <65 | I/II | Chemotherapy | docetaxel | SD |
| DENND1B | SNV | Missense_Mutation | rs757972002 | c.1903N>A | p.Asp635Asn | p.D635N | Q6P3S1 | protein_coding | deleterious(0) | probably_damaging(0.974) | TCGA-BH-A0HA-01 | Breast | breast invasive carcinoma | Female | <65 | I/II | Unknown | Unknown | SD |
| DENND1B | SNV | Missense_Mutation | rs371428108 | c.2272G>A | p.Asp758Asn | p.D758N | Q6P3S1 | protein_coding | tolerated_low_confidence(0.09) | benign(0.062) | TCGA-E2-A1B1-01 | Breast | breast invasive carcinoma | Female | <65 | I/II | Other, specify in notesbiphosphonate | zoledronic | SD |
| DENND1B | SNV | Missense_Mutation | novel | c.988N>A | p.Phe330Ile | p.F330I | Q6P3S1 | protein_coding | deleterious(0) | probably_damaging(0.967) | TCGA-UU-A93S-01 | Breast | breast invasive carcinoma | Female | <65 | III/IV | Unknown | Unknown | PD |
| DENND1B | insertion | Frame_Shift_Ins | novel | c.1842_1843insCTGA | p.Asn615LeufsTer12 | p.N615Lfs*12 | Q6P3S1 | protein_coding | | | TCGA-AO-A128-01 | Breast | breast invasive carcinoma | Female | <65 | I/II | Chemotherapy | doxorubicin | SD |


