
|
|||||
|
 | |
| |
| |
| |
| |
| |
|
Gene: DENND1A |
Gene summary for DENND1A |
| Gene information | Species | Human | Gene symbol | DENND1A | Gene ID | 57706 |
| Gene name | DENN domain containing 1A | |
| Gene Alias | FAM31A | |
| Cytomap | 9q33.3 | |
| Gene Type | protein-coding | GO ID | GO:0006810 | UniProtAcc | Q8TEH3 |
Top |
Malignant transformation analysis |
| Identification of the aberrant gene expression in precancerous and cancerous lesions by comparing the gene expression of stem-like cells in diseased tissues with normal stem cells |
| Entrez ID | Symbol | Replicates | Species | Organ | Tissue | Adj P-value | Log2FC | Malignancy |
| 57706 | DENND1A | CCI_1 | Human | Cervix | CC | 4.82e-10 | 7.25e-01 | 0.528 |
| 57706 | DENND1A | CCI_2 | Human | Cervix | CC | 1.02e-12 | 1.19e+00 | 0.5249 |
| 57706 | DENND1A | CCI_3 | Human | Cervix | CC | 7.53e-30 | 1.36e+00 | 0.516 |
| 57706 | DENND1A | HTA11_3410_2000001011 | Human | Colorectum | AD | 7.87e-14 | -6.00e-01 | 0.0155 |
| 57706 | DENND1A | HTA11_347_2000001011 | Human | Colorectum | AD | 1.16e-07 | 4.51e-01 | -0.1954 |
| 57706 | DENND1A | HTA11_10623_2000001011 | Human | Colorectum | AD | 6.47e-04 | -1.88e-01 | -0.0177 |
| 57706 | DENND1A | HTA11_99999970781_79442 | Human | Colorectum | MSS | 3.27e-08 | -3.26e-01 | 0.294 |
| 57706 | DENND1A | HTA11_99999974143_84620 | Human | Colorectum | MSS | 8.23e-05 | -3.15e-01 | 0.3005 |
| 57706 | DENND1A | A015-C-203 | Human | Colorectum | FAP | 1.38e-37 | -6.50e-01 | -0.1294 |
| 57706 | DENND1A | A015-C-204 | Human | Colorectum | FAP | 1.64e-03 | -3.38e-01 | -0.0228 |
| 57706 | DENND1A | A014-C-040 | Human | Colorectum | FAP | 1.13e-07 | -7.54e-01 | -0.1184 |
| 57706 | DENND1A | A002-C-201 | Human | Colorectum | FAP | 9.94e-13 | -4.57e-01 | 0.0324 |
| 57706 | DENND1A | A001-C-119 | Human | Colorectum | FAP | 2.28e-12 | -7.37e-01 | -0.1557 |
| 57706 | DENND1A | A001-C-108 | Human | Colorectum | FAP | 2.07e-26 | -5.28e-01 | -0.0272 |
| 57706 | DENND1A | A002-C-205 | Human | Colorectum | FAP | 2.44e-24 | -6.56e-01 | -0.1236 |
| 57706 | DENND1A | A001-C-104 | Human | Colorectum | FAP | 1.28e-06 | -3.57e-01 | 0.0184 |
| 57706 | DENND1A | A015-C-005 | Human | Colorectum | FAP | 5.64e-05 | -4.41e-01 | -0.0336 |
| 57706 | DENND1A | A015-C-006 | Human | Colorectum | FAP | 1.12e-16 | -6.38e-01 | -0.0994 |
| 57706 | DENND1A | A015-C-106 | Human | Colorectum | FAP | 1.58e-14 | -3.95e-01 | -0.0511 |
| 57706 | DENND1A | A002-C-114 | Human | Colorectum | FAP | 1.17e-22 | -7.17e-01 | -0.1561 |
| Page: 1 2 3 4 |
| Tissue | Expression Dynamics | Abbreviation |
| Cervix | 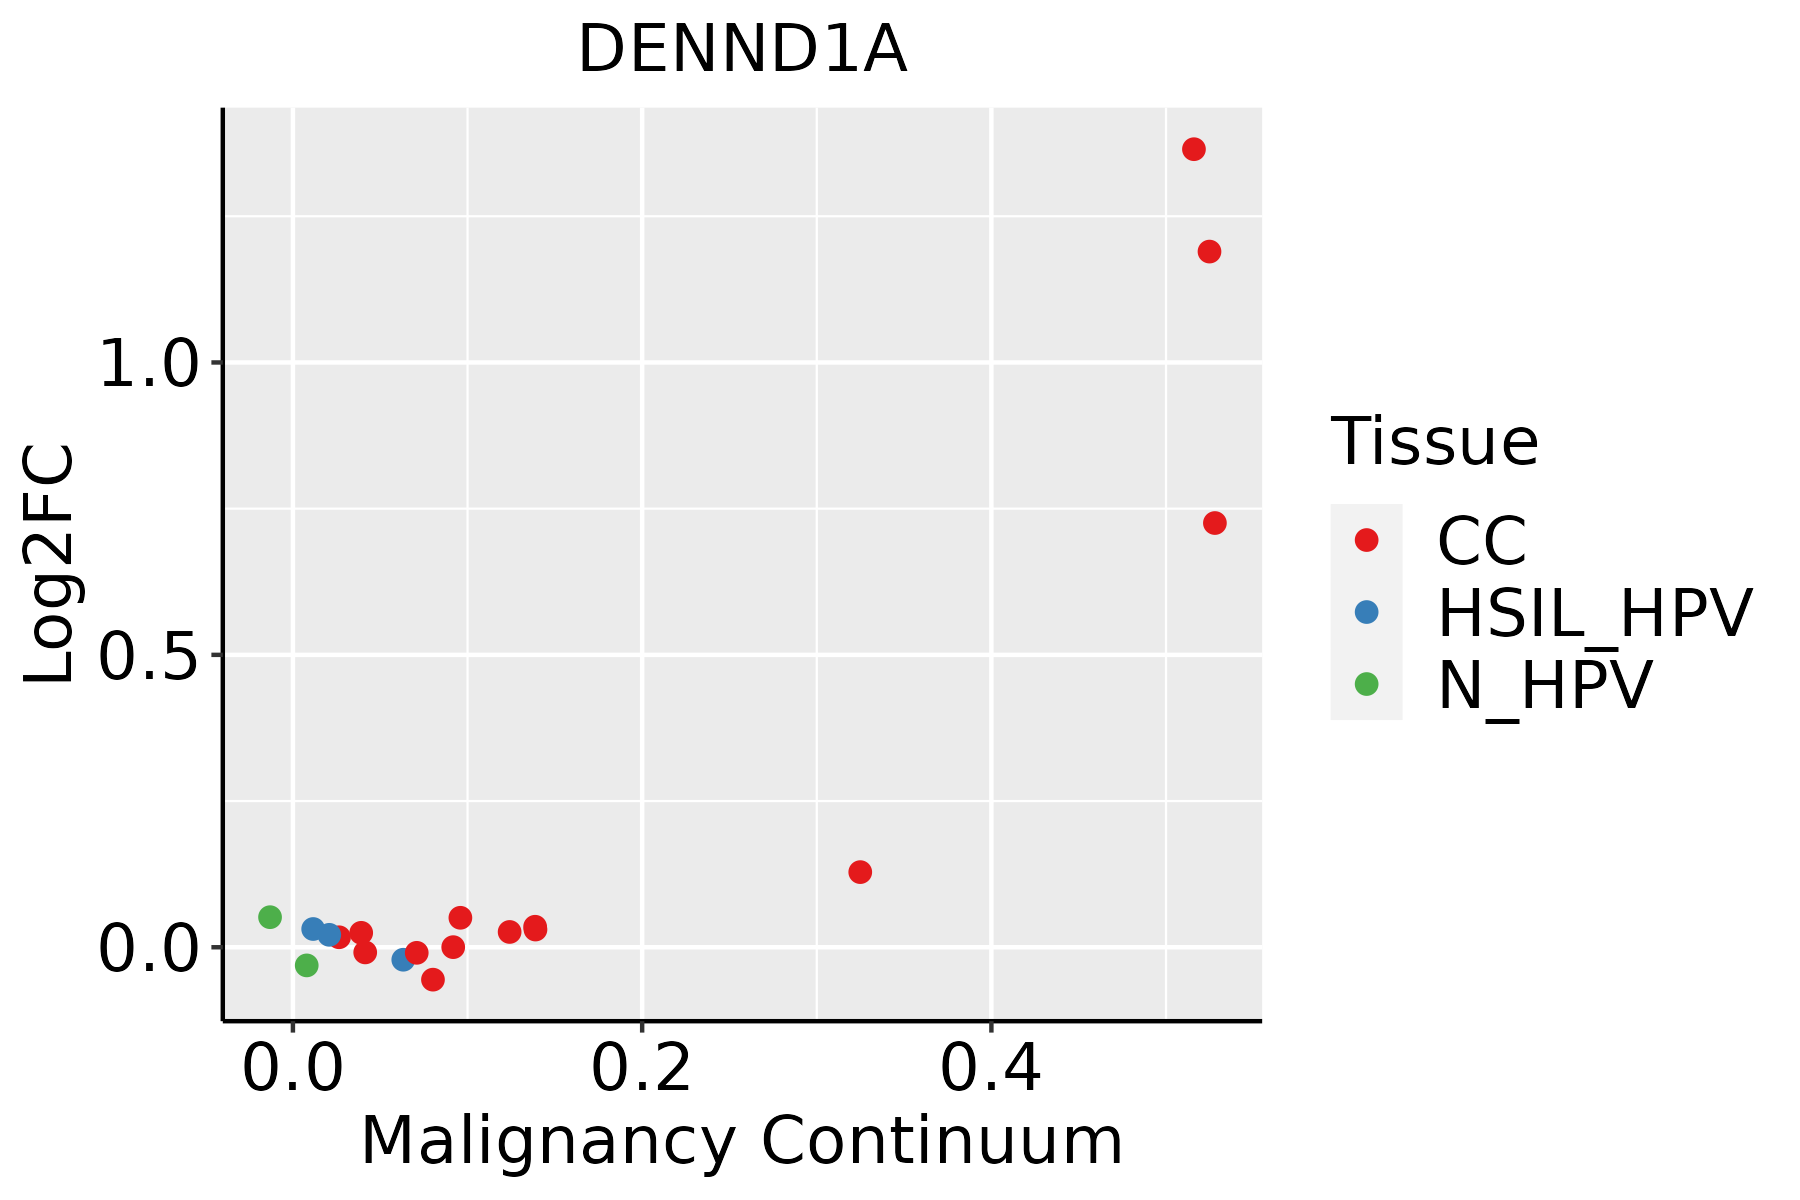 | CC: Cervix cancer |
| HSIL_HPV: HPV-infected high-grade squamous intraepithelial lesions | ||
| N_HPV: HPV-infected normal cervix | ||
| Colorectum (GSE201348) |  | FAP: Familial adenomatous polyposis |
| CRC: Colorectal cancer | ||
| Colorectum (HTA11) |  | AD: Adenomas |
| SER: Sessile serrated lesions | ||
| MSI-H: Microsatellite-high colorectal cancer | ||
| MSS: Microsatellite stable colorectal cancer | ||
| Endometrium | 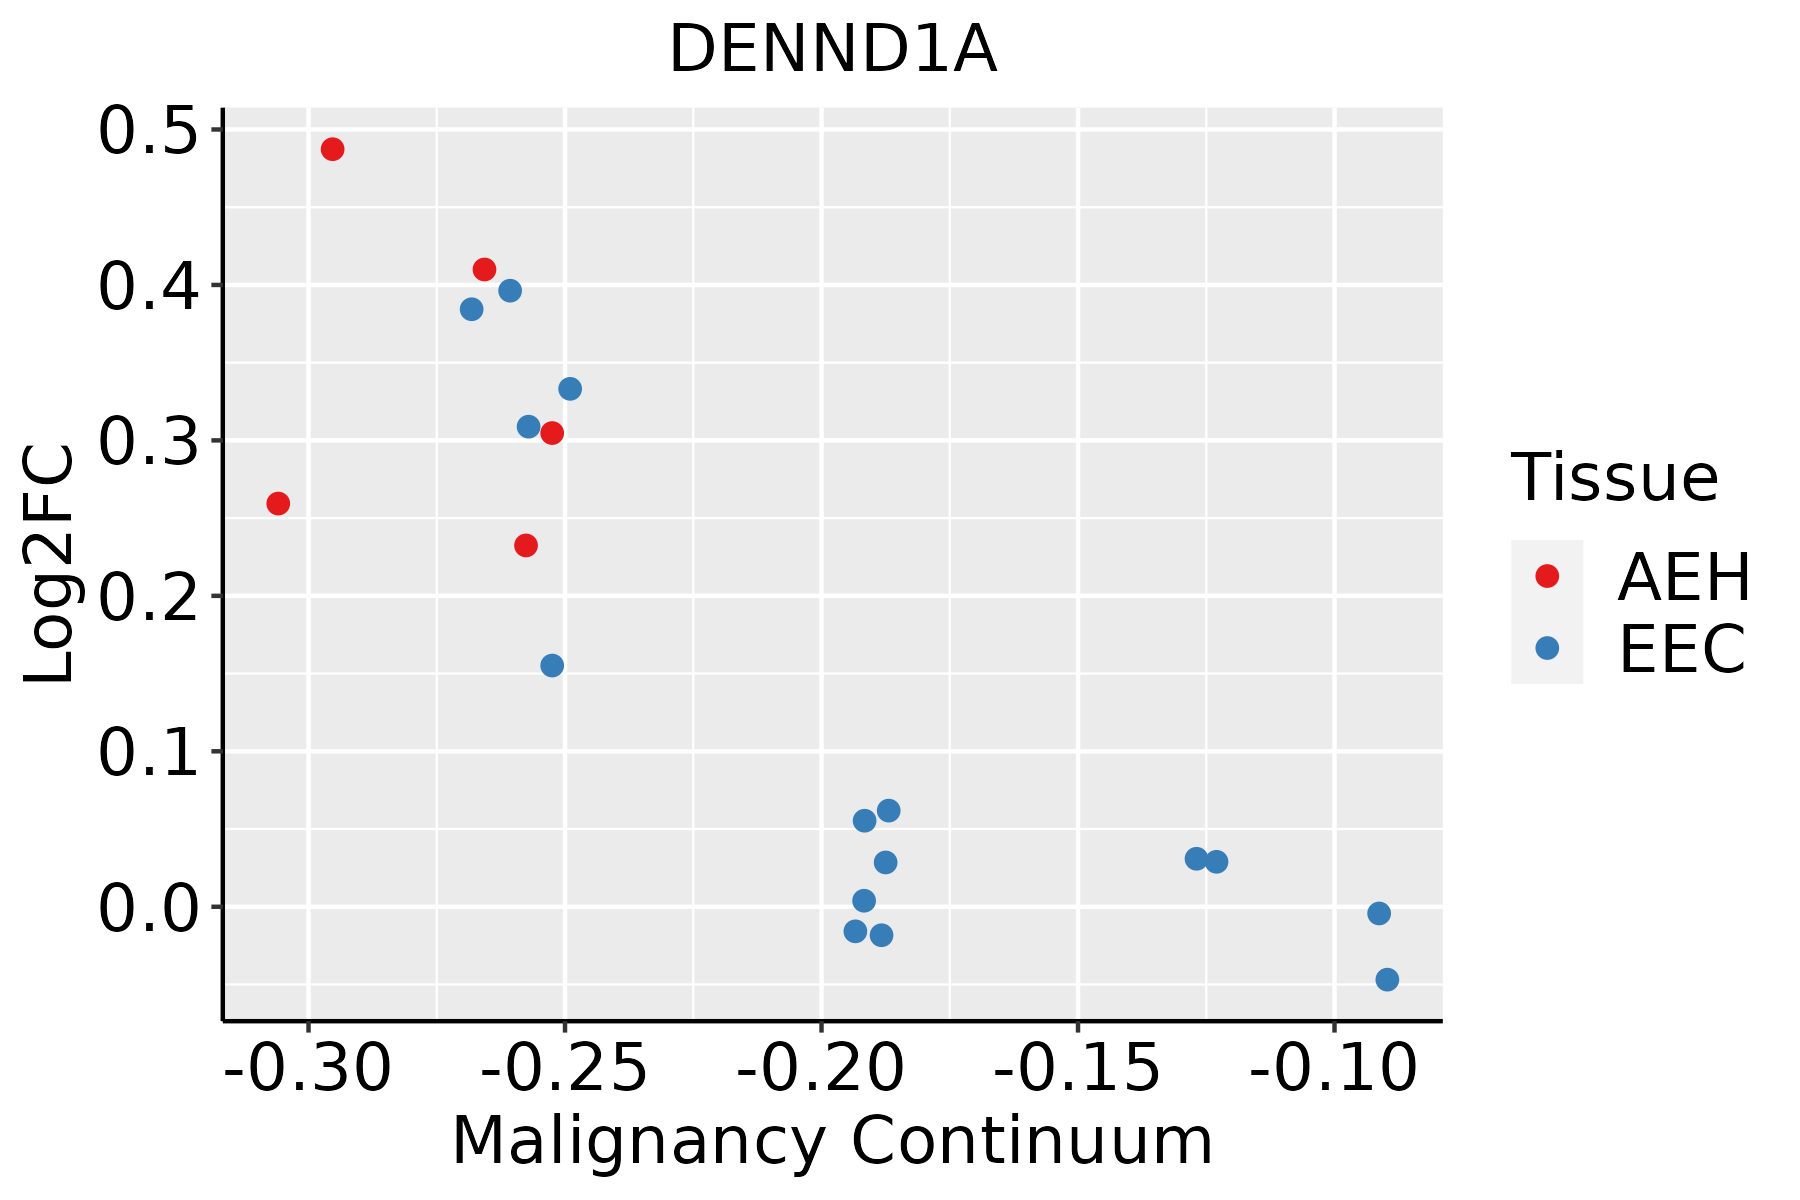 | AEH: Atypical endometrial hyperplasia |
| EEC: Endometrioid Cancer | ||
| Liver | 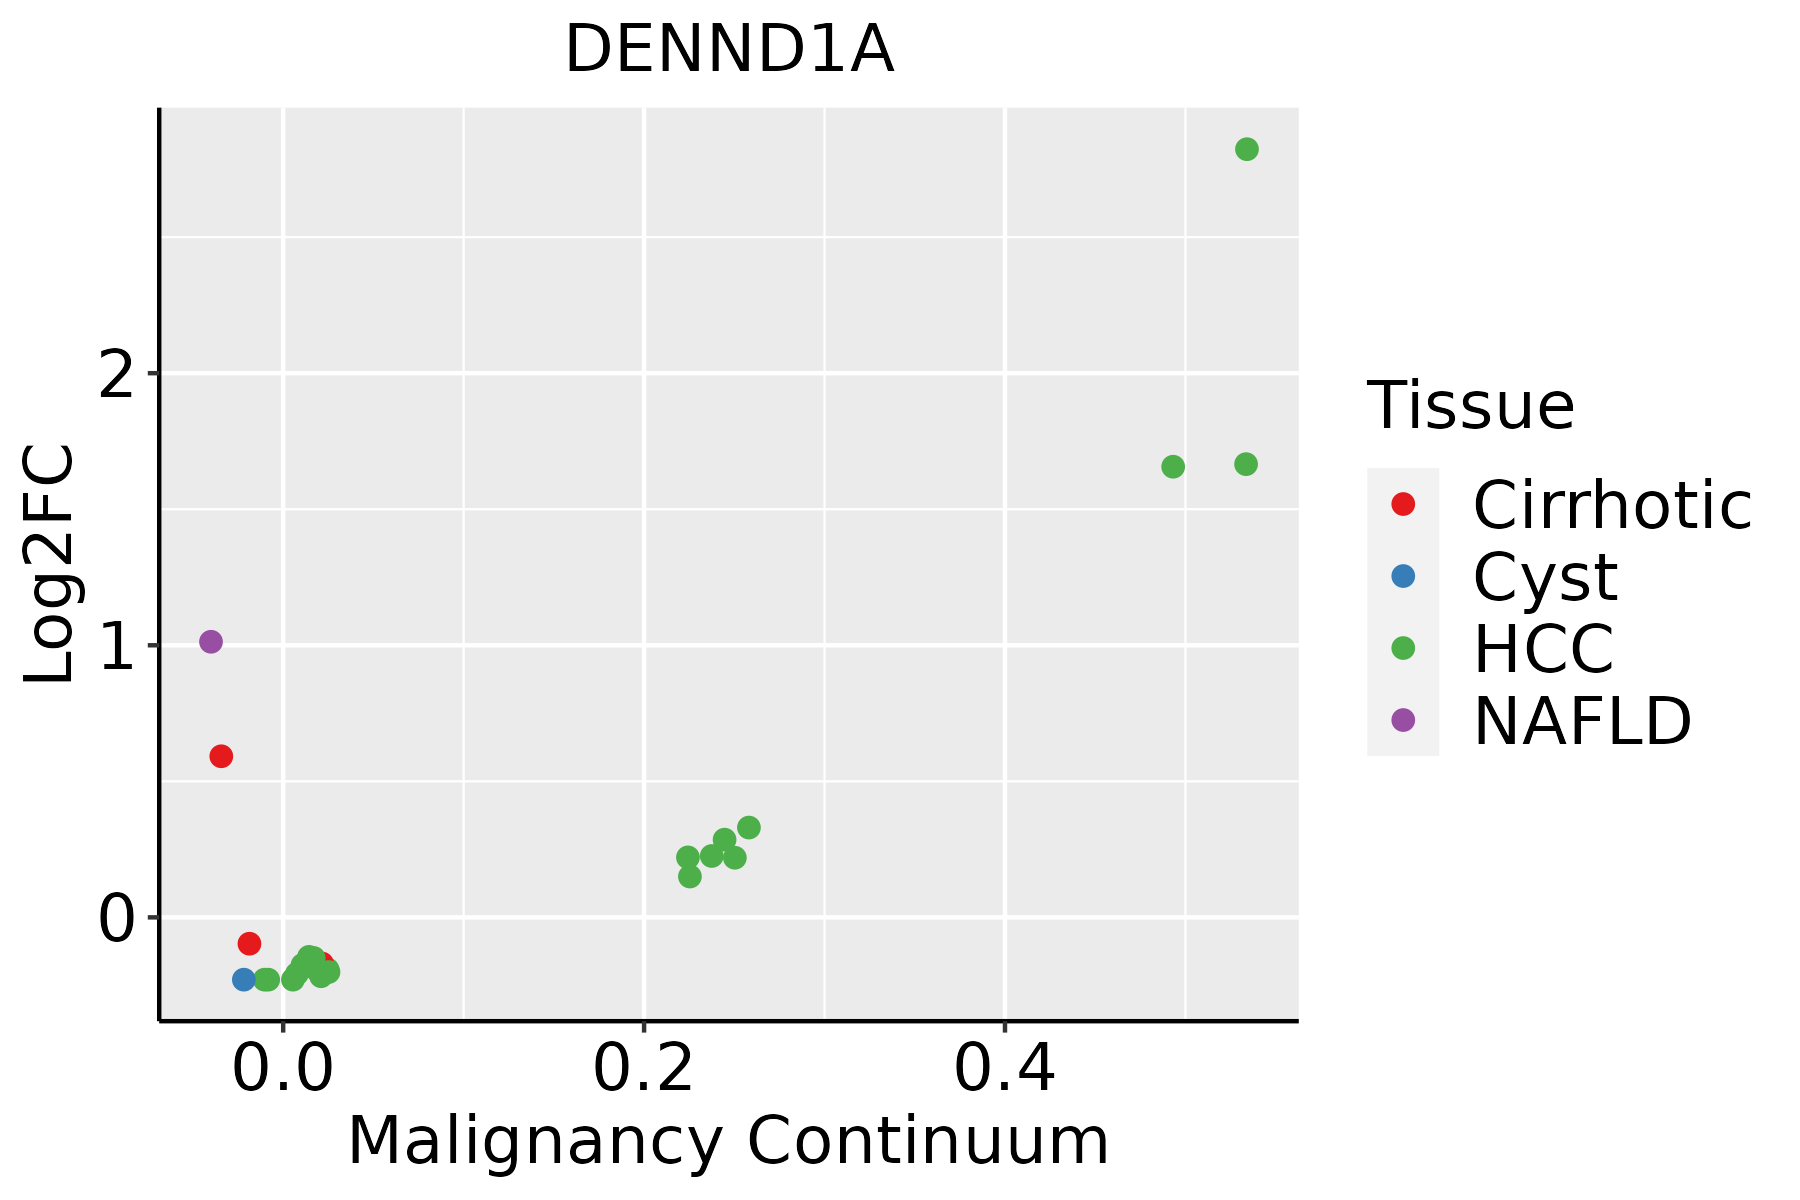 | HCC: Hepatocellular carcinoma |
| NAFLD: Non-alcoholic fatty liver disease | ||
| Lung |  | AAH: Atypical adenomatous hyperplasia |
| AIS: Adenocarcinoma in situ | ||
| IAC: Invasive lung adenocarcinoma | ||
| MIA: Minimally invasive adenocarcinoma |
| ∗log2FC in expression of this searched gene in stem-like cells from each diseased tissue sample relative to stem-like cells in normal samples in each tissue plotted against the malignancy continuum. Samples are colored based on if they are from different disease stage. |
Top |
Malignant transformation related pathway analysis |
| Find out the enriched GO biological processes and KEGG pathways involved in transition from healthy to precancer to cancer |
| Tissue | Disease Stage | Enriched GO biological Processes |
| Colorectum | AD |  |
| Colorectum | SER |  |
| Colorectum | MSS |  |
| Colorectum | MSI-H |  |
| Colorectum | FAP |  |
| ∗Top 15 enriched GO BP terms are showed in the bar plot of each disease state in each tissue. Each row represents a significant GO biological process which is colored according to the -log10(p.adjust). |
| Page: 1 2 3 4 5 6 7 8 9 |
| GO ID | Tissue | Disease Stage | Description | Gene Ratio | Bg Ratio | pvalue | p.adjust | Count |
| GO:00510566 | Cervix | CC | regulation of small GTPase mediated signal transduction | 75/2311 | 302/18723 | 1.54e-09 | 1.74e-07 | 75 |
| GO:00072656 | Cervix | CC | Ras protein signal transduction | 79/2311 | 337/18723 | 9.49e-09 | 7.77e-07 | 79 |
| GO:00430877 | Cervix | CC | regulation of GTPase activity | 79/2311 | 348/18723 | 4.21e-08 | 2.60e-06 | 79 |
| GO:00465785 | Cervix | CC | regulation of Ras protein signal transduction | 44/2311 | 189/18723 | 2.05e-05 | 3.73e-04 | 44 |
| GO:00988767 | Cervix | CC | vesicle-mediated transport to the plasma membrane | 34/2311 | 136/18723 | 3.75e-05 | 5.91e-04 | 34 |
| GO:00435476 | Cervix | CC | positive regulation of GTPase activity | 53/2311 | 255/18723 | 8.72e-05 | 1.16e-03 | 53 |
| GO:00161977 | Cervix | CC | endosomal transport | 48/2311 | 230/18723 | 1.65e-04 | 1.97e-03 | 48 |
| GO:00484883 | Cervix | CC | synaptic vesicle endocytosis | 16/2311 | 62/18723 | 2.87e-03 | 1.91e-02 | 16 |
| GO:01402383 | Cervix | CC | presynaptic endocytosis | 16/2311 | 62/18723 | 2.87e-03 | 1.91e-02 | 16 |
| GO:00364655 | Cervix | CC | synaptic vesicle recycling | 17/2311 | 75/18723 | 8.87e-03 | 4.53e-02 | 17 |
| GO:0016197 | Colorectum | AD | endosomal transport | 90/3918 | 230/18723 | 1.88e-10 | 1.73e-08 | 90 |
| GO:0098876 | Colorectum | AD | vesicle-mediated transport to the plasma membrane | 57/3918 | 136/18723 | 2.30e-08 | 1.27e-06 | 57 |
| GO:0043087 | Colorectum | AD | regulation of GTPase activity | 110/3918 | 348/18723 | 1.64e-06 | 5.03e-05 | 110 |
| GO:0007265 | Colorectum | AD | Ras protein signal transduction | 104/3918 | 337/18723 | 1.01e-05 | 2.35e-04 | 104 |
| GO:0051056 | Colorectum | AD | regulation of small GTPase mediated signal transduction | 94/3918 | 302/18723 | 1.81e-05 | 3.76e-04 | 94 |
| GO:0032456 | Colorectum | AD | endocytic recycling | 28/3918 | 73/18723 | 4.87e-04 | 5.30e-03 | 28 |
| GO:0043547 | Colorectum | AD | positive regulation of GTPase activity | 75/3918 | 255/18723 | 7.95e-04 | 7.91e-03 | 75 |
| GO:0046578 | Colorectum | AD | regulation of Ras protein signal transduction | 56/3918 | 189/18723 | 2.85e-03 | 2.14e-02 | 56 |
| GO:0099003 | Colorectum | AD | vesicle-mediated transport in synapse | 57/3918 | 200/18723 | 6.53e-03 | 4.06e-02 | 57 |
| GO:00988762 | Colorectum | MSS | vesicle-mediated transport to the plasma membrane | 54/3467 | 136/18723 | 6.20e-09 | 3.95e-07 | 54 |
| Page: 1 2 3 4 5 6 |
| Pathway ID | Tissue | Disease Stage | Description | Gene Ratio | Bg Ratio | pvalue | p.adjust | qvalue | Count |
| Page: 1 |
Top |
Cell-cell communication analysis |
| Identification of potential cell-cell interactions between two cell types and their ligand-receptor pairs for different disease states |
| Ligand | Receptor | LRpair | Pathway | Tissue | Disease Stage |
| Page: 1 |
Top |
Single-cell gene regulatory network inference analysis |
| Find out the significant the regulons (TFs) and the target genes of each regulon across cell types for different disease states |
| TF | Cell Type | Tissue | Disease Stage | Target Gene | RSS | Regulon Activity |
| ∗The dot plots of a searched regulon are shown for all cell subpopulations in each disease state of each tissue based on the regulon specific score inferred using pySCENIC and by calculating the average expression. |
| Page: 1 |
Top |
Somatic mutation of malignant transformation related genes |
| Annotation of somatic variants for genes involved in malignant transformation |
| Hugo Symbol | Variant Class | Variant Classification | dbSNP RS | HGVSc | HGVSp | HGVSp Short | SWISSPROT | BIOTYPE | SIFT | PolyPhen | Tumor Sample Barcode | Tissue | Histology | Sex | Age | Stage | Therapy Types | Drugs | Outcome |
| DENND1A | SNV | Missense_Mutation | c.184C>T | p.Leu62Phe | p.L62F | Q8TEH3 | protein_coding | tolerated(0.21) | possibly_damaging(0.722) | TCGA-A2-A0EY-01 | Breast | breast invasive carcinoma | Female | <65 | I/II | Chemotherapy | adriamycin | SD | |
| DENND1A | SNV | Missense_Mutation | c.773N>C | p.Arg258Thr | p.R258T | Q8TEH3 | protein_coding | deleterious(0) | benign(0.374) | TCGA-A7-A26H-01 | Breast | breast invasive carcinoma | Female | >=65 | I/II | Hormone Therapy | anastrozole | PD | |
| DENND1A | SNV | Missense_Mutation | c.1281N>A | p.Met427Ile | p.M427I | Q8TEH3 | protein_coding | deleterious(0.02) | benign(0.354) | TCGA-AC-A23H-01 | Breast | breast invasive carcinoma | Female | >=65 | I/II | Unknown | Unknown | PD | |
| DENND1A | SNV | Missense_Mutation | c.1180N>A | p.Tyr394Asn | p.Y394N | Q8TEH3 | protein_coding | deleterious(0.01) | possibly_damaging(0.671) | TCGA-D8-A1XQ-01 | Breast | breast invasive carcinoma | Female | >=65 | I/II | Unknown | Unknown | SD | |
| DENND1A | SNV | Missense_Mutation | novel | c.119N>T | p.Asp40Val | p.D40V | Q8TEH3 | protein_coding | deleterious(0) | probably_damaging(0.941) | TCGA-OK-A5Q2-01 | Breast | breast invasive carcinoma | Female | <65 | I/II | Unknown | Unknown | SD |
| DENND1A | SNV | Missense_Mutation | rs201746975 | c.2698N>T | p.Pro900Ser | p.P900S | Q8TEH3 | protein_coding | tolerated_low_confidence(0.31) | probably_damaging(0.996) | TCGA-S3-AA0Z-01 | Breast | breast invasive carcinoma | Female | <65 | I/II | Ancillary | neulasta | CR |
| DENND1A | deletion | In_Frame_Del | c.458_460delNNN | p.Ser153del | p.S153del | Q8TEH3 | protein_coding | TCGA-C8-A1HG-01 | Breast | breast invasive carcinoma | Female | <65 | I/II | Unknown | Unknown | SD | |||
| DENND1A | deletion | Frame_Shift_Del | novel | c.1223delT | p.Val408AlafsTer9 | p.V408Afs*9 | Q8TEH3 | protein_coding | TCGA-EW-A2FV-01 | Breast | breast invasive carcinoma | Female | <65 | III/IV | Chemotherapy | docetaxel | SD | ||
| DENND1A | SNV | Missense_Mutation | rs769475609 | c.2102N>A | p.Arg701Gln | p.R701Q | Q8TEH3 | protein_coding | deleterious(0) | probably_damaging(0.994) | TCGA-C5-A2LV-01 | Cervix | cervical & endocervical cancer | Female | <65 | I/II | Unknown | Unknown | SD |
| DENND1A | SNV | Missense_Mutation | rs775924786 | c.2407N>A | p.Ala803Thr | p.A803T | Q8TEH3 | protein_coding | tolerated_low_confidence(0.62) | benign(0) | TCGA-5M-AAT6-01 | Colorectum | colon adenocarcinoma | Female | <65 | III/IV | Unknown | Unknown | PD |
| Page: 1 2 3 4 5 6 7 8 9 10 |
Top |
Related drugs of malignant transformation related genes |
| Identification of chemicals and drugs interact with genes involved in malignant transfromation |
| (DGIdb 4.0) |
| Entrez ID | Symbol | Category | Interaction Types | Drug Claim Name | Drug Name | PMIDs |
| Page: 1 |

Copyright 2023-Present -The University of Texas Health Science Center at Houston |