
|
|||||
|
 | |
| |
| |
| |
| |
| |
|
Gene: DEGS2 |
Gene summary for DEGS2 |
| Gene information | Species | Human | Gene symbol | DEGS2 | Gene ID | 123099 |
| Gene name | delta 4-desaturase, sphingolipid 2 | |
| Gene Alias | C14orf66 | |
| Cytomap | 14q32.2 | |
| Gene Type | protein-coding | GO ID | GO:0006066 | UniProtAcc | Q6QHC5 |
Top |
Malignant transformation analysis |
| Identification of the aberrant gene expression in precancerous and cancerous lesions by comparing the gene expression of stem-like cells in diseased tissues with normal stem cells |
| Entrez ID | Symbol | Replicates | Species | Organ | Tissue | Adj P-value | Log2FC | Malignancy |
| 123099 | DEGS2 | GSM4909293 | Human | Breast | IDC | 2.20e-18 | 4.26e-01 | 0.1581 |
| 123099 | DEGS2 | GSM4909298 | Human | Breast | IDC | 4.84e-17 | 4.91e-01 | 0.1551 |
| 123099 | DEGS2 | GSM4909301 | Human | Breast | IDC | 2.93e-02 | 2.50e-01 | 0.1577 |
| 123099 | DEGS2 | GSM4909302 | Human | Breast | IDC | 4.31e-16 | 5.35e-01 | 0.1545 |
| 123099 | DEGS2 | GSM4909303 | Human | Breast | IDC | 1.29e-02 | 3.39e-01 | 0.0438 |
| 123099 | DEGS2 | GSM4909304 | Human | Breast | IDC | 3.89e-71 | 1.09e+00 | 0.1636 |
| 123099 | DEGS2 | GSM4909305 | Human | Breast | IDC | 1.40e-08 | 3.91e-01 | 0.0436 |
| 123099 | DEGS2 | GSM4909306 | Human | Breast | IDC | 1.22e-16 | 5.24e-01 | 0.1564 |
| 123099 | DEGS2 | GSM4909307 | Human | Breast | IDC | 1.62e-06 | 3.38e-01 | 0.1569 |
| 123099 | DEGS2 | GSM4909308 | Human | Breast | IDC | 2.69e-25 | 5.58e-01 | 0.158 |
| 123099 | DEGS2 | GSM4909311 | Human | Breast | IDC | 3.25e-03 | 1.50e-01 | 0.1534 |
| 123099 | DEGS2 | GSM4909312 | Human | Breast | IDC | 1.30e-06 | 3.81e-01 | 0.1552 |
| 123099 | DEGS2 | GSM4909315 | Human | Breast | IDC | 1.35e-09 | 4.18e-01 | 0.21 |
| 123099 | DEGS2 | GSM4909317 | Human | Breast | IDC | 4.13e-30 | 6.87e-01 | 0.1355 |
| 123099 | DEGS2 | GSM4909319 | Human | Breast | IDC | 1.98e-18 | 6.52e-01 | 0.1563 |
| 123099 | DEGS2 | GSM4909320 | Human | Breast | IDC | 2.05e-08 | 5.43e-01 | 0.1575 |
| 123099 | DEGS2 | GSM4909321 | Human | Breast | IDC | 4.23e-15 | 5.50e-01 | 0.1559 |
| 123099 | DEGS2 | ctrl6 | Human | Breast | Precancer | 2.41e-04 | 3.41e-01 | -0.0061 |
| 123099 | DEGS2 | brca10 | Human | Breast | Precancer | 3.82e-23 | 6.23e-01 | -0.0029 |
| 123099 | DEGS2 | M1 | Human | Breast | IDC | 4.27e-02 | 2.54e-01 | 0.1577 |
| Page: 1 2 3 |
| Tissue | Expression Dynamics | Abbreviation |
| Breast | 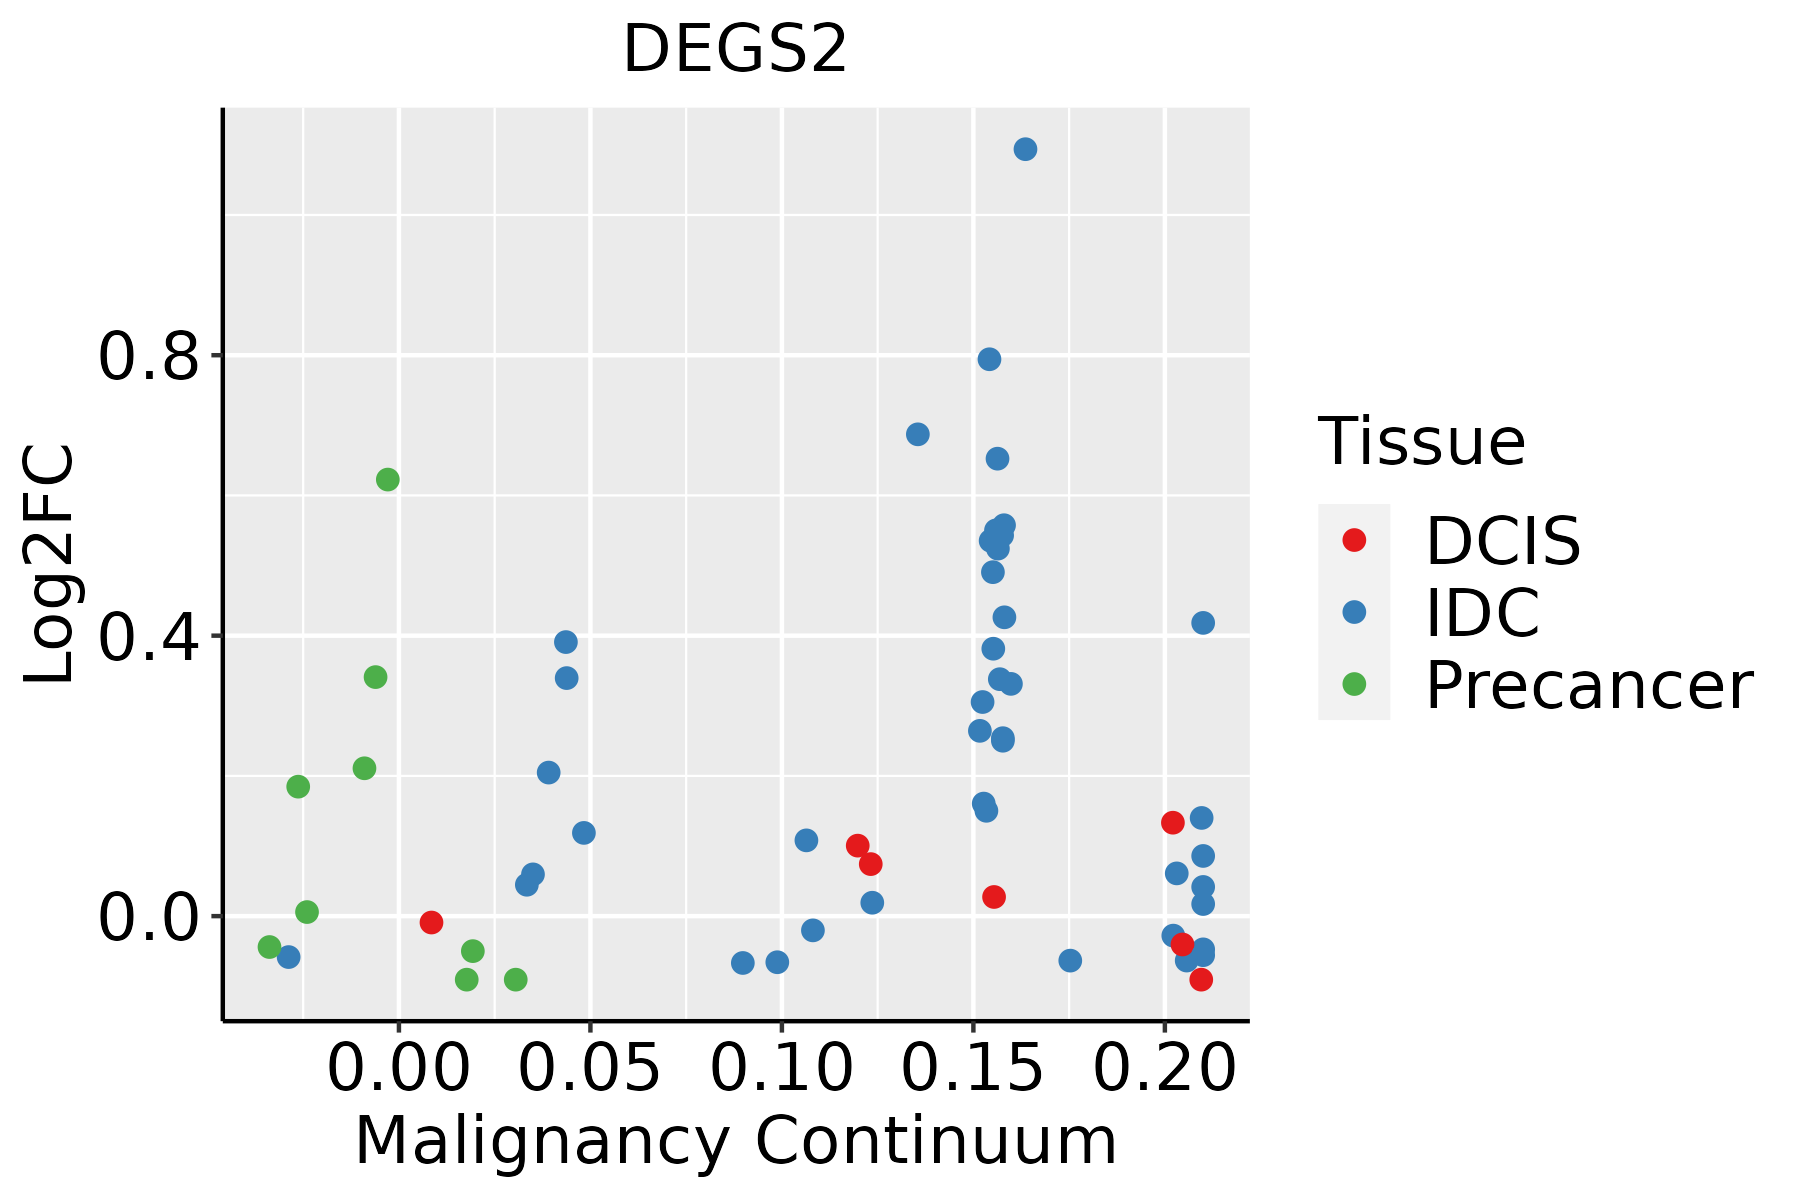 | IDC: Invasive ductal carcinoma |
| DCIS: Ductal carcinoma in situ | ||
| Precancer(BRCA1-mut): Precancerous lesion from BRCA1 mutation carriers | ||
| Esophagus | 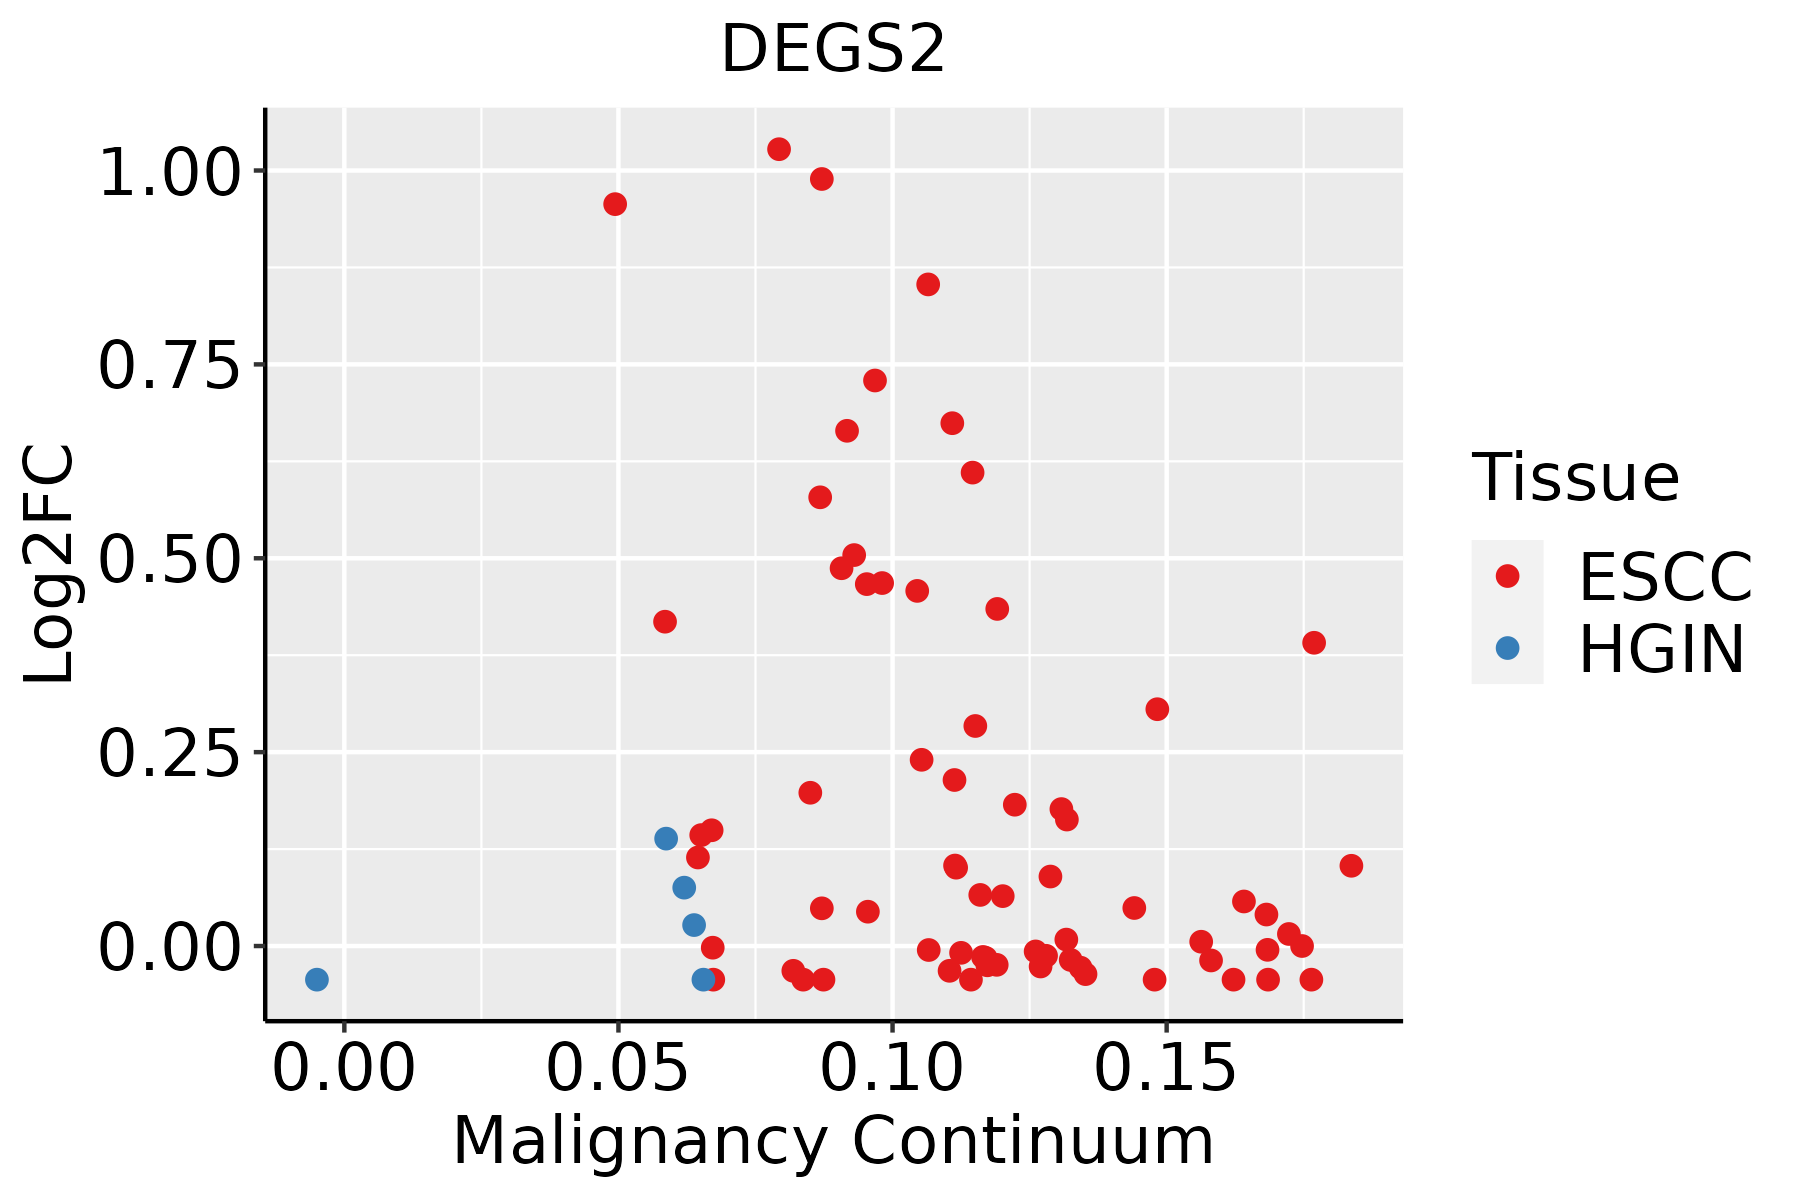 | ESCC: Esophageal squamous cell carcinoma |
| HGIN: High-grade intraepithelial neoplasias | ||
| LGIN: Low-grade intraepithelial neoplasias | ||
| GC |  | CAG: Chronic atrophic gastritis |
| CAG with IM: Chronic atrophic gastritis with intestinal metaplasia | ||
| CSG: Chronic superficial gastritis | ||
| GC: Gastric cancer | ||
| SIM: Severe intestinal metaplasia | ||
| WIM: Wild intestinal metaplasia |
| ∗log2FC in expression of this searched gene in stem-like cells from each diseased tissue sample relative to stem-like cells in normal samples in each tissue plotted against the malignancy continuum. Samples are colored based on if they are from different disease stage. |
Top |
Malignant transformation related pathway analysis |
| Find out the enriched GO biological processes and KEGG pathways involved in transition from healthy to precancer to cancer |
| Tissue | Disease Stage | Enriched GO biological Processes |
| Colorectum | AD |  |
| Colorectum | SER |  |
| Colorectum | MSS |  |
| Colorectum | MSI-H |  |
| Colorectum | FAP |  |
| ∗Top 15 enriched GO BP terms are showed in the bar plot of each disease state in each tissue. Each row represents a significant GO biological process which is colored according to the -log10(p.adjust). |
| Page: 1 2 3 4 5 6 7 8 9 |
| GO ID | Tissue | Disease Stage | Description | Gene Ratio | Bg Ratio | pvalue | p.adjust | Count |
| GO:00066433 | Esophagus | ESCC | membrane lipid metabolic process | 130/8552 | 203/18723 | 9.29e-08 | 1.54e-06 | 130 |
| GO:00464673 | Esophagus | ESCC | membrane lipid biosynthetic process | 91/8552 | 142/18723 | 7.19e-06 | 7.19e-05 | 91 |
| GO:00060668 | Esophagus | ESCC | alcohol metabolic process | 202/8552 | 353/18723 | 7.32e-06 | 7.26e-05 | 202 |
| GO:00066652 | Esophagus | ESCC | sphingolipid metabolic process | 96/8552 | 155/18723 | 3.21e-05 | 2.66e-04 | 96 |
| GO:00301481 | Esophagus | ESCC | sphingolipid biosynthetic process | 62/8552 | 103/18723 | 2.10e-03 | 9.38e-03 | 62 |
| GO:00066721 | Esophagus | ESCC | ceramide metabolic process | 61/8552 | 102/18723 | 2.82e-03 | 1.19e-02 | 61 |
| GO:0046513 | Esophagus | ESCC | ceramide biosynthetic process | 40/8552 | 65/18723 | 7.25e-03 | 2.63e-02 | 40 |
| GO:00060665 | Stomach | GC | alcohol metabolic process | 41/1159 | 353/18723 | 7.85e-05 | 1.68e-03 | 41 |
| Page: 1 |
| Pathway ID | Tissue | Disease Stage | Description | Gene Ratio | Bg Ratio | pvalue | p.adjust | qvalue | Count |
| hsa0407116 | Esophagus | ESCC | Sphingolipid signaling pathway | 85/4205 | 121/8465 | 3.04e-06 | 1.73e-05 | 8.84e-06 | 85 |
| hsa006003 | Esophagus | ESCC | Sphingolipid metabolism | 36/4205 | 53/8465 | 5.41e-03 | 1.36e-02 | 6.99e-03 | 36 |
| hsa0407117 | Esophagus | ESCC | Sphingolipid signaling pathway | 85/4205 | 121/8465 | 3.04e-06 | 1.73e-05 | 8.84e-06 | 85 |
| hsa0060012 | Esophagus | ESCC | Sphingolipid metabolism | 36/4205 | 53/8465 | 5.41e-03 | 1.36e-02 | 6.99e-03 | 36 |
| Page: 1 |
Top |
Cell-cell communication analysis |
| Identification of potential cell-cell interactions between two cell types and their ligand-receptor pairs for different disease states |
| Ligand | Receptor | LRpair | Pathway | Tissue | Disease Stage |
| Page: 1 |
Top |
Single-cell gene regulatory network inference analysis |
| Find out the significant the regulons (TFs) and the target genes of each regulon across cell types for different disease states |
| TF | Cell Type | Tissue | Disease Stage | Target Gene | RSS | Regulon Activity |
| ∗The dot plots of a searched regulon are shown for all cell subpopulations in each disease state of each tissue based on the regulon specific score inferred using pySCENIC and by calculating the average expression. |
| Page: 1 |
Top |
Somatic mutation of malignant transformation related genes |
| Annotation of somatic variants for genes involved in malignant transformation |
| Hugo Symbol | Variant Class | Variant Classification | dbSNP RS | HGVSc | HGVSp | HGVSp Short | SWISSPROT | BIOTYPE | SIFT | PolyPhen | Tumor Sample Barcode | Tissue | Histology | Sex | Age | Stage | Therapy Types | Drugs | Outcome |
| DEGS2 | SNV | Missense_Mutation | c.31N>C | p.Glu11Gln | p.E11Q | Q6QHC5 | protein_coding | tolerated(0.12) | probably_damaging(0.999) | TCGA-E2-A1IN-01 | Breast | breast invasive carcinoma | Female | <65 | I/II | Hormone Therapy | arimidex | SD | |
| DEGS2 | SNV | Missense_Mutation | c.844N>A | p.Glu282Lys | p.E282K | Q6QHC5 | protein_coding | deleterious(0) | probably_damaging(0.996) | TCGA-2W-A8YY-01 | Cervix | cervical & endocervical cancer | Female | <65 | I/II | Chemotherapy | cisplatin | CR | |
| DEGS2 | SNV | Missense_Mutation | rs367704730 | c.185N>A | p.Arg62His | p.R62H | Q6QHC5 | protein_coding | tolerated(0.19) | benign(0) | TCGA-2W-A8YY-01 | Cervix | cervical & endocervical cancer | Female | <65 | I/II | Chemotherapy | cisplatin | CR |
| DEGS2 | SNV | Missense_Mutation | novel | c.273C>G | p.Ile91Met | p.I91M | Q6QHC5 | protein_coding | deleterious(0.01) | probably_damaging(0.999) | TCGA-DS-A1OB-01 | Cervix | cervical & endocervical cancer | Female | <65 | I/II | Chemotherapy | carboplatin | PD |
| DEGS2 | SNV | Missense_Mutation | c.437N>G | p.Thr146Arg | p.T146R | Q6QHC5 | protein_coding | deleterious(0.02) | probably_damaging(0.999) | TCGA-AA-3655-01 | Colorectum | colon adenocarcinoma | Male | >=65 | I/II | Unknown | Unknown | SD | |
| DEGS2 | SNV | Missense_Mutation | c.125N>A | p.Arg42His | p.R42H | Q6QHC5 | protein_coding | tolerated(0.77) | benign(0) | TCGA-AD-6889-01 | Colorectum | colon adenocarcinoma | Male | >=65 | I/II | Chemotherapy | xeloda | PD | |
| DEGS2 | SNV | Missense_Mutation | rs765100971 | c.677C>T | p.Ser226Leu | p.S226L | Q6QHC5 | protein_coding | deleterious(0) | possibly_damaging(0.68) | TCGA-AZ-6601-01 | Colorectum | colon adenocarcinoma | Male | >=65 | I/II | Unknown | Unknown | PD |
| DEGS2 | SNV | Missense_Mutation | c.790N>A | p.Asp264Asn | p.D264N | Q6QHC5 | protein_coding | deleterious(0) | probably_damaging(0.999) | TCGA-AP-A0LM-01 | Endometrium | uterine corpus endometrioid carcinoma | Female | <65 | III/IV | Chemotherapy | cisplatin | SD | |
| DEGS2 | SNV | Missense_Mutation | c.844N>A | p.Glu282Lys | p.E282K | Q6QHC5 | protein_coding | deleterious(0) | probably_damaging(0.996) | TCGA-BS-A0UV-01 | Endometrium | uterine corpus endometrioid carcinoma | Female | <65 | III/IV | Unknown | Unknown | SD | |
| DEGS2 | SNV | Missense_Mutation | rs148474864 | c.113G>A | p.Arg38Gln | p.R38Q | Q6QHC5 | protein_coding | deleterious(0.02) | possibly_damaging(0.585) | TCGA-D1-A15X-01 | Endometrium | uterine corpus endometrioid carcinoma | Female | <65 | I/II | Unknown | Unknown | SD |
| Page: 1 2 3 |
Top |
Related drugs of malignant transformation related genes |
| Identification of chemicals and drugs interact with genes involved in malignant transfromation |
| (DGIdb 4.0) |
| Entrez ID | Symbol | Category | Interaction Types | Drug Claim Name | Drug Name | PMIDs |
| Page: 1 |

Copyright 2023-Present -The University of Texas Health Science Center at Houston |