
|
|||||
|
 | |
| |
| |
| |
| |
| |
|
Gene: DEFA5 |
Gene summary for DEFA5 |
| Gene information | Species | Human | Gene symbol | DEFA5 | Gene ID | 1670 |
| Gene name | defensin alpha 5 | |
| Gene Alias | DEF5 | |
| Cytomap | 8p23.1 | |
| Gene Type | protein-coding | GO ID | GO:0001906 | UniProtAcc | Q01523 |
Top |
Malignant transformation analysis |
| Identification of the aberrant gene expression in precancerous and cancerous lesions by comparing the gene expression of stem-like cells in diseased tissues with normal stem cells |
| Entrez ID | Symbol | Replicates | Species | Organ | Tissue | Adj P-value | Log2FC | Malignancy |
| 1670 | DEFA5 | HTA11_2951_2000001011 | Human | Colorectum | AD | 9.20e-14 | 6.74e-01 | 0.0216 |
| 1670 | DEFA5 | HTA11_3361_2000001011 | Human | Colorectum | AD | 5.46e-22 | 6.56e-01 | -0.1207 |
| 1670 | DEFA5 | HTA11_696_2000001011 | Human | Colorectum | AD | 5.40e-44 | 9.46e-01 | -0.1464 |
| 1670 | DEFA5 | HTA11_866_2000001011 | Human | Colorectum | AD | 4.46e-07 | 8.01e-01 | -0.1001 |
| 1670 | DEFA5 | HTA11_1391_2000001011 | Human | Colorectum | AD | 2.25e-23 | 2.35e+00 | -0.059 |
| 1670 | DEFA5 | HTA11_546_2000001011 | Human | Colorectum | AD | 1.50e-17 | 1.47e+00 | -0.0842 |
| 1670 | DEFA5 | HTA11_10711_2000001011 | Human | Colorectum | AD | 2.62e-06 | 5.37e-01 | 0.0338 |
| 1670 | DEFA5 | HTA11_7696_3000711011 | Human | Colorectum | AD | 4.07e-04 | 1.63e-01 | 0.0674 |
| 1670 | DEFA5 | HTA11_99999970781_79442 | Human | Colorectum | MSS | 4.46e-07 | 1.83e-01 | 0.294 |
| 1670 | DEFA5 | A002-C-010 | Human | Colorectum | FAP | 3.19e-14 | 4.08e-01 | 0.242 |
| 1670 | DEFA5 | A015-C-204 | Human | Colorectum | FAP | 4.72e-03 | 2.84e-01 | -0.0228 |
| 1670 | DEFA5 | A002-C-201 | Human | Colorectum | FAP | 6.35e-15 | 6.06e-01 | 0.0324 |
| 1670 | DEFA5 | A001-C-007 | Human | Colorectum | CRC | 3.26e-04 | 3.28e-01 | 0.1899 |
| 1670 | DEFA5 | F072B | Human | Colorectum | FAP | 2.10e-17 | 5.86e-01 | 0.257 |
| 1670 | DEFA5 | S014 | Human | Liver | HCC | 8.85e-74 | 9.99e+00 | 0.2254 |
| 1670 | DEFA5 | S015 | Human | Liver | HCC | 1.99e-43 | 8.89e+00 | 0.2375 |
| 1670 | DEFA5 | S016 | Human | Liver | HCC | 1.08e-128 | 1.07e+01 | 0.2243 |
| Page: 1 |
| Tissue | Expression Dynamics | Abbreviation |
| Colorectum (GSE201348) | 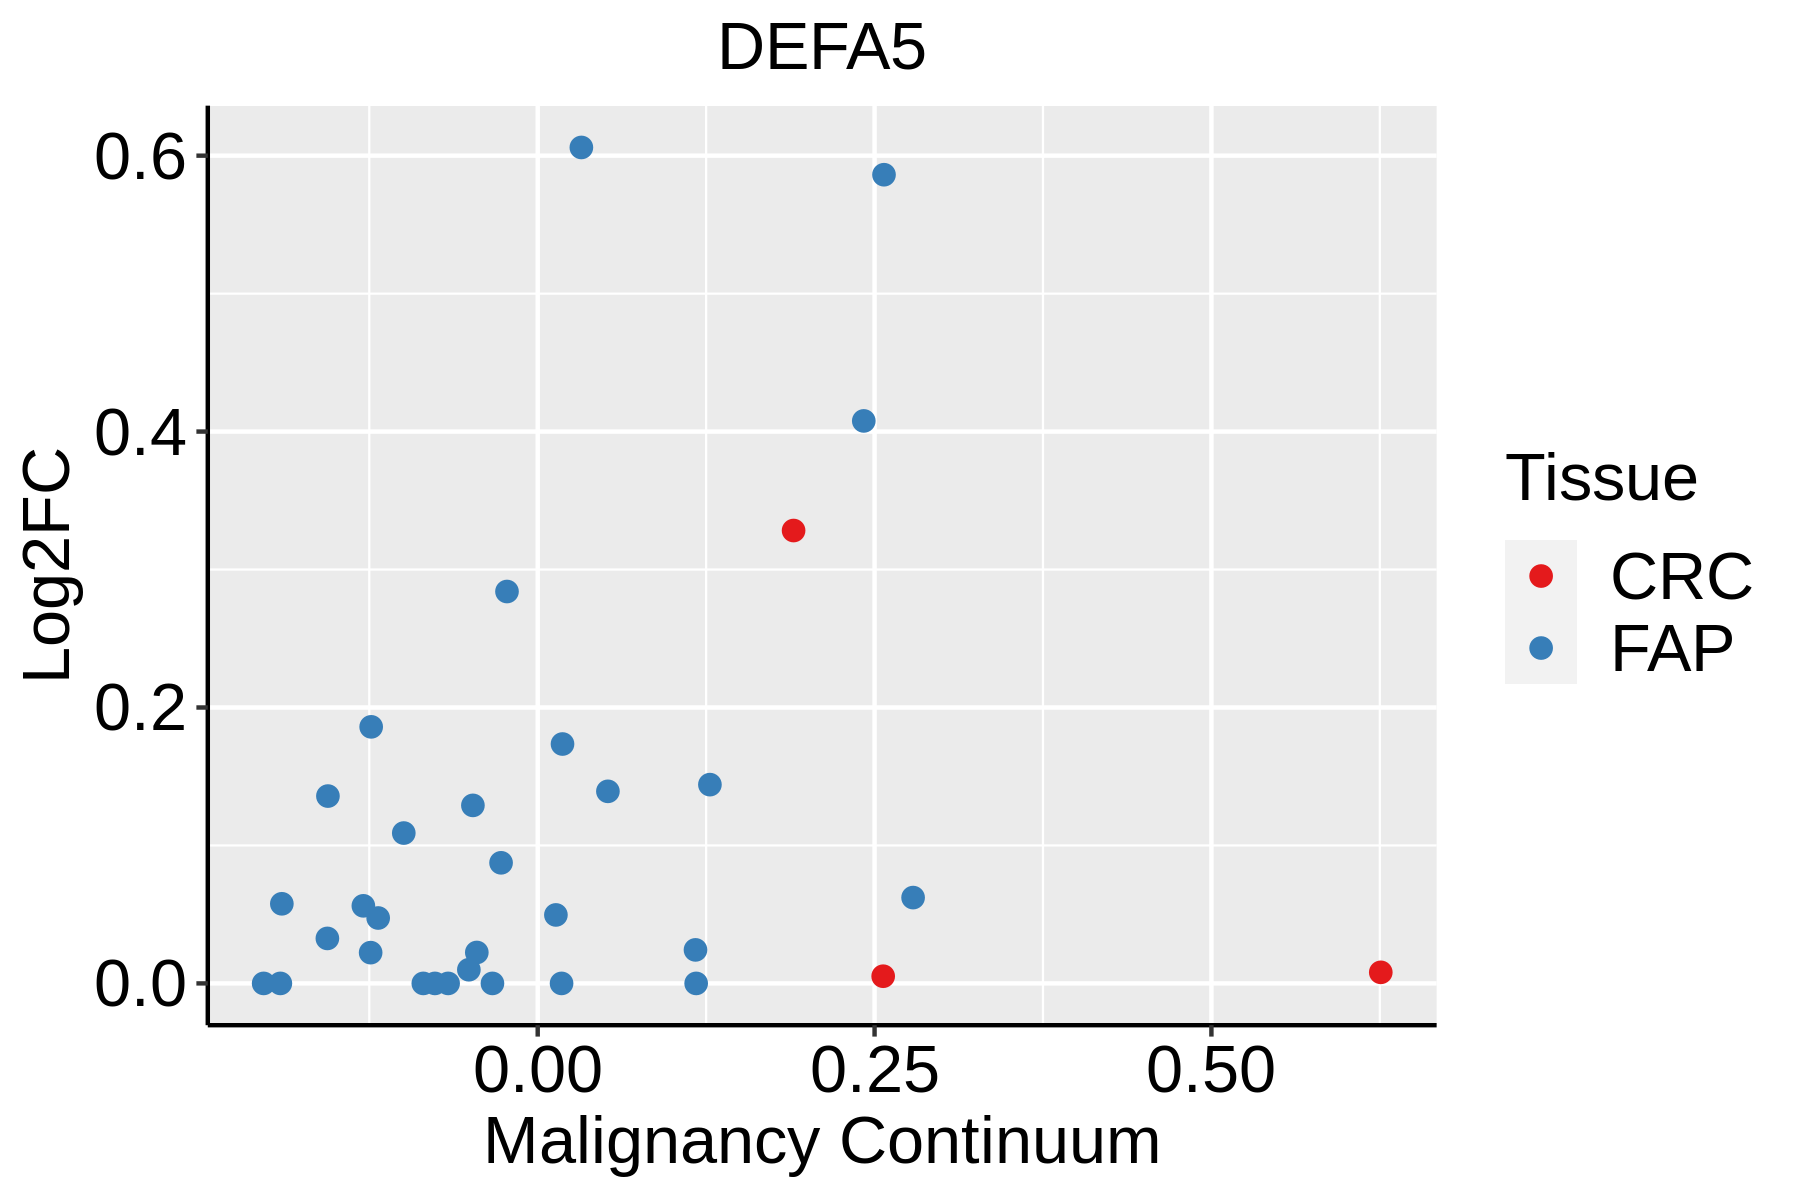 | FAP: Familial adenomatous polyposis |
| CRC: Colorectal cancer | ||
| Colorectum (HTA11) |  | AD: Adenomas |
| SER: Sessile serrated lesions | ||
| MSI-H: Microsatellite-high colorectal cancer | ||
| MSS: Microsatellite stable colorectal cancer | ||
| Liver | 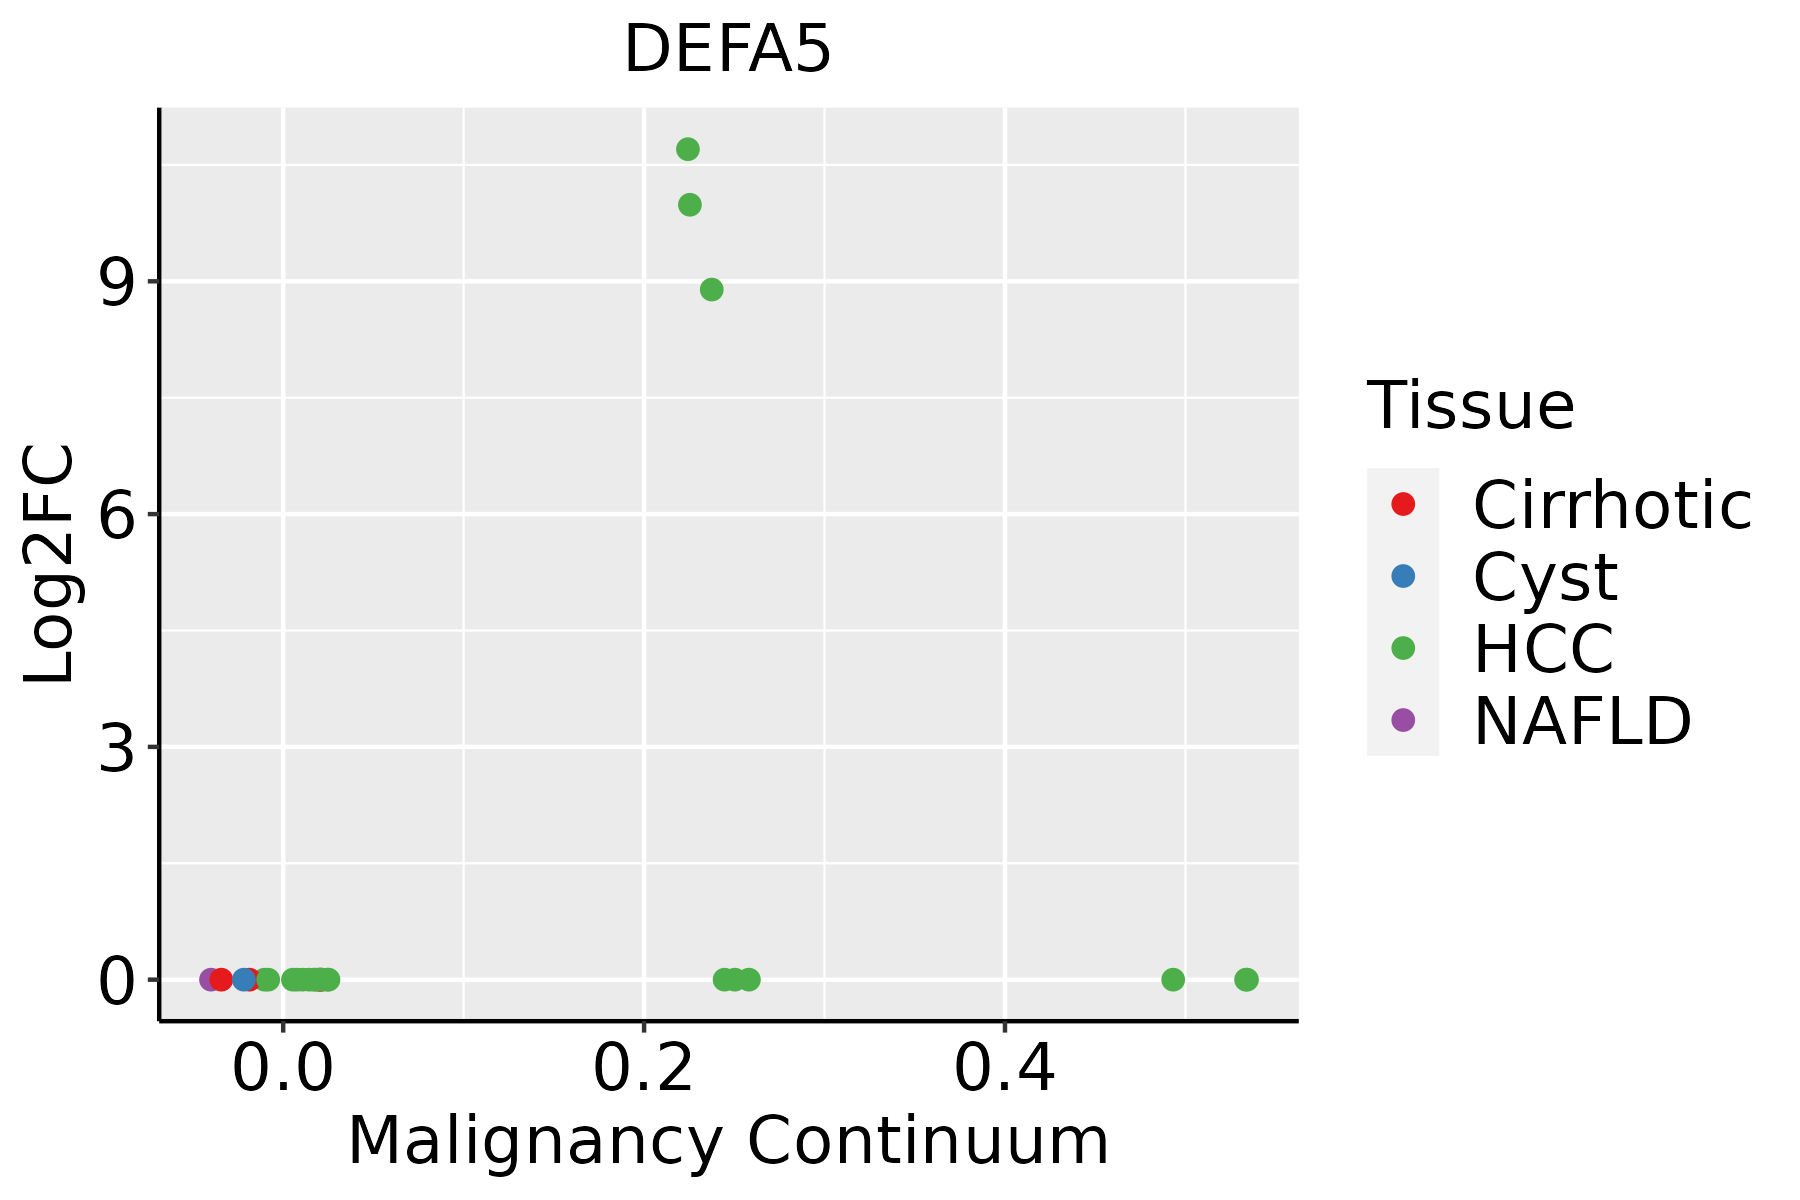 | HCC: Hepatocellular carcinoma |
| NAFLD: Non-alcoholic fatty liver disease |
| ∗log2FC in expression of this searched gene in stem-like cells from each diseased tissue sample relative to stem-like cells in normal samples in each tissue plotted against the malignancy continuum. Samples are colored based on if they are from different disease stage. |
Top |
Malignant transformation related pathway analysis |
| Find out the enriched GO biological processes and KEGG pathways involved in transition from healthy to precancer to cancer |
| Tissue | Disease Stage | Enriched GO biological Processes |
| Colorectum | AD |  |
| Colorectum | SER |  |
| Colorectum | MSS |  |
| Colorectum | MSI-H |  |
| Colorectum | FAP |  |
| ∗Top 15 enriched GO BP terms are showed in the bar plot of each disease state in each tissue. Each row represents a significant GO biological process which is colored according to the -log10(p.adjust). |
| Page: 1 2 3 4 5 6 7 8 9 |
| GO ID | Tissue | Disease Stage | Description | Gene Ratio | Bg Ratio | pvalue | p.adjust | Count |
| GO:0044403 | Colorectum | AD | biological process involved in symbiotic interaction | 99/3918 | 290/18723 | 1.02e-07 | 4.93e-06 | 99 |
| GO:0090559 | Colorectum | AD | regulation of membrane permeability | 31/3918 | 78/18723 | 1.16e-04 | 1.72e-03 | 31 |
| GO:0035821 | Colorectum | AD | modulation of process of other organism | 34/3918 | 106/18723 | 4.73e-03 | 3.22e-02 | 34 |
| GO:00444032 | Colorectum | MSS | biological process involved in symbiotic interaction | 93/3467 | 290/18723 | 1.72e-08 | 9.85e-07 | 93 |
| GO:00905592 | Colorectum | MSS | regulation of membrane permeability | 27/3467 | 78/18723 | 5.31e-04 | 5.99e-03 | 27 |
| GO:00358211 | Colorectum | MSS | modulation of process of other organism | 33/3467 | 106/18723 | 1.18e-03 | 1.14e-02 | 33 |
| GO:00444034 | Colorectum | FAP | biological process involved in symbiotic interaction | 66/2622 | 290/18723 | 3.47e-05 | 7.64e-04 | 66 |
| GO:00444035 | Colorectum | CRC | biological process involved in symbiotic interaction | 55/2078 | 290/18723 | 4.82e-05 | 1.12e-03 | 55 |
| GO:004440322 | Liver | HCC | biological process involved in symbiotic interaction | 183/7958 | 290/18723 | 9.13e-13 | 4.59e-11 | 183 |
| GO:003582111 | Liver | HCC | modulation of process of other organism | 67/7958 | 106/18723 | 1.34e-05 | 1.48e-04 | 67 |
| GO:00517022 | Liver | HCC | biological process involved in interaction with symbiont | 60/7958 | 94/18723 | 2.41e-05 | 2.54e-04 | 60 |
| GO:009055912 | Liver | HCC | regulation of membrane permeability | 47/7958 | 78/18723 | 1.17e-03 | 6.54e-03 | 47 |
| GO:003249611 | Liver | HCC | response to lipopolysaccharide | 174/7958 | 343/18723 | 1.19e-03 | 6.62e-03 | 174 |
| GO:00712166 | Liver | HCC | cellular response to biotic stimulus | 128/7958 | 246/18723 | 1.53e-03 | 8.10e-03 | 128 |
| GO:00712226 | Liver | HCC | cellular response to lipopolysaccharide | 110/7958 | 209/18723 | 1.92e-03 | 9.77e-03 | 110 |
| GO:000223711 | Liver | HCC | response to molecule of bacterial origin | 181/7958 | 363/18723 | 2.58e-03 | 1.24e-02 | 181 |
| GO:190571011 | Liver | HCC | positive regulation of membrane permeability | 30/7958 | 48/18723 | 4.10e-03 | 1.78e-02 | 30 |
| GO:00712196 | Liver | HCC | cellular response to molecule of bacterial origin | 113/7958 | 221/18723 | 5.73e-03 | 2.38e-02 | 113 |
| Page: 1 |
| Pathway ID | Tissue | Disease Stage | Description | Gene Ratio | Bg Ratio | pvalue | p.adjust | qvalue | Count |
| hsa05202 | Colorectum | FAP | Transcriptional misregulation in cancer | 45/1404 | 193/8465 | 9.19e-03 | 3.33e-02 | 2.03e-02 | 45 |
| hsa052021 | Colorectum | FAP | Transcriptional misregulation in cancer | 45/1404 | 193/8465 | 9.19e-03 | 3.33e-02 | 2.03e-02 | 45 |
| Page: 1 |
Top |
Cell-cell communication analysis |
| Identification of potential cell-cell interactions between two cell types and their ligand-receptor pairs for different disease states |
| Ligand | Receptor | LRpair | Pathway | Tissue | Disease Stage |
| Page: 1 |
Top |
Single-cell gene regulatory network inference analysis |
| Find out the significant the regulons (TFs) and the target genes of each regulon across cell types for different disease states |
| TF | Cell Type | Tissue | Disease Stage | Target Gene | RSS | Regulon Activity |
| ∗The dot plots of a searched regulon are shown for all cell subpopulations in each disease state of each tissue based on the regulon specific score inferred using pySCENIC and by calculating the average expression. |
| Page: 1 |
Top |
Somatic mutation of malignant transformation related genes |
| Annotation of somatic variants for genes involved in malignant transformation |
| Hugo Symbol | Variant Class | Variant Classification | dbSNP RS | HGVSc | HGVSp | HGVSp Short | SWISSPROT | BIOTYPE | SIFT | PolyPhen | Tumor Sample Barcode | Tissue | Histology | Sex | Age | Stage | Therapy Types | Drugs | Outcome |
| DEFA5 | SNV | Missense_Mutation | rs137962701 | c.211C>T | p.Arg71Cys | p.R71C | Q01523 | protein_coding | tolerated(0.18) | benign(0) | TCGA-A6-6781-01 | Colorectum | colon adenocarcinoma | Male | <65 | III/IV | Chemotherapy | oxaliplatin | SD |
| DEFA5 | SNV | Missense_Mutation | rs758909444 | c.203N>A | p.Arg68Gln | p.R68Q | Q01523 | protein_coding | deleterious(0.01) | benign(0.141) | TCGA-E6-A1LX-01 | Endometrium | uterine corpus endometrioid carcinoma | Female | <65 | I/II | Unknown | Unknown | SD |
| DEFA5 | SNV | Missense_Mutation | novel | c.205N>C | p.Thr69Pro | p.T69P | Q01523 | protein_coding | tolerated(0.11) | benign(0.035) | TCGA-62-8397-01 | Lung | lung adenocarcinoma | Female | >=65 | I/II | Unknown | Unknown | SD |
| DEFA5 | SNV | Missense_Mutation | c.102N>T | p.Gln34His | p.Q34H | Q01523 | protein_coding | deleterious(0) | probably_damaging(0.997) | TCGA-78-7161-01 | Lung | lung adenocarcinoma | Female | >=65 | I/II | Chemotherapy | cisplatin | PD | |
| DEFA5 | SNV | Missense_Mutation | rs769660501 | c.43N>A | p.Leu15Met | p.L15M | Q01523 | protein_coding | deleterious(0.01) | probably_damaging(0.999) | TCGA-HF-7132-01 | Stomach | stomach adenocarcinoma | Male | Unknown | I/II | Chemotherapy | fluorouracil | SD |
| Page: 1 |
Top |
Related drugs of malignant transformation related genes |
| Identification of chemicals and drugs interact with genes involved in malignant transfromation |
| (DGIdb 4.0) |
| Entrez ID | Symbol | Category | Interaction Types | Drug Claim Name | Drug Name | PMIDs |
| 1670 | DEFA5 | DRUGGABLE GENOME | SALT | VOLANESORSEN SODIUM | 9169780 |
| Page: 1 |

Copyright 2023-Present -The University of Texas Health Science Center at Houston |