Schematic overview of the cellular and molecular mechanisms involved in the cancer progression, including the proposed cellular and molecular mechanisms in cancer cells trajectory. AT1: alveolar type 1 cells; AT2: alveolar type 2 cells; AAH: atypical adenomatous hyperplasia; AIS: adenocarcinoma in situ; MIA: minimally invasive adenocarcinoma; IA: invasive adenocarcinoma; EMT: epithelial-mesenchymal transition

Home

Download

Statistics

Help

Contact

Center for Computational Systems Medicine
leaf

Gene summary

leaf

Malignant transformation analysis

leaf

Malignant transformation related pathway analysis

leaf

Cell-cell communication analysis

leaf

Single-cell gene regulatory network inference analysis

leaf

Somatic mutation of malignant transformation related genes

leaf

Related drugs of malignant transformation related genes

Gene: DEF8

Gene summary for DEF8

check button Gene summary.

Gene informationSpeciesHuman
Gene symbol

DEF8

Gene ID

54849

Gene namedifferentially expressed in FDCP 8 homolog
Gene AliasDEF8
Cytomap16q24.3
Gene Typeprotein-coding
GO ID

GO:0001894

UniProtAcc

Q6ZN54


Top

Malignant transformation analysis

check button Identification of the aberrant gene expression in precancerous and cancerous lesions by comparing the gene expression of stem-like cells in diseased tissues with normal stem cells
check button Malignant transformation involving gene list.
Entrez IDSymbolReplicatesSpeciesOrganTissueAdj P-valueLog2FCMalignancy
54849DEF8LZE4THumanEsophagusESCC2.56e-143.59e-010.0811
54849DEF8LZE7THumanEsophagusESCC1.74e-206.67e-010.0667
54849DEF8LZE8THumanEsophagusESCC3.61e-032.04e-010.067
54849DEF8LZE20THumanEsophagusESCC3.74e-066.00e-020.0662
54849DEF8LZE22D1HumanEsophagusHGIN3.88e-051.92e-010.0595
54849DEF8LZE22THumanEsophagusESCC9.16e-031.70e-010.068
54849DEF8LZE24THumanEsophagusESCC4.00e-212.16e-010.0596
54849DEF8LZE21THumanEsophagusESCC2.11e-053.47e-010.0655
54849DEF8LZE6THumanEsophagusESCC4.23e-031.22e-010.0845
54849DEF8P1T-EHumanEsophagusESCC1.45e-133.81e-010.0875
54849DEF8P2T-EHumanEsophagusESCC1.19e-223.88e-010.1177
54849DEF8P4T-EHumanEsophagusESCC1.37e-236.00e-010.1323
54849DEF8P5T-EHumanEsophagusESCC1.09e-224.61e-010.1327
54849DEF8P8T-EHumanEsophagusESCC3.21e-193.86e-010.0889
54849DEF8P9T-EHumanEsophagusESCC1.74e-142.56e-010.1131
54849DEF8P10T-EHumanEsophagusESCC1.06e-172.28e-010.116
54849DEF8P11T-EHumanEsophagusESCC2.08e-154.80e-010.1426
54849DEF8P12T-EHumanEsophagusESCC1.85e-193.48e-010.1122
54849DEF8P15T-EHumanEsophagusESCC8.65e-192.99e-010.1149
54849DEF8P16T-EHumanEsophagusESCC9.42e-101.44e-010.1153
Page: 1 2 3 4 5 6 

check button Transcriptomic changes along malignancy continuum.
TissueExpression DynamicsAbbreviation
EsophagusThe image shows the transcriptomic changes along malignancy continuum.log2FC in expression of this searched gene in stem-like cells from each diseased tissue sample relative to stem-like cells in normal samples in each tissue plotted against the malignancy continuum. Samples are colored based on if they are from different disease stage.
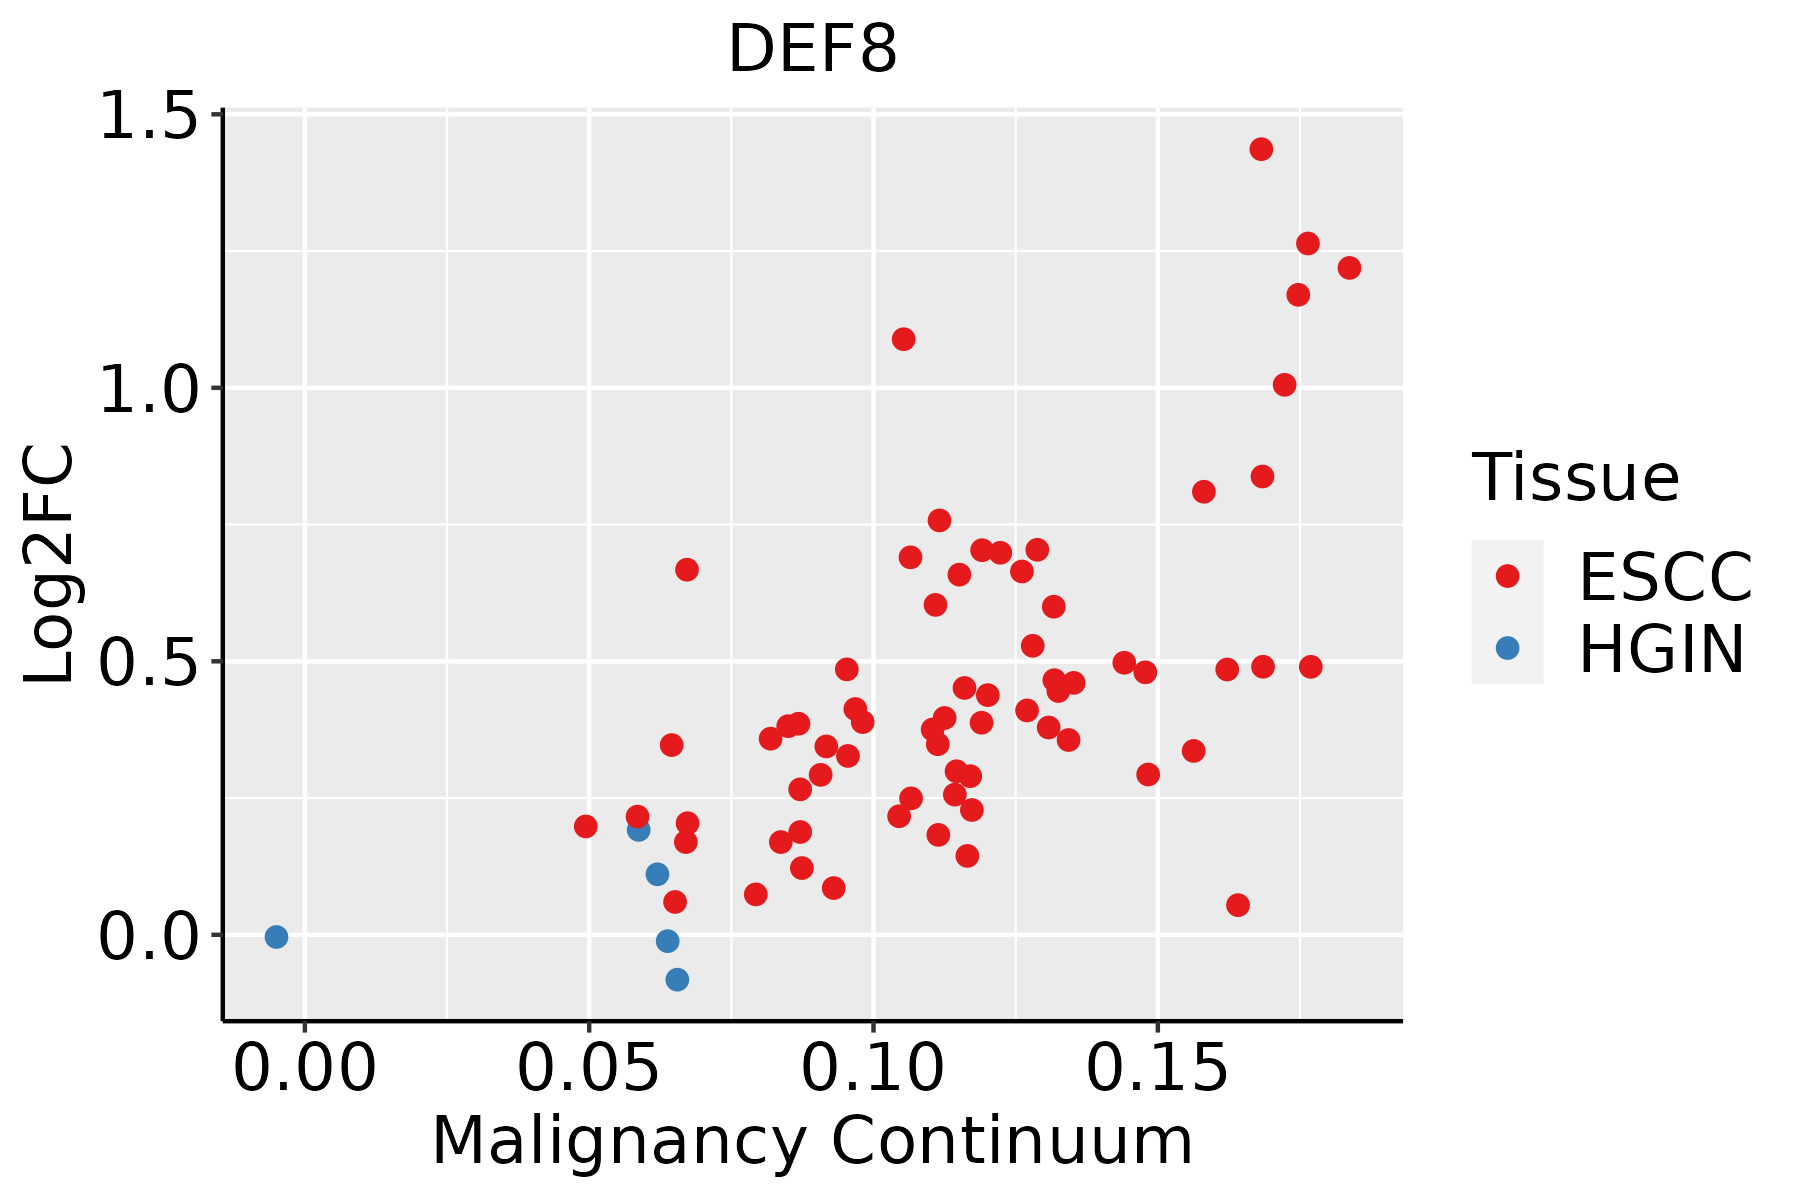
ESCC: Esophageal squamous cell carcinoma
HGIN: High-grade intraepithelial neoplasias
LGIN: Low-grade intraepithelial neoplasias
LiverThe image shows the transcriptomic changes along malignancy continuum.log2FC in expression of this searched gene in stem-like cells from each diseased tissue sample relative to stem-like cells in normal samples in each tissue plotted against the malignancy continuum. Samples are colored based on if they are from different disease stage.
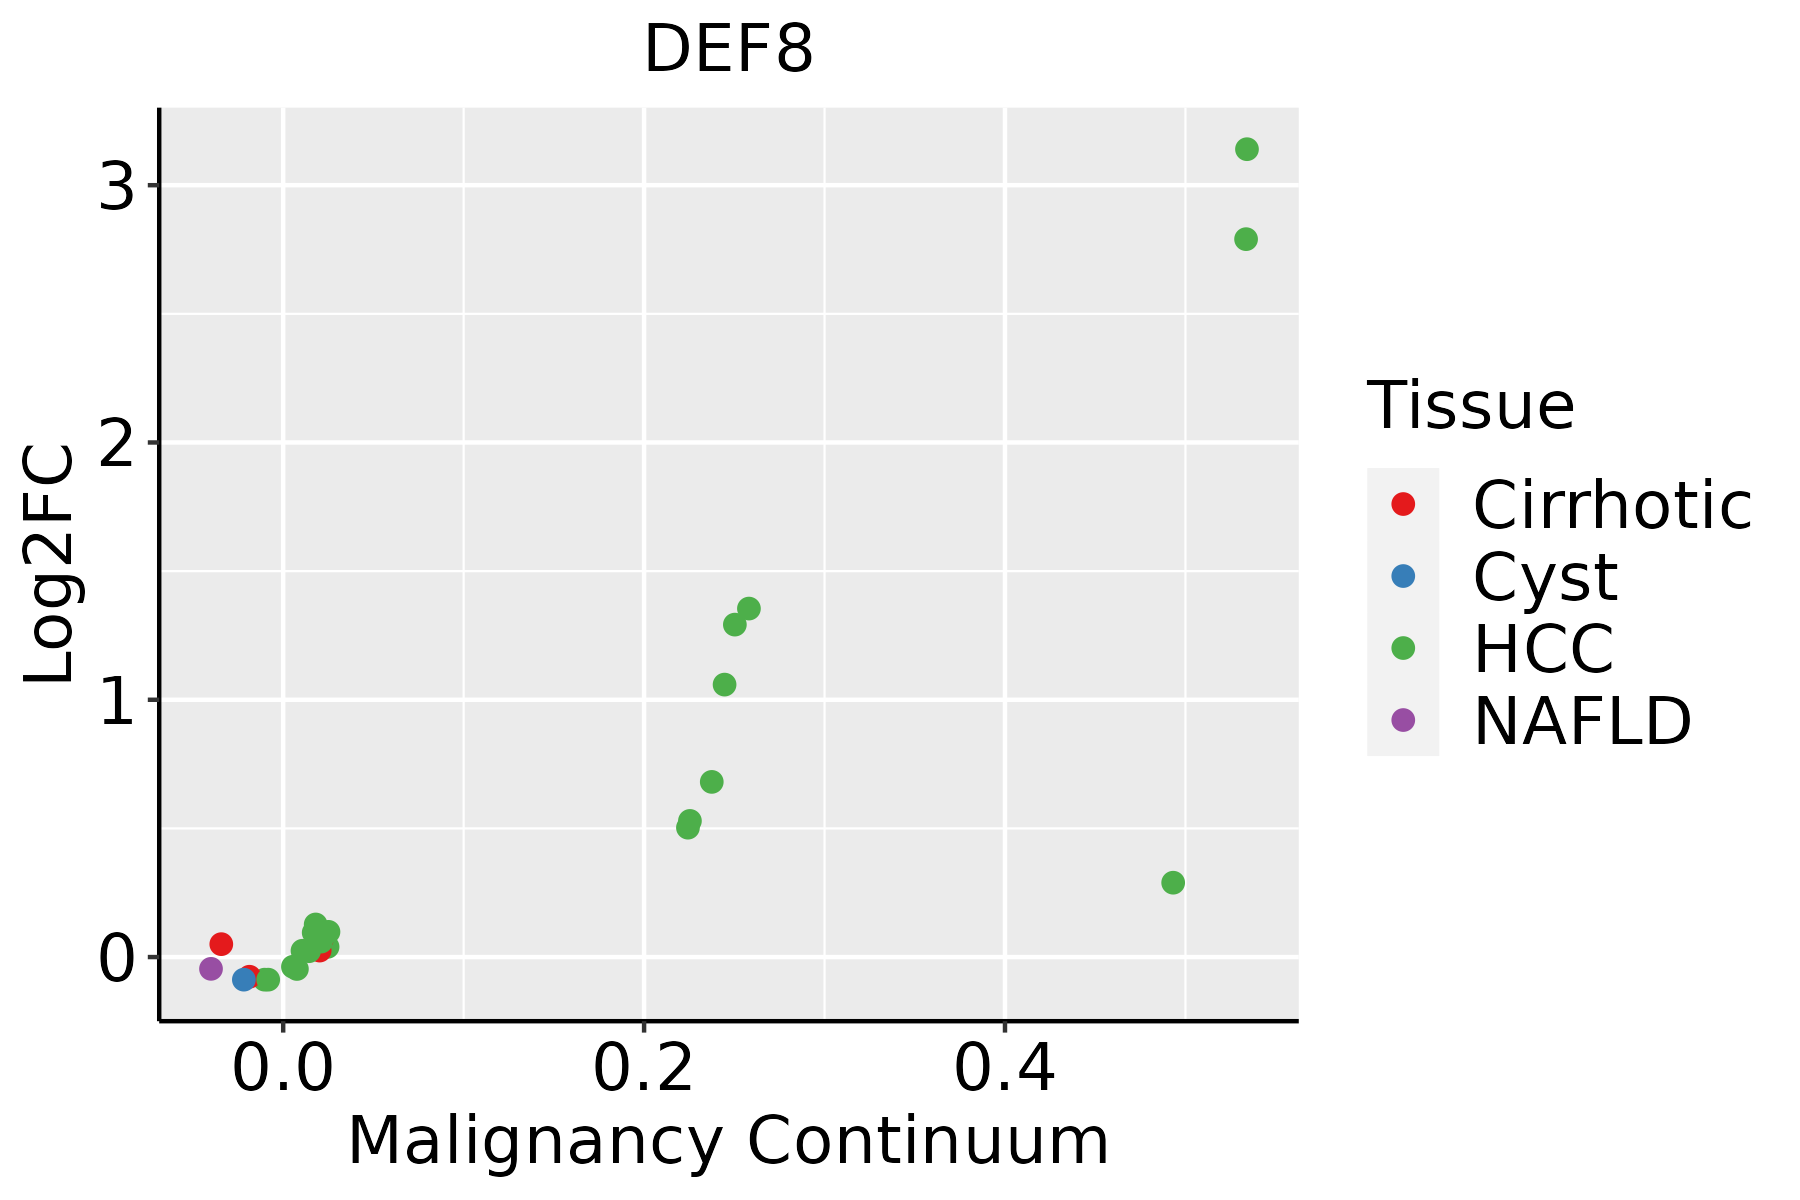
HCC: Hepatocellular carcinoma
NAFLD: Non-alcoholic fatty liver disease
Oral CavityThe image shows the transcriptomic changes along malignancy continuum.log2FC in expression of this searched gene in stem-like cells from each diseased tissue sample relative to stem-like cells in normal samples in each tissue plotted against the malignancy continuum. Samples are colored based on if they are from different disease stage.
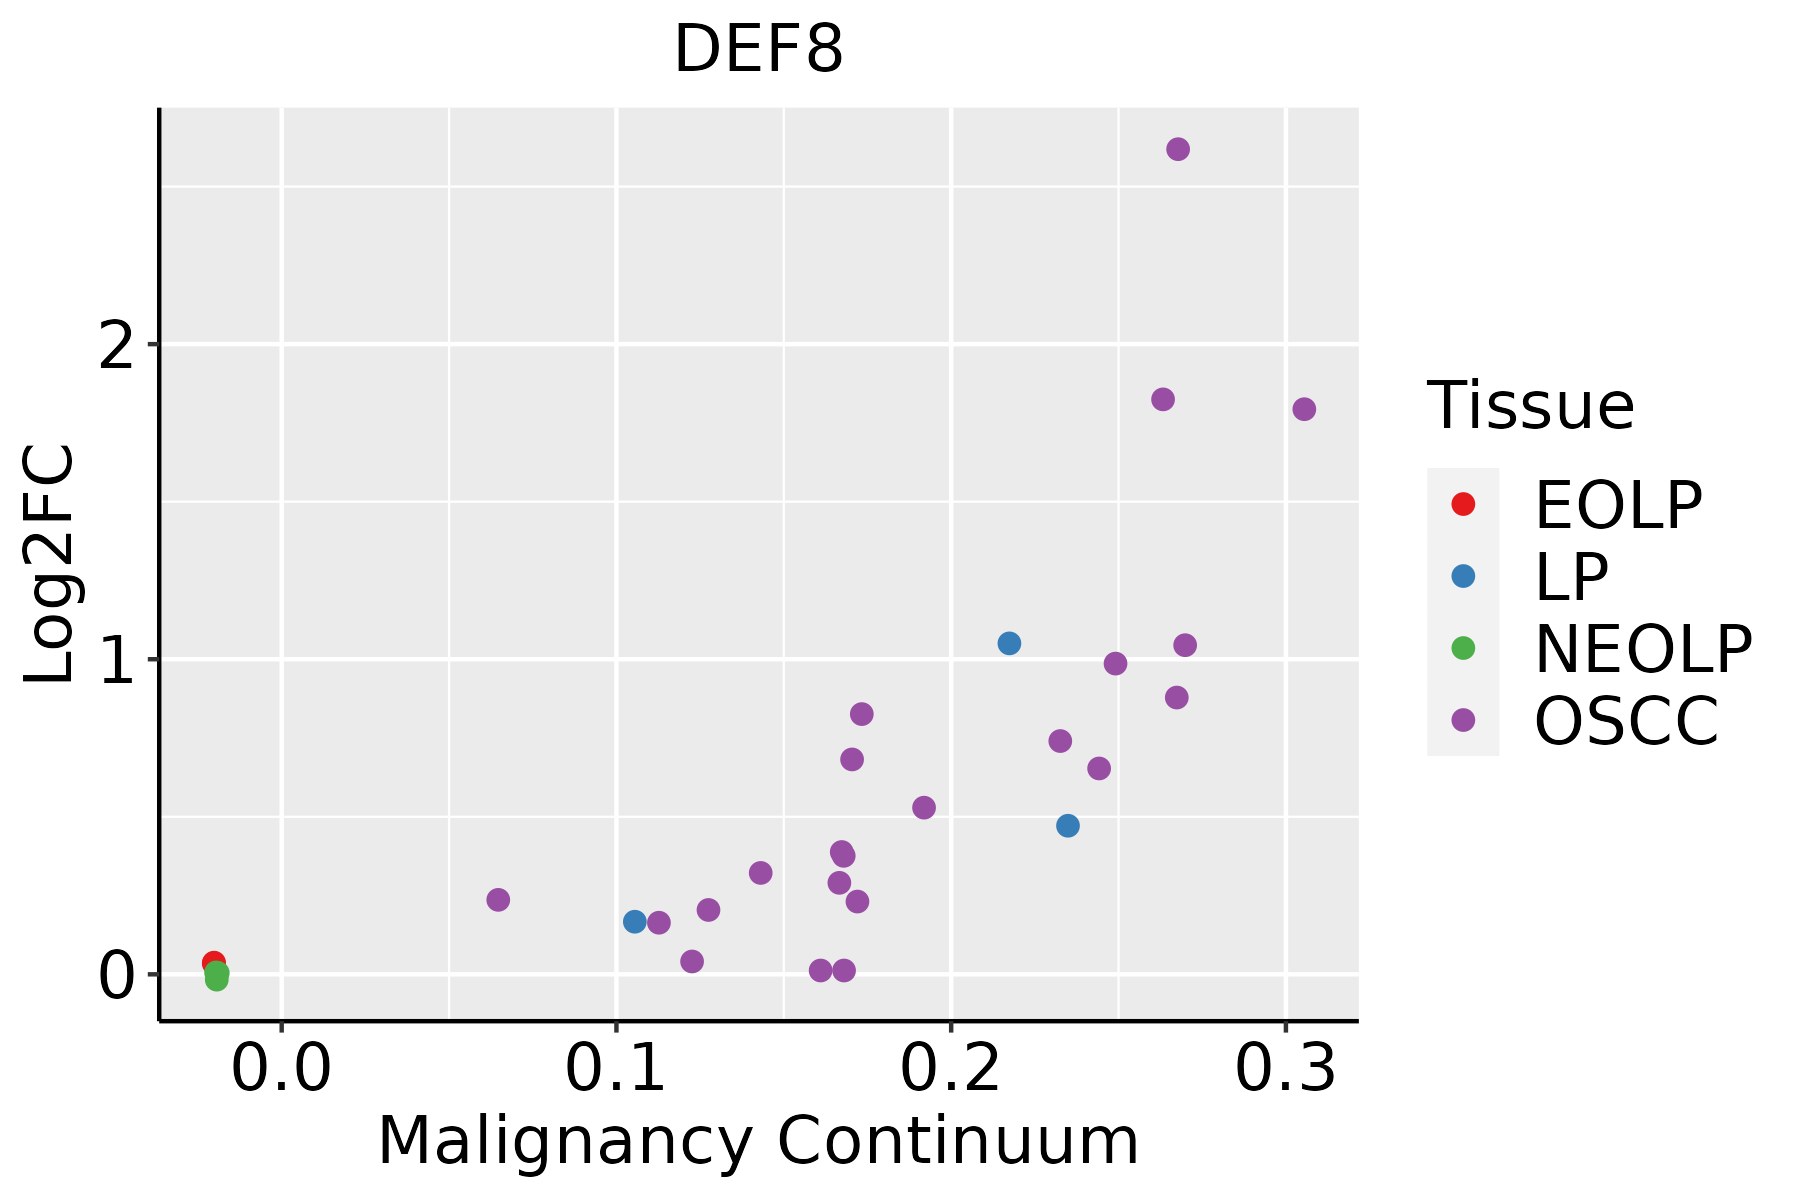
EOLP: Erosive Oral lichen planus
LP: leukoplakia
NEOLP: Non-erosive oral lichen planus
OSCC: Oral squamous cell carcinoma
SkinThe image shows the transcriptomic changes along malignancy continuum.log2FC in expression of this searched gene in stem-like cells from each diseased tissue sample relative to stem-like cells in normal samples in each tissue plotted against the malignancy continuum. Samples are colored based on if they are from different disease stage.
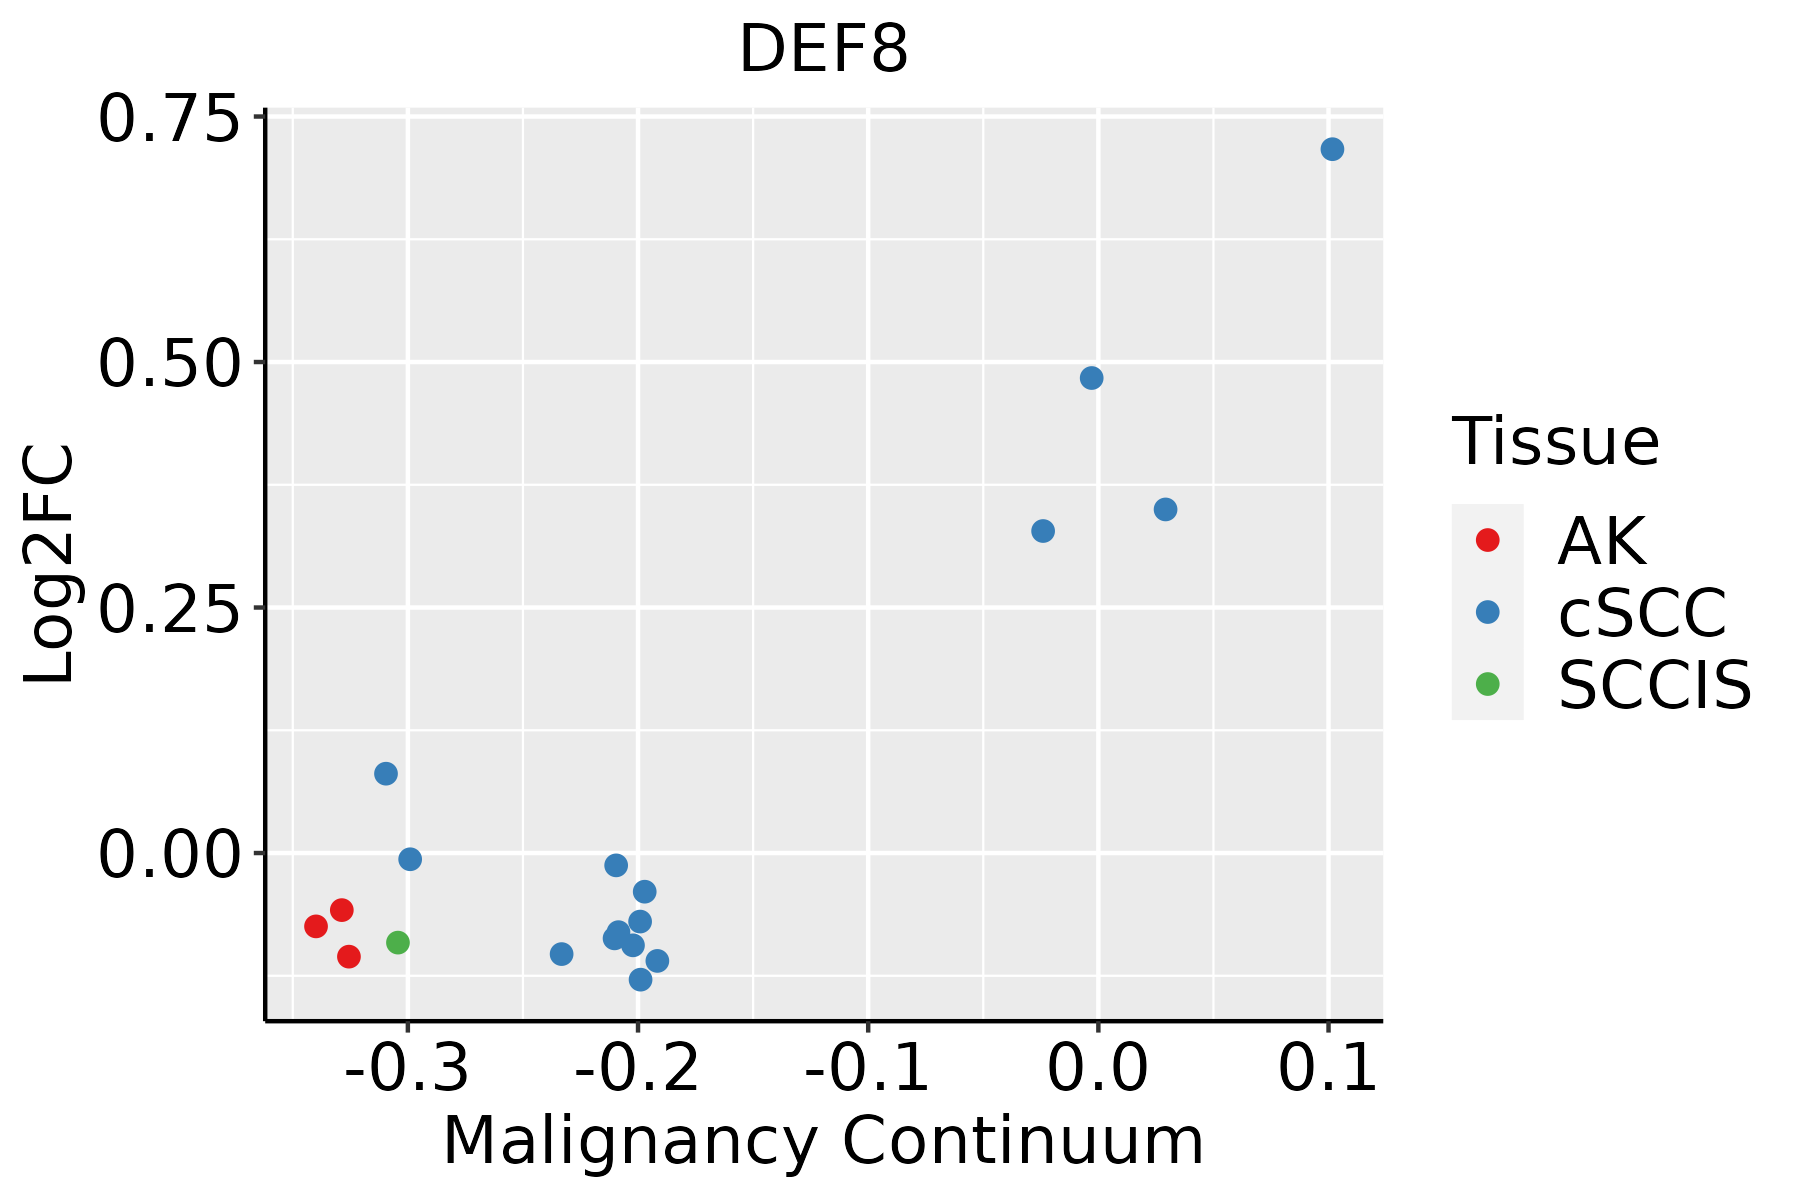
AK: Actinic keratosis
cSCC: Cutaneous squamous cell carcinoma
SCCIS:squamous cell carcinoma in situ
ThyroidThe image shows the transcriptomic changes along malignancy continuum.log2FC in expression of this searched gene in stem-like cells from each diseased tissue sample relative to stem-like cells in normal samples in each tissue plotted against the malignancy continuum. Samples are colored based on if they are from different disease stage.ATC: Anaplastic thyroid cancer
HT: Hashimoto's thyroiditis
PTC: Papillary thyroid cancer
∗log2FC in expression of this searched gene in stem-like cells from each diseased tissue sample relative to stem-like cells in normal samples in each tissue plotted against the malignancy continuum. Samples are colored based on if they are from different disease stage.

Top

Malignant transformation related pathway analysis

check buttonFind out the enriched GO biological processes and KEGG pathways involved in transition from healthy to precancer to cancer
check button Figure of enriched GO biological processes.
TissueDisease StageEnriched GO biological Processes
ColorectumADGO analysis - Figure of enriched GO biological processes: Top 15 enriched GO BP terms are showed in the bar plot of each disease state in each tissue. Each row represents a significant GO biological process which is colored according to the -log10(p.adjust).
ColorectumSERGO analysis - Figure of enriched GO biological processes: Top 15 enriched GO BP terms are showed in the bar plot of each disease state in each tissue. Each row represents a significant GO biological process which is colored according to the -log10(p.adjust).
ColorectumMSSGO analysis - Figure of enriched GO biological processes: Top 15 enriched GO BP terms are showed in the bar plot of each disease state in each tissue. Each row represents a significant GO biological process which is colored according to the -log10(p.adjust).
ColorectumMSI-HGO analysis - Figure of enriched GO biological processes: Top 15 enriched GO BP terms are showed in the bar plot of each disease state in each tissue. Each row represents a significant GO biological process which is colored according to the -log10(p.adjust).
ColorectumFAPGO analysis - Figure of enriched GO biological processes: Top 15 enriched GO BP terms are showed in the bar plot of each disease state in each tissue. Each row represents a significant GO biological process which is colored according to the -log10(p.adjust).
∗Top 15 enriched GO BP terms are showed in the bar plot of each disease state in each tissue. Each row represents a significant GO biological process which is colored according to the -log10(p.adjust).
Page: 1 2 3 4 5 6 7 8 9 

check button Enriched GO biological processes.
GO IDTissueDisease StageDescriptionGene RatioBg Ratiopvaluep.adjustCount
GO:006049117EsophagusHGINregulation of cell projection assembly39/2587188/187235.61e-034.57e-0239
GO:003134616EsophagusESCCpositive regulation of cell projection organization201/8552353/187231.19e-051.11e-04201
GO:00315299EsophagusESCCruffle organization39/855256/187232.44e-041.51e-0339
GO:00971789EsophagusESCCruffle assembly32/855244/187232.50e-041.54e-0332
GO:006049118EsophagusESCCregulation of cell projection assembly110/8552188/187232.60e-041.58e-03110
GO:012003218EsophagusESCCregulation of plasma membrane bounded cell projection assembly108/8552186/187234.37e-042.46e-03108
GO:01200347EsophagusESCCpositive regulation of plasma membrane bounded cell projection assembly64/8552105/187231.15e-035.70e-0364
GO:19000277EsophagusESCCregulation of ruffle assembly21/855231/187231.10e-023.70e-0221
GO:00315294LiverCirrhoticruffle organization26/463456/187233.40e-042.91e-0326
GO:00971783LiverCirrhoticruffle assembly21/463444/187237.88e-045.79e-0321
GO:00487711LiverCirrhotictissue remodeling60/4634175/187232.86e-031.65e-0260
GO:01200326LiverCirrhoticregulation of plasma membrane bounded cell projection assembly63/4634186/187233.16e-031.78e-0263
GO:19000273LiverCirrhoticregulation of ruffle assembly15/463431/187233.68e-032.02e-0215
GO:00604915LiverCirrhoticregulation of cell projection assembly63/4634188/187234.17e-032.22e-0263
GO:003134611LiverHCCpositive regulation of cell projection organization193/7958353/187232.28e-063.08e-05193
GO:006049112LiverHCCregulation of cell projection assembly101/7958188/187231.20e-036.69e-03101
GO:012003212LiverHCCregulation of plasma membrane bounded cell projection assembly100/7958186/187231.23e-036.81e-03100
GO:003152911LiverHCCruffle organization34/795856/187234.54e-031.96e-0234
GO:01200344LiverHCCpositive regulation of plasma membrane bounded cell projection assembly58/7958105/187235.66e-032.36e-0258
GO:003134610Oral cavityOSCCpositive regulation of cell projection organization176/7305353/187231.94e-051.87e-04176
Page: 1 2 3 

check button Enriched KEGG pathways.
Pathway IDTissueDisease StageDescriptionGene RatioBg Ratiopvaluep.adjustqvalueCount
Page: 1 

Top

Cell-cell communication analysis

check buttonIdentification of potential cell-cell interactions between two cell types and their ligand-receptor pairs for different disease states
LigandReceptorLRpairPathwayTissueDisease Stage
Page: 1 

Top

Single-cell gene regulatory network inference analysis

check buttonFind out the significant the regulons (TFs) and the target genes of each regulon across cell types for different disease states
TFCell TypeTissueDisease StageTarget GeneRSSRegulon Activity
∗The dot plots of a searched regulon are shown for all cell subpopulations in each disease state of each tissue based on the regulon specific score inferred using pySCENIC and by calculating the average expression.
Page: 1 

Top

Somatic mutation of malignant transformation related genes

check buttonAnnotation of somatic variants for genes involved in malignant transformation
Hugo SymbolVariant ClassVariant ClassificationdbSNP RSHGVScHGVSpHGVSp ShortSWISSPROTBIOTYPESIFTPolyPhenTumor Sample BarcodeTissueHistologySexAgeStageTherapy TypesDrugsOutcome
DEF8SNVMissense_Mutationnovelc.836N>Tp.Ala279Valp.A279VQ6ZN54protein_codingdeleterious(0.01)benign(0.209)TCGA-A7-A0CJ-01Breastbreast invasive carcinomaFemale<65I/IIChemotherapycytoxanSD
DEF8SNVMissense_Mutationnovelc.1364G>Ap.Arg455Lysp.R455KQ6ZN54protein_codingtolerated(1)benign(0.005)TCGA-GM-A3XL-01Breastbreast invasive carcinomaFemale<65I/IIChemotherapyfluorouracilCR
DEF8SNVMissense_Mutationnovelc.164N>Tp.Arg55Leup.R55LQ6ZN54protein_codingdeleterious_low_confidence(0.02)benign(0)TCGA-LL-A7SZ-01Breastbreast invasive carcinomaFemale<65I/IIChemotherapyadriamycinCR
DEF8SNVMissense_Mutationrs146004686c.602G>Ap.Arg201Hisp.R201HQ6ZN54protein_codingtolerated(0.68)probably_damaging(0.974)TCGA-2W-A8YY-01Cervixcervical & endocervical cancerFemale<65I/IIChemotherapycisplatinCR
DEF8SNVMissense_Mutationnovelc.1200G>Tp.Gln400Hisp.Q400HQ6ZN54protein_codingdeleterious(0.04)probably_damaging(0.995)TCGA-2W-A8YY-01Cervixcervical & endocervical cancerFemale<65I/IIChemotherapycisplatinCR
DEF8SNVMissense_Mutationc.636G>Cp.Gln212Hisp.Q212HQ6ZN54protein_codingtolerated(0.24)benign(0.015)TCGA-DR-A0ZM-01Cervixcervical & endocervical cancerFemale<65III/IVUnspecificCisplatinSD
DEF8SNVMissense_Mutationnovelc.196N>Ap.Glu66Lysp.E66KQ6ZN54protein_codingdeleterious_low_confidence(0.01)benign(0.214)TCGA-HM-A4S6-01Cervixcervical & endocervical cancerFemale<65III/IVChemotherapycisplatinCR
DEF8SNVMissense_Mutationnovelc.103C>Tp.Leu35Phep.L35FQ6ZN54protein_codingdeleterious_low_confidence(0.05)benign(0)TCGA-VS-A9UB-01Cervixcervical & endocervical cancerFemale<65I/IIChemotherapycisplatinCR
DEF8SNVMissense_Mutationc.65N>Tp.Thr22Metp.T22MQ6ZN54protein_codingdeleterious_low_confidence(0)benign(0)TCGA-AA-3495-01Colorectumcolon adenocarcinomaMale>=65I/IIUnknownUnknownSD
DEF8SNVMissense_Mutationnovelc.1436N>Ap.Arg479Lysp.R479KQ6ZN54protein_codingtolerated(0.14)benign(0.194)TCGA-AA-3949-01Colorectumcolon adenocarcinomaFemale>=65III/IVUnknownUnknownSD
Page: 1 2 3 4 5 

Top

Related drugs of malignant transformation related genes

check buttonIdentification of chemicals and drugs interact with genes involved in malignant transfromation
(DGIdb 4.0)
Entrez IDSymbolCategoryInteraction TypesDrug Claim NameDrug NamePMIDs
Page: 1