
|
|||||
|
 | |
| |
| |
| |
| |
| |
|
Gene: DEDD |
Gene summary for DEDD |
| Gene information | Species | Human | Gene symbol | DEDD | Gene ID | 9191 |
| Gene name | death effector domain containing | |
| Gene Alias | CASP8IP1 | |
| Cytomap | 1q23.3 | |
| Gene Type | protein-coding | GO ID | GO:0000003 | UniProtAcc | O75618 |
Top |
Malignant transformation analysis |
| Identification of the aberrant gene expression in precancerous and cancerous lesions by comparing the gene expression of stem-like cells in diseased tissues with normal stem cells |
| Entrez ID | Symbol | Replicates | Species | Organ | Tissue | Adj P-value | Log2FC | Malignancy |
| 9191 | DEDD | LZE2T | Human | Esophagus | ESCC | 2.91e-03 | 5.05e-01 | 0.082 |
| 9191 | DEDD | LZE4T | Human | Esophagus | ESCC | 1.65e-11 | 2.87e-01 | 0.0811 |
| 9191 | DEDD | LZE7T | Human | Esophagus | ESCC | 1.49e-02 | 3.28e-01 | 0.0667 |
| 9191 | DEDD | LZE8T | Human | Esophagus | ESCC | 1.03e-07 | 1.73e-01 | 0.067 |
| 9191 | DEDD | LZE20T | Human | Esophagus | ESCC | 2.01e-08 | 1.79e-01 | 0.0662 |
| 9191 | DEDD | LZE22T | Human | Esophagus | ESCC | 3.81e-07 | 4.83e-01 | 0.068 |
| 9191 | DEDD | LZE24T | Human | Esophagus | ESCC | 5.75e-16 | 4.04e-01 | 0.0596 |
| 9191 | DEDD | LZE6T | Human | Esophagus | ESCC | 6.39e-03 | 2.23e-01 | 0.0845 |
| 9191 | DEDD | P1T-E | Human | Esophagus | ESCC | 4.78e-07 | 3.93e-01 | 0.0875 |
| 9191 | DEDD | P2T-E | Human | Esophagus | ESCC | 8.36e-24 | 5.48e-01 | 0.1177 |
| 9191 | DEDD | P4T-E | Human | Esophagus | ESCC | 2.09e-44 | 1.01e+00 | 0.1323 |
| 9191 | DEDD | P5T-E | Human | Esophagus | ESCC | 5.16e-19 | 4.53e-01 | 0.1327 |
| 9191 | DEDD | P8T-E | Human | Esophagus | ESCC | 7.71e-19 | 3.08e-01 | 0.0889 |
| 9191 | DEDD | P9T-E | Human | Esophagus | ESCC | 1.12e-21 | 5.15e-01 | 0.1131 |
| 9191 | DEDD | P10T-E | Human | Esophagus | ESCC | 8.65e-16 | 3.13e-01 | 0.116 |
| 9191 | DEDD | P11T-E | Human | Esophagus | ESCC | 1.49e-16 | 3.51e-01 | 0.1426 |
| 9191 | DEDD | P12T-E | Human | Esophagus | ESCC | 1.65e-24 | 3.37e-01 | 0.1122 |
| 9191 | DEDD | P15T-E | Human | Esophagus | ESCC | 8.35e-28 | 5.96e-01 | 0.1149 |
| 9191 | DEDD | P16T-E | Human | Esophagus | ESCC | 3.50e-32 | 4.81e-01 | 0.1153 |
| 9191 | DEDD | P17T-E | Human | Esophagus | ESCC | 7.13e-05 | 2.85e-01 | 0.1278 |
| Page: 1 2 3 4 5 |
| Tissue | Expression Dynamics | Abbreviation |
| Esophagus |  | ESCC: Esophageal squamous cell carcinoma |
| HGIN: High-grade intraepithelial neoplasias | ||
| LGIN: Low-grade intraepithelial neoplasias | ||
| Liver |  | HCC: Hepatocellular carcinoma |
| NAFLD: Non-alcoholic fatty liver disease | ||
| Oral Cavity | 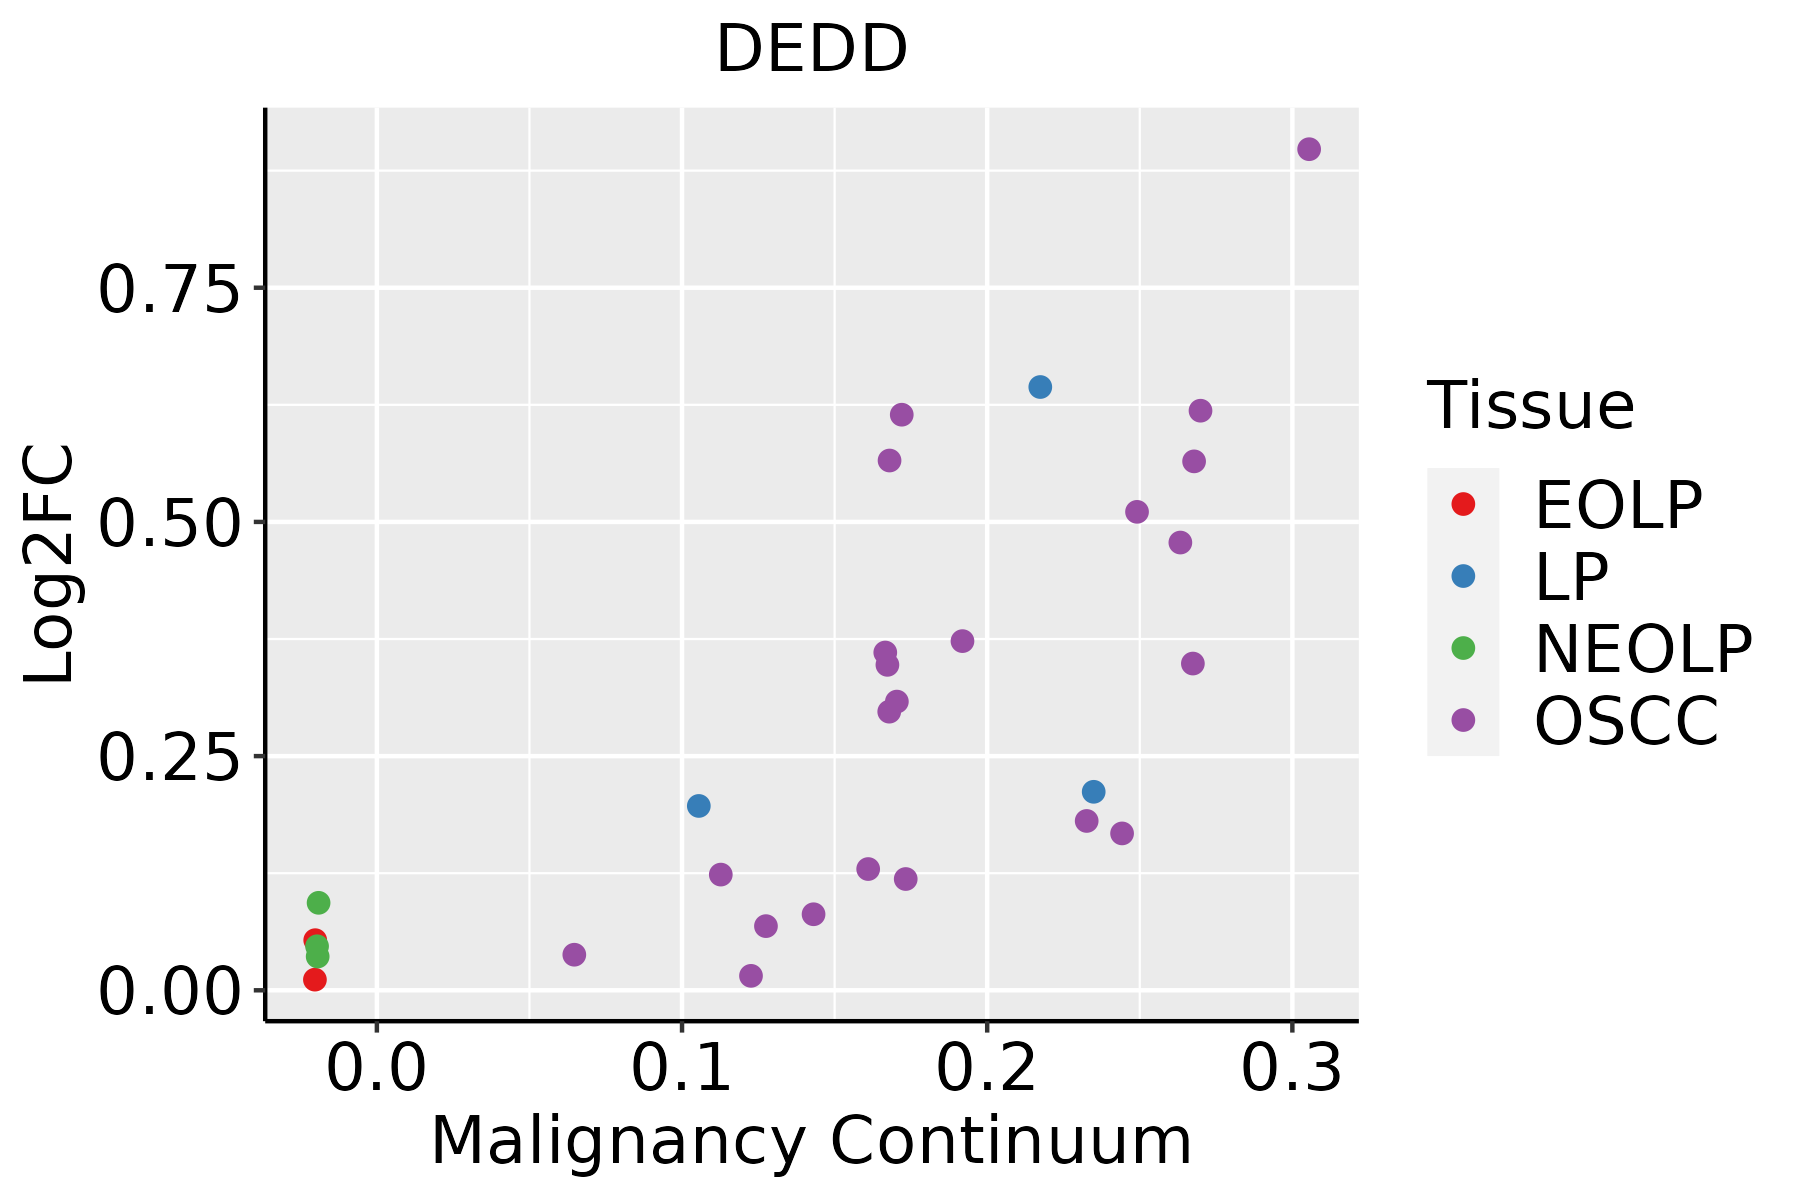 | EOLP: Erosive Oral lichen planus |
| LP: leukoplakia | ||
| NEOLP: Non-erosive oral lichen planus | ||
| OSCC: Oral squamous cell carcinoma |
| ∗log2FC in expression of this searched gene in stem-like cells from each diseased tissue sample relative to stem-like cells in normal samples in each tissue plotted against the malignancy continuum. Samples are colored based on if they are from different disease stage. |
Top |
Malignant transformation related pathway analysis |
| Find out the enriched GO biological processes and KEGG pathways involved in transition from healthy to precancer to cancer |
| Tissue | Disease Stage | Enriched GO biological Processes |
| Colorectum | AD |  |
| Colorectum | SER |  |
| Colorectum | MSS |  |
| Colorectum | MSI-H |  |
| Colorectum | FAP |  |
| ∗Top 15 enriched GO BP terms are showed in the bar plot of each disease state in each tissue. Each row represents a significant GO biological process which is colored according to the -log10(p.adjust). |
| Page: 1 2 3 4 5 6 7 8 9 |
| GO ID | Tissue | Disease Stage | Description | Gene Ratio | Bg Ratio | pvalue | p.adjust | Count |
| GO:200123327 | Esophagus | HGIN | regulation of apoptotic signaling pathway | 97/2587 | 356/18723 | 1.36e-11 | 1.57e-09 | 97 |
| GO:001607219 | Esophagus | HGIN | rRNA metabolic process | 72/2587 | 236/18723 | 2.26e-11 | 2.56e-09 | 72 |
| GO:000640120 | Esophagus | HGIN | RNA catabolic process | 77/2587 | 278/18723 | 7.63e-10 | 6.36e-08 | 77 |
| GO:003465519 | Esophagus | HGIN | nucleobase-containing compound catabolic process | 98/2587 | 407/18723 | 1.44e-08 | 8.94e-07 | 98 |
| GO:004670017 | Esophagus | HGIN | heterocycle catabolic process | 103/2587 | 445/18723 | 5.44e-08 | 2.99e-06 | 103 |
| GO:200123519 | Esophagus | HGIN | positive regulation of apoptotic signaling pathway | 41/2587 | 126/18723 | 6.06e-08 | 3.22e-06 | 41 |
| GO:002241120 | Esophagus | HGIN | cellular component disassembly | 102/2587 | 443/18723 | 8.31e-08 | 4.33e-06 | 102 |
| GO:004427018 | Esophagus | HGIN | cellular nitrogen compound catabolic process | 103/2587 | 451/18723 | 1.10e-07 | 5.56e-06 | 103 |
| GO:001943917 | Esophagus | HGIN | aromatic compound catabolic process | 105/2587 | 467/18723 | 1.89e-07 | 9.31e-06 | 105 |
| GO:190136117 | Esophagus | HGIN | organic cyclic compound catabolic process | 106/2587 | 495/18723 | 1.94e-06 | 7.13e-05 | 106 |
| GO:00346606 | Esophagus | HGIN | ncRNA metabolic process | 104/2587 | 485/18723 | 2.26e-06 | 8.23e-05 | 104 |
| GO:009719126 | Esophagus | HGIN | extrinsic apoptotic signaling pathway | 56/2587 | 219/18723 | 2.48e-06 | 8.80e-05 | 56 |
| GO:000862518 | Esophagus | HGIN | extrinsic apoptotic signaling pathway via death domain receptors | 23/2587 | 82/18723 | 5.47e-04 | 7.73e-03 | 23 |
| GO:200123626 | Esophagus | HGIN | regulation of extrinsic apoptotic signaling pathway | 36/2587 | 151/18723 | 6.20e-04 | 8.58e-03 | 36 |
| GO:200123810 | Esophagus | HGIN | positive regulation of extrinsic apoptotic signaling pathway | 15/2587 | 48/18723 | 1.49e-03 | 1.73e-02 | 15 |
| GO:0016072110 | Esophagus | ESCC | rRNA metabolic process | 197/8552 | 236/18723 | 1.31e-33 | 1.18e-30 | 197 |
| GO:003466012 | Esophagus | ESCC | ncRNA metabolic process | 346/8552 | 485/18723 | 4.35e-31 | 2.51e-28 | 346 |
| GO:0042176111 | Esophagus | ESCC | regulation of protein catabolic process | 280/8552 | 391/18723 | 8.65e-26 | 2.39e-23 | 280 |
| GO:2001233111 | Esophagus | ESCC | regulation of apoptotic signaling pathway | 256/8552 | 356/18723 | 4.11e-24 | 1.04e-21 | 256 |
| GO:0022411111 | Esophagus | ESCC | cellular component disassembly | 305/8552 | 443/18723 | 1.94e-23 | 4.57e-21 | 305 |
| Page: 1 2 3 4 5 6 7 8 9 10 |
| Pathway ID | Tissue | Disease Stage | Description | Gene Ratio | Bg Ratio | pvalue | p.adjust | qvalue | Count |
| Page: 1 |
Top |
Cell-cell communication analysis |
| Identification of potential cell-cell interactions between two cell types and their ligand-receptor pairs for different disease states |
| Ligand | Receptor | LRpair | Pathway | Tissue | Disease Stage |
| Page: 1 |
Top |
Single-cell gene regulatory network inference analysis |
| Find out the significant the regulons (TFs) and the target genes of each regulon across cell types for different disease states |
| TF | Cell Type | Tissue | Disease Stage | Target Gene | RSS | Regulon Activity |
| ∗The dot plots of a searched regulon are shown for all cell subpopulations in each disease state of each tissue based on the regulon specific score inferred using pySCENIC and by calculating the average expression. |
| Page: 1 |
Top |
Somatic mutation of malignant transformation related genes |
| Annotation of somatic variants for genes involved in malignant transformation |
| Hugo Symbol | Variant Class | Variant Classification | dbSNP RS | HGVSc | HGVSp | HGVSp Short | SWISSPROT | BIOTYPE | SIFT | PolyPhen | Tumor Sample Barcode | Tissue | Histology | Sex | Age | Stage | Therapy Types | Drugs | Outcome |
| DEDD | SNV | Missense_Mutation | rs377566442 | c.530G>A | p.Arg177Gln | p.R177Q | protein_coding | tolerated(0.1) | benign(0.119) | TCGA-AN-A046-01 | Breast | breast invasive carcinoma | Female | >=65 | I/II | Unknown | Unknown | SD | |
| DEDD | SNV | Missense_Mutation | c.312N>C | p.Lys104Asn | p.K104N | protein_coding | deleterious(0.01) | possibly_damaging(0.493) | TCGA-D8-A27G-01 | Breast | breast invasive carcinoma | Female | >=65 | I/II | Unknown | Unknown | SD | ||
| DEDD | insertion | In_Frame_Ins | novel | c.861_862insCTGGGCTCCATCATCTGTGACATCAAGTTCTCTGAGCTCACCTACCTCGAT | p.Leu271_Asp287dup | p.L271_D287dup | protein_coding | TCGA-E2-A152-01 | Breast | breast invasive carcinoma | Female | <65 | I/II | Targeted Molecular therapy | trastuzumab | PD | |||
| DEDD | SNV | Missense_Mutation | c.718N>A | p.Leu240Met | p.L240M | protein_coding | deleterious(0) | probably_damaging(0.968) | TCGA-DS-A0VM-01 | Cervix | cervical & endocervical cancer | Female | <65 | I/II | Chemotherapy | cisplatin | PD | ||
| DEDD | SNV | Missense_Mutation | c.56N>G | p.Gln19Arg | p.Q19R | protein_coding | tolerated(0.66) | benign(0) | TCGA-A6-6780-01 | Colorectum | colon adenocarcinoma | Male | >=65 | I/II | Unknown | Unknown | SD | ||
| DEDD | SNV | Missense_Mutation | c.320N>T | p.Arg107Leu | p.R107L | protein_coding | deleterious(0.05) | benign(0.371) | TCGA-A6-A565-01 | Colorectum | colon adenocarcinoma | Female | <65 | III/IV | Unspecific | 5FU | PD | ||
| DEDD | SNV | Missense_Mutation | novel | c.625N>C | p.Glu209Gln | p.E209Q | protein_coding | tolerated(0.38) | benign(0) | TCGA-AA-3715-01 | Colorectum | colon adenocarcinoma | Male | >=65 | I/II | Unknown | Unknown | PD | |
| DEDD | SNV | Missense_Mutation | c.761N>A | p.Arg254His | p.R254H | protein_coding | deleterious(0) | probably_damaging(0.935) | TCGA-AZ-6598-01 | Colorectum | colon adenocarcinoma | Female | >=65 | I/II | Unknown | Unknown | SD | ||
| DEDD | SNV | Missense_Mutation | novel | c.840C>A | p.Phe280Leu | p.F280L | protein_coding | deleterious(0) | probably_damaging(0.993) | TCGA-AG-A002-01 | Colorectum | rectum adenocarcinoma | Male | <65 | I/II | Unknown | Unknown | SD | |
| DEDD | SNV | Missense_Mutation | c.127N>T | p.Arg43Cys | p.R43C | protein_coding | deleterious(0) | probably_damaging(0.997) | TCGA-AJ-A3EL-01 | Endometrium | uterine corpus endometrioid carcinoma | Female | <65 | I/II | Unknown | Unknown | SD |
| Page: 1 2 3 |
Top |
Related drugs of malignant transformation related genes |
| Identification of chemicals and drugs interact with genes involved in malignant transfromation |
| (DGIdb 4.0) |
| Entrez ID | Symbol | Category | Interaction Types | Drug Claim Name | Drug Name | PMIDs |
| Page: 1 |

Copyright 2023-Present -The University of Texas Health Science Center at Houston |