
|
|||||
|
 | |
| |
| |
| |
| |
| |
|
Gene: DECR2 |
Gene summary for DECR2 |
| Gene information | Species | Human | Gene symbol | DECR2 | Gene ID | 26063 |
| Gene name | 2,4-dienoyl-CoA reductase 2 | |
| Gene Alias | PDCR | |
| Cytomap | 16p13.3 | |
| Gene Type | protein-coding | GO ID | GO:0006082 | UniProtAcc | Q9NUI1 |
Top |
Malignant transformation analysis |
| Identification of the aberrant gene expression in precancerous and cancerous lesions by comparing the gene expression of stem-like cells in diseased tissues with normal stem cells |
| Entrez ID | Symbol | Replicates | Species | Organ | Tissue | Adj P-value | Log2FC | Malignancy |
| 26063 | DECR2 | LZE7T | Human | Esophagus | ESCC | 5.29e-06 | 2.32e-01 | 0.0667 |
| 26063 | DECR2 | LZE21D1 | Human | Esophagus | HGIN | 3.59e-03 | 2.29e-01 | 0.0632 |
| 26063 | DECR2 | LZE24T | Human | Esophagus | ESCC | 1.22e-11 | 2.25e-01 | 0.0596 |
| 26063 | DECR2 | P1T-E | Human | Esophagus | ESCC | 1.94e-05 | 2.25e-01 | 0.0875 |
| 26063 | DECR2 | P2T-E | Human | Esophagus | ESCC | 6.15e-21 | 3.39e-01 | 0.1177 |
| 26063 | DECR2 | P4T-E | Human | Esophagus | ESCC | 1.16e-15 | 3.29e-01 | 0.1323 |
| 26063 | DECR2 | P5T-E | Human | Esophagus | ESCC | 6.58e-12 | 2.18e-01 | 0.1327 |
| 26063 | DECR2 | P8T-E | Human | Esophagus | ESCC | 2.16e-07 | 1.47e-01 | 0.0889 |
| 26063 | DECR2 | P9T-E | Human | Esophagus | ESCC | 5.73e-05 | 1.41e-01 | 0.1131 |
| 26063 | DECR2 | P10T-E | Human | Esophagus | ESCC | 1.76e-15 | 9.77e-02 | 0.116 |
| 26063 | DECR2 | P11T-E | Human | Esophagus | ESCC | 1.22e-04 | 2.03e-01 | 0.1426 |
| 26063 | DECR2 | P12T-E | Human | Esophagus | ESCC | 1.60e-17 | 4.10e-01 | 0.1122 |
| 26063 | DECR2 | P15T-E | Human | Esophagus | ESCC | 1.39e-18 | 3.85e-01 | 0.1149 |
| 26063 | DECR2 | P16T-E | Human | Esophagus | ESCC | 6.57e-13 | 1.79e-01 | 0.1153 |
| 26063 | DECR2 | P19T-E | Human | Esophagus | ESCC | 1.03e-02 | 4.28e-01 | 0.1662 |
| 26063 | DECR2 | P20T-E | Human | Esophagus | ESCC | 9.83e-13 | 3.12e-01 | 0.1124 |
| 26063 | DECR2 | P21T-E | Human | Esophagus | ESCC | 1.81e-09 | 1.68e-01 | 0.1617 |
| 26063 | DECR2 | P22T-E | Human | Esophagus | ESCC | 8.50e-11 | 2.19e-01 | 0.1236 |
| 26063 | DECR2 | P23T-E | Human | Esophagus | ESCC | 2.16e-07 | 2.56e-01 | 0.108 |
| 26063 | DECR2 | P24T-E | Human | Esophagus | ESCC | 9.72e-08 | 1.64e-01 | 0.1287 |
| Page: 1 2 3 4 5 |
| Tissue | Expression Dynamics | Abbreviation |
| Esophagus | 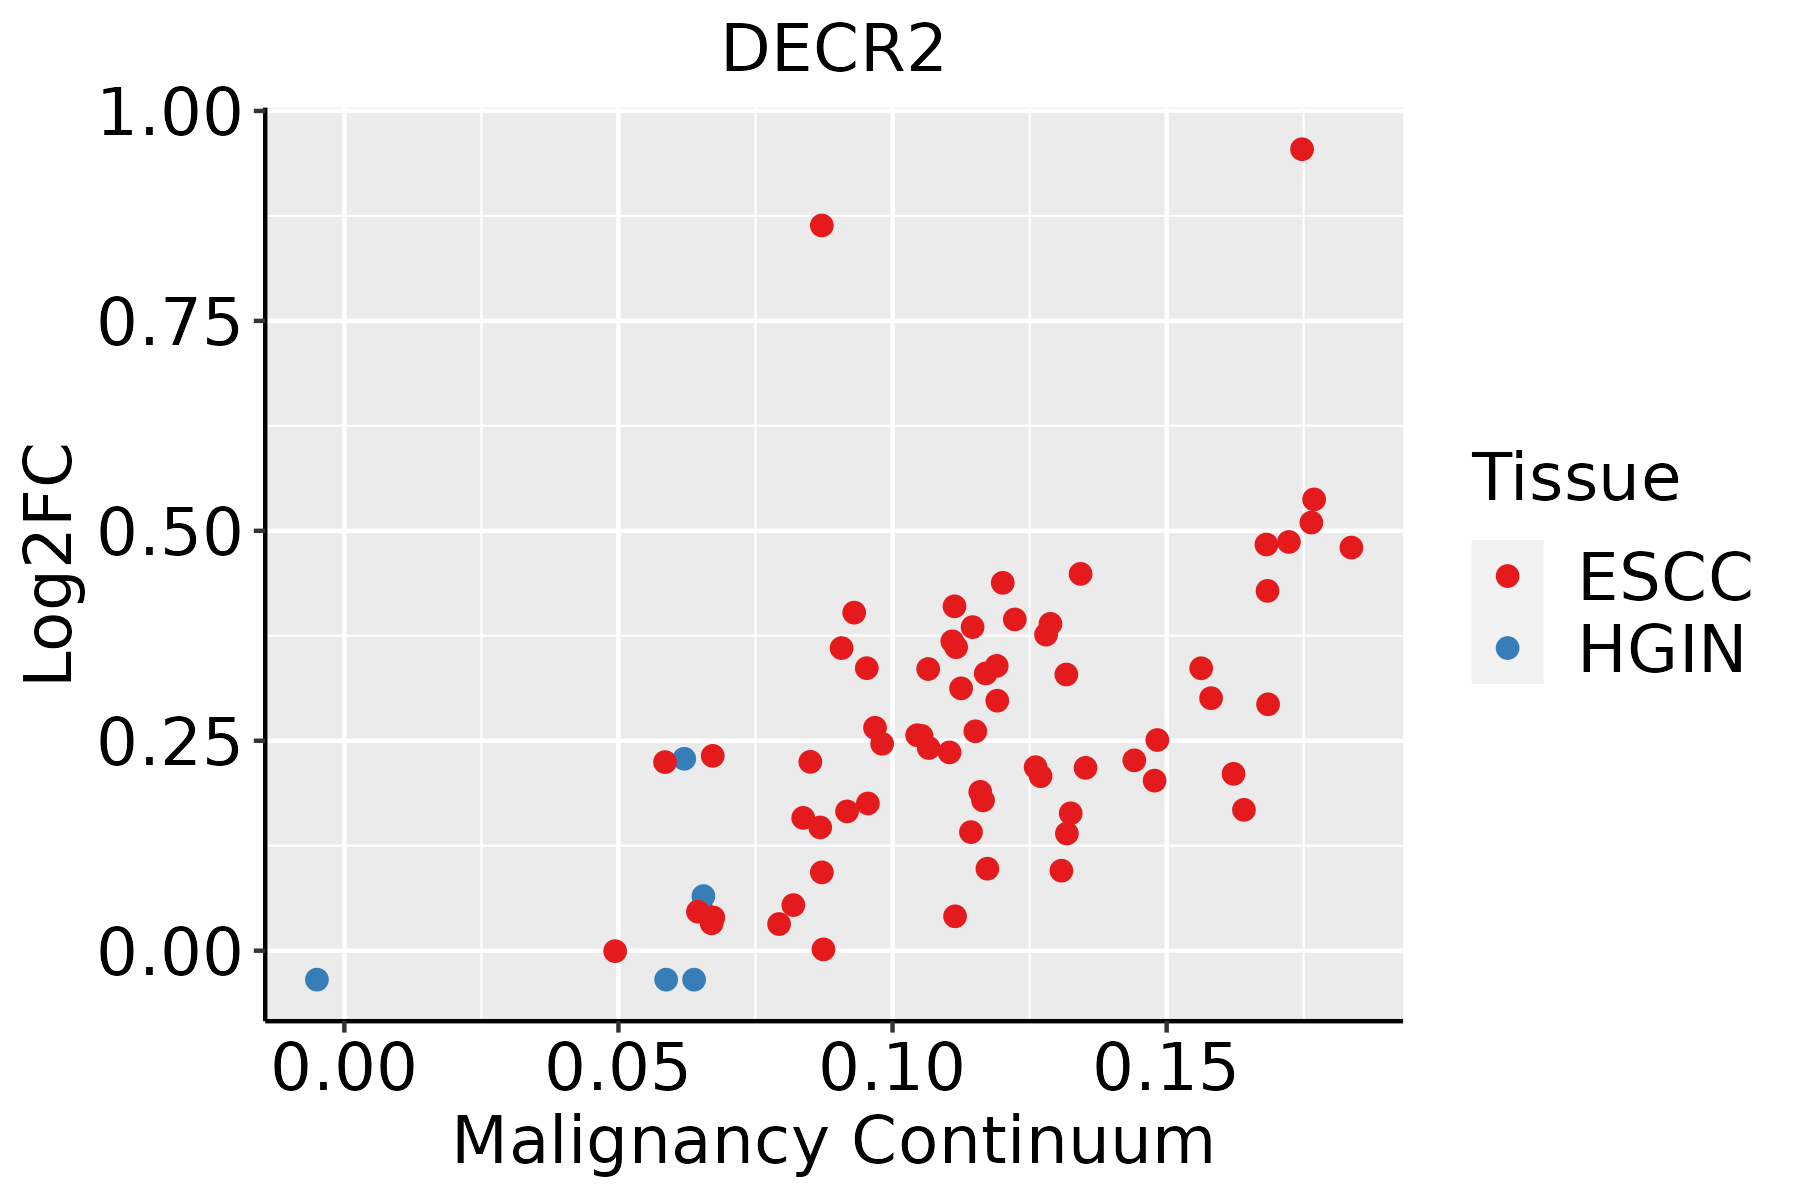 | ESCC: Esophageal squamous cell carcinoma |
| HGIN: High-grade intraepithelial neoplasias | ||
| LGIN: Low-grade intraepithelial neoplasias | ||
| Liver | 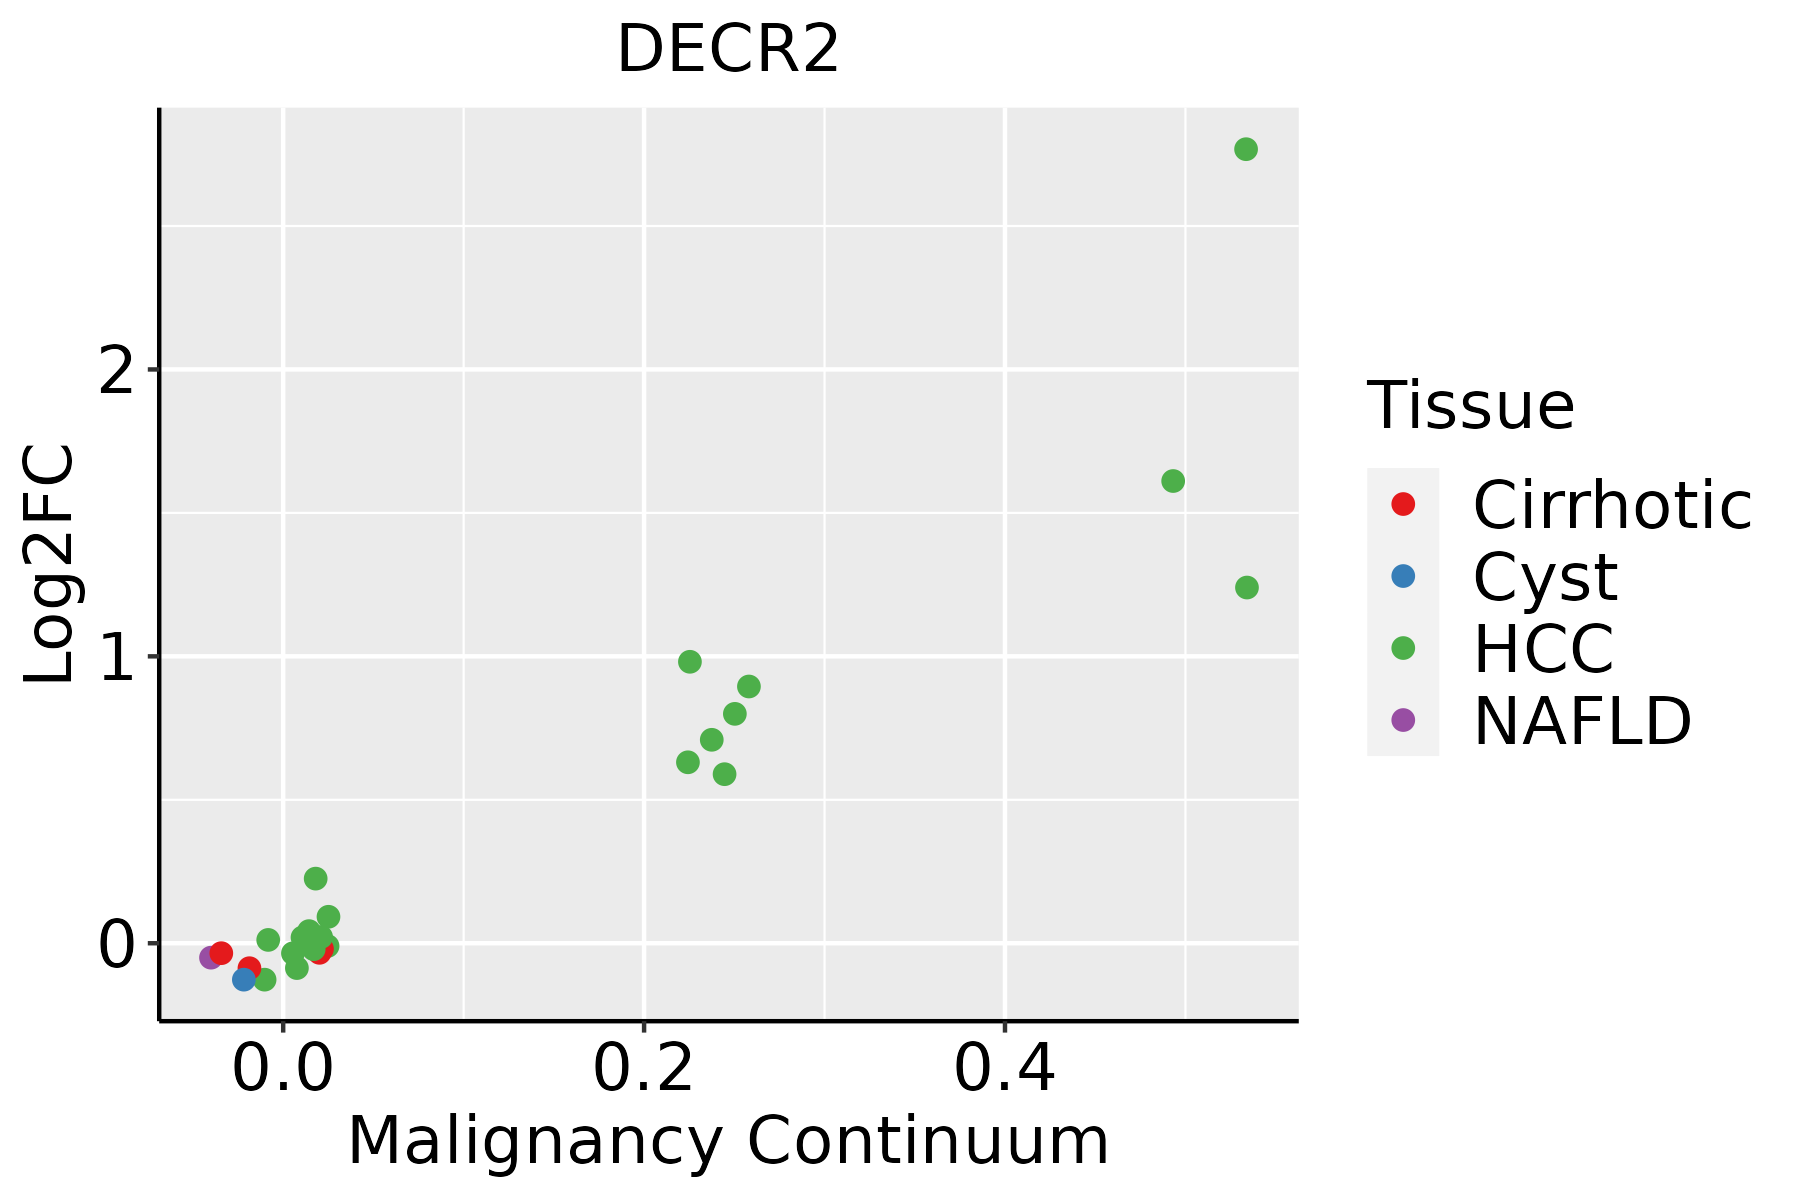 | HCC: Hepatocellular carcinoma |
| NAFLD: Non-alcoholic fatty liver disease | ||
| Oral Cavity | 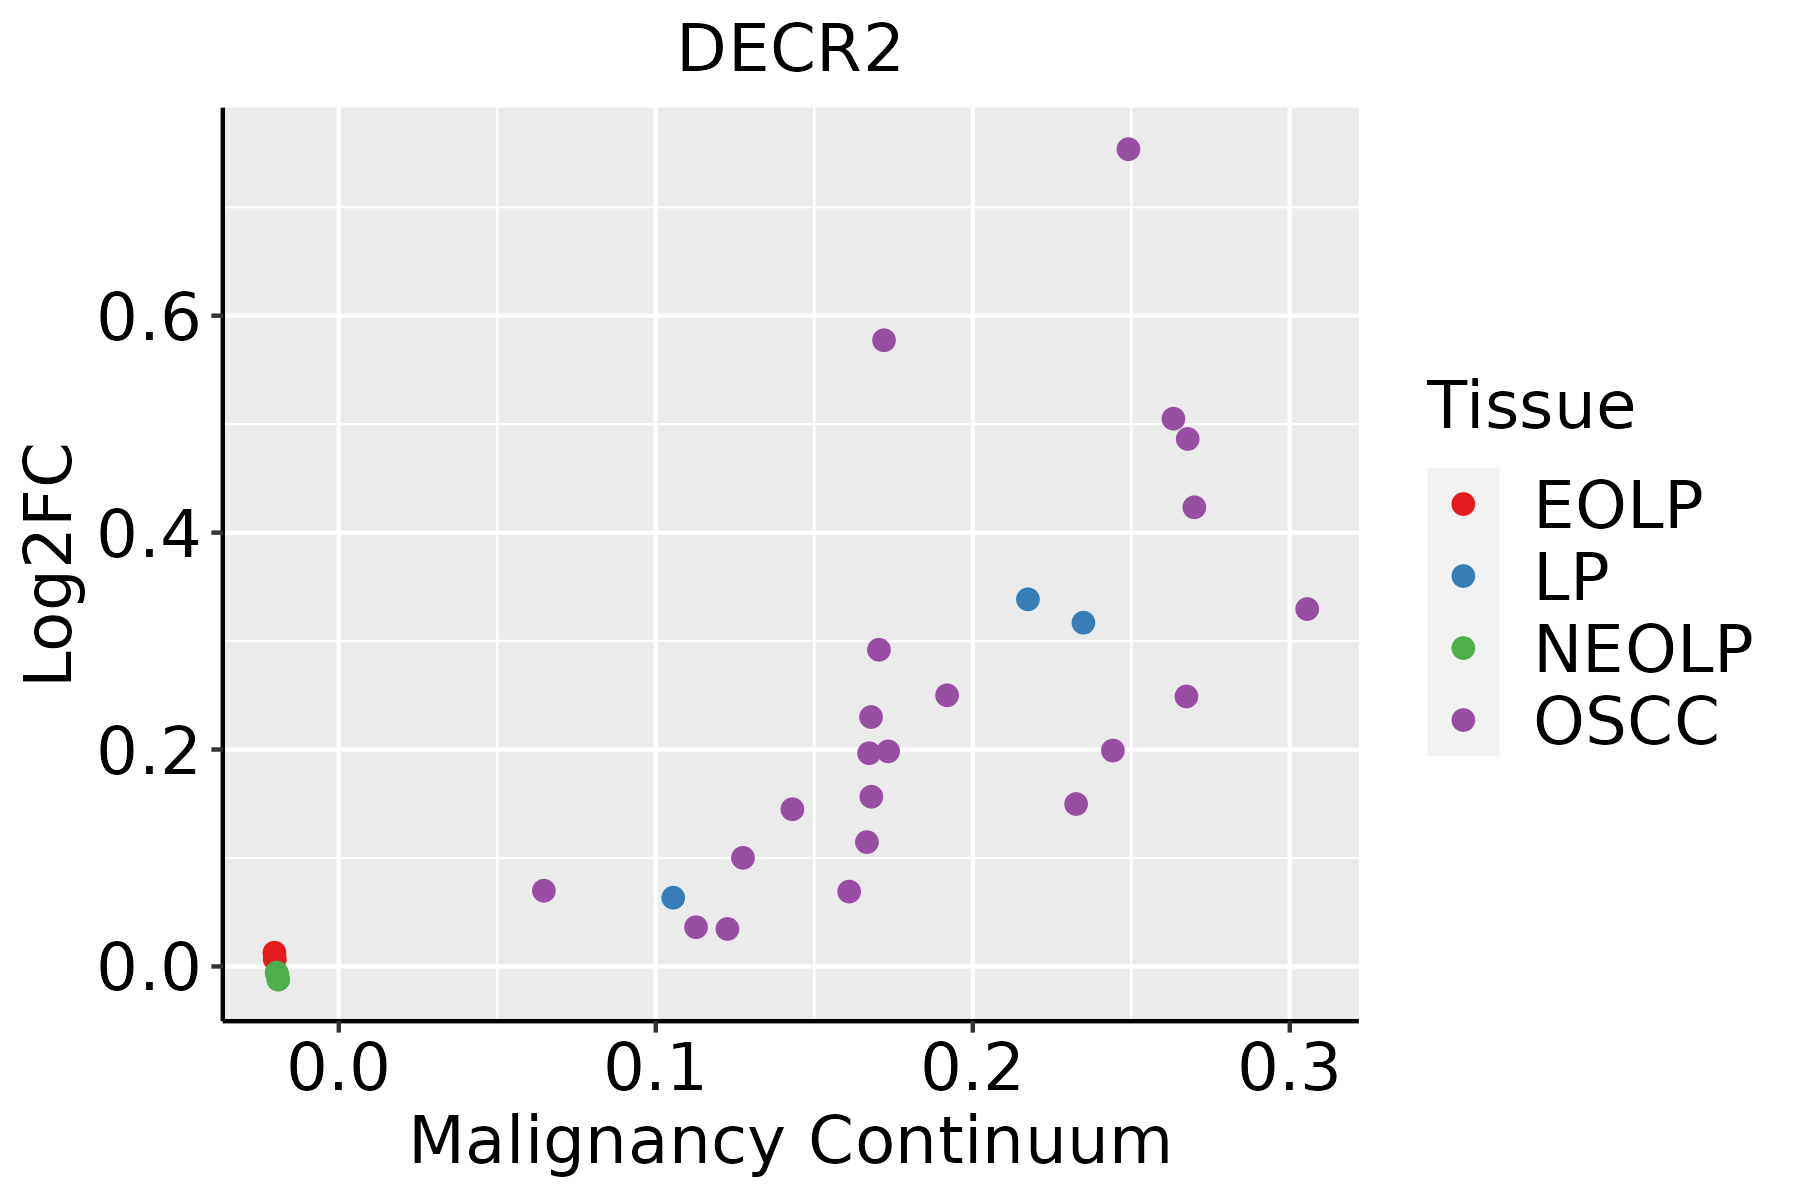 | EOLP: Erosive Oral lichen planus |
| LP: leukoplakia | ||
| NEOLP: Non-erosive oral lichen planus | ||
| OSCC: Oral squamous cell carcinoma |
| ∗log2FC in expression of this searched gene in stem-like cells from each diseased tissue sample relative to stem-like cells in normal samples in each tissue plotted against the malignancy continuum. Samples are colored based on if they are from different disease stage. |
Top |
Malignant transformation related pathway analysis |
| Find out the enriched GO biological processes and KEGG pathways involved in transition from healthy to precancer to cancer |
| Tissue | Disease Stage | Enriched GO biological Processes |
| Colorectum | AD |  |
| Colorectum | SER |  |
| Colorectum | MSS |  |
| Colorectum | MSI-H |  |
| Colorectum | FAP |  |
| ∗Top 15 enriched GO BP terms are showed in the bar plot of each disease state in each tissue. Each row represents a significant GO biological process which is colored according to the -log10(p.adjust). |
| Page: 1 2 3 4 5 6 7 8 9 |
| GO ID | Tissue | Disease Stage | Description | Gene Ratio | Bg Ratio | pvalue | p.adjust | Count |
| GO:00193958 | Esophagus | ESCC | fatty acid oxidation | 69/8552 | 103/18723 | 9.95e-06 | 9.44e-05 | 69 |
| GO:00344407 | Esophagus | ESCC | lipid oxidation | 71/8552 | 108/18723 | 2.00e-05 | 1.74e-04 | 71 |
| GO:00090628 | Esophagus | ESCC | fatty acid catabolic process | 66/8552 | 100/18723 | 3.21e-05 | 2.66e-04 | 66 |
| GO:00066318 | Esophagus | ESCC | fatty acid metabolic process | 217/8552 | 390/18723 | 4.21e-05 | 3.39e-04 | 217 |
| GO:00066358 | Esophagus | ESCC | fatty acid beta-oxidation | 50/8552 | 74/18723 | 1.16e-04 | 8.04e-04 | 50 |
| GO:00463948 | Esophagus | ESCC | carboxylic acid biosynthetic process | 175/8552 | 314/18723 | 1.98e-04 | 1.26e-03 | 175 |
| GO:00160538 | Esophagus | ESCC | organic acid biosynthetic process | 175/8552 | 316/18723 | 3.04e-04 | 1.82e-03 | 175 |
| GO:00723297 | Esophagus | ESCC | monocarboxylic acid catabolic process | 74/8552 | 122/18723 | 6.03e-04 | 3.27e-03 | 74 |
| GO:00442427 | Esophagus | ESCC | cellular lipid catabolic process | 121/8552 | 214/18723 | 8.63e-04 | 4.43e-03 | 121 |
| GO:00442827 | Esophagus | ESCC | small molecule catabolic process | 201/8552 | 376/18723 | 1.35e-03 | 6.41e-03 | 201 |
| GO:00302586 | Esophagus | ESCC | lipid modification | 116/8552 | 212/18723 | 4.90e-03 | 1.89e-02 | 116 |
| GO:00160427 | Esophagus | ESCC | lipid catabolic process | 168/8552 | 320/18723 | 7.97e-03 | 2.84e-02 | 168 |
| GO:000663112 | Liver | Cirrhotic | fatty acid metabolic process | 165/4634 | 390/18723 | 1.29e-14 | 1.26e-12 | 165 |
| GO:001605312 | Liver | Cirrhotic | organic acid biosynthetic process | 139/4634 | 316/18723 | 4.28e-14 | 3.83e-12 | 139 |
| GO:004639412 | Liver | Cirrhotic | carboxylic acid biosynthetic process | 137/4634 | 314/18723 | 1.40e-13 | 1.14e-11 | 137 |
| GO:004428211 | Liver | Cirrhotic | small molecule catabolic process | 151/4634 | 376/18723 | 2.20e-11 | 1.34e-09 | 151 |
| GO:001605411 | Liver | Cirrhotic | organic acid catabolic process | 104/4634 | 240/18723 | 1.91e-10 | 9.53e-09 | 104 |
| GO:004639511 | Liver | Cirrhotic | carboxylic acid catabolic process | 102/4634 | 236/18723 | 3.41e-10 | 1.63e-08 | 102 |
| GO:007233011 | Liver | Cirrhotic | monocarboxylic acid biosynthetic process | 93/4634 | 214/18723 | 1.43e-09 | 6.16e-08 | 93 |
| GO:001939512 | Liver | Cirrhotic | fatty acid oxidation | 53/4634 | 103/18723 | 4.73e-09 | 1.88e-07 | 53 |
| Page: 1 2 3 |
| Pathway ID | Tissue | Disease Stage | Description | Gene Ratio | Bg Ratio | pvalue | p.adjust | qvalue | Count |
| hsa041467 | Esophagus | ESCC | Peroxisome | 55/4205 | 82/8465 | 1.04e-03 | 3.27e-03 | 1.68e-03 | 55 |
| hsa0414612 | Esophagus | ESCC | Peroxisome | 55/4205 | 82/8465 | 1.04e-03 | 3.27e-03 | 1.68e-03 | 55 |
| hsa041462 | Liver | Cirrhotic | Peroxisome | 36/2530 | 82/8465 | 4.79e-03 | 1.74e-02 | 1.07e-02 | 36 |
| hsa041463 | Liver | Cirrhotic | Peroxisome | 36/2530 | 82/8465 | 4.79e-03 | 1.74e-02 | 1.07e-02 | 36 |
| hsa041464 | Liver | HCC | Peroxisome | 58/4020 | 82/8465 | 1.57e-05 | 1.05e-04 | 5.85e-05 | 58 |
| hsa041465 | Liver | HCC | Peroxisome | 58/4020 | 82/8465 | 1.57e-05 | 1.05e-04 | 5.85e-05 | 58 |
| hsa041466 | Oral cavity | OSCC | Peroxisome | 47/3704 | 82/8465 | 9.01e-03 | 2.01e-02 | 1.03e-02 | 47 |
| hsa0414611 | Oral cavity | OSCC | Peroxisome | 47/3704 | 82/8465 | 9.01e-03 | 2.01e-02 | 1.03e-02 | 47 |
| Page: 1 |
Top |
Cell-cell communication analysis |
| Identification of potential cell-cell interactions between two cell types and their ligand-receptor pairs for different disease states |
| Ligand | Receptor | LRpair | Pathway | Tissue | Disease Stage |
| Page: 1 |
Top |
Single-cell gene regulatory network inference analysis |
| Find out the significant the regulons (TFs) and the target genes of each regulon across cell types for different disease states |
| TF | Cell Type | Tissue | Disease Stage | Target Gene | RSS | Regulon Activity |
| ∗The dot plots of a searched regulon are shown for all cell subpopulations in each disease state of each tissue based on the regulon specific score inferred using pySCENIC and by calculating the average expression. |
| Page: 1 |
Top |
Somatic mutation of malignant transformation related genes |
| Annotation of somatic variants for genes involved in malignant transformation |
| Hugo Symbol | Variant Class | Variant Classification | dbSNP RS | HGVSc | HGVSp | HGVSp Short | SWISSPROT | BIOTYPE | SIFT | PolyPhen | Tumor Sample Barcode | Tissue | Histology | Sex | Age | Stage | Therapy Types | Drugs | Outcome |
| DECR2 | SNV | Missense_Mutation | novel | c.719G>A | p.Gly240Glu | p.G240E | Q9NUI1 | protein_coding | deleterious(0) | probably_damaging(1) | TCGA-E9-A5FL-01 | Breast | breast invasive carcinoma | Female | >=65 | I/II | Unknown | Unknown | SD |
| DECR2 | SNV | Missense_Mutation | novel | c.193N>T | p.Val65Leu | p.V65L | Q9NUI1 | protein_coding | tolerated(1) | benign(0.01) | TCGA-DS-A1OB-01 | Cervix | cervical & endocervical cancer | Female | <65 | I/II | Chemotherapy | carboplatin | PD |
| DECR2 | SNV | Missense_Mutation | rs74944003 | c.364G>A | p.Ala122Thr | p.A122T | Q9NUI1 | protein_coding | tolerated(0.14) | probably_damaging(0.987) | TCGA-AZ-4616-01 | Colorectum | colon adenocarcinoma | Female | >=65 | III/IV | Chemotherapy | xeloda | PD |
| DECR2 | SNV | Missense_Mutation | rs749387015 | c.191N>A | p.Arg64Gln | p.R64Q | Q9NUI1 | protein_coding | deleterious(0.02) | possibly_damaging(0.732) | TCGA-AZ-6599-01 | Colorectum | colon adenocarcinoma | Male | >=65 | I/II | Unknown | Unknown | SD |
| DECR2 | SNV | Missense_Mutation | c.565N>G | p.Thr189Ala | p.T189A | Q9NUI1 | protein_coding | deleterious(0) | probably_damaging(0.958) | TCGA-CM-6674-01 | Colorectum | colon adenocarcinoma | Male | <65 | I/II | Unknown | Unknown | SD | |
| DECR2 | SNV | Missense_Mutation | rs756055283 | c.436N>T | p.Arg146Cys | p.R146C | Q9NUI1 | protein_coding | deleterious(0) | possibly_damaging(0.806) | TCGA-DM-A0X9-01 | Colorectum | colon adenocarcinoma | Female | >=65 | I/II | Unknown | Unknown | SD |
| DECR2 | SNV | Missense_Mutation | novel | c.172N>A | p.Ala58Thr | p.A58T | Q9NUI1 | protein_coding | tolerated(0.1) | possibly_damaging(0.447) | TCGA-AJ-A3BH-01 | Endometrium | uterine corpus endometrioid carcinoma | Female | Unknown | I/II | Unknown | Unknown | SD |
| DECR2 | SNV | Missense_Mutation | c.164N>T | p.Thr55Met | p.T55M | Q9NUI1 | protein_coding | deleterious(0.05) | possibly_damaging(0.66) | TCGA-AP-A0LD-01 | Endometrium | uterine corpus endometrioid carcinoma | Female | <65 | I/II | Unknown | Unknown | SD | |
| DECR2 | SNV | Missense_Mutation | rs199827797 | c.128N>A | p.Arg43Gln | p.R43Q | Q9NUI1 | protein_coding | tolerated(0.32) | possibly_damaging(0.849) | TCGA-AP-A0LJ-01 | Endometrium | uterine corpus endometrioid carcinoma | Female | <65 | I/II | Unknown | Unknown | SD |
| DECR2 | SNV | Missense_Mutation | novel | c.400A>G | p.Met134Val | p.M134V | Q9NUI1 | protein_coding | tolerated(0.28) | benign(0.001) | TCGA-AP-A1DK-01 | Endometrium | uterine corpus endometrioid carcinoma | Female | <65 | I/II | Unknown | Unknown | SD |
| Page: 1 2 3 |
Top |
Related drugs of malignant transformation related genes |
| Identification of chemicals and drugs interact with genes involved in malignant transfromation |
| (DGIdb 4.0) |
| Entrez ID | Symbol | Category | Interaction Types | Drug Claim Name | Drug Name | PMIDs |
| Page: 1 |

Copyright 2023-Present -The University of Texas Health Science Center at Houston |