
|
|||||
|
 | |
| |
| |
| |
| |
| |
|
Gene: DEAF1 |
Gene summary for DEAF1 |
| Gene information | Species | Human | Gene symbol | DEAF1 | Gene ID | 10522 |
| Gene name | DEAF1 transcription factor | |
| Gene Alias | MRD24 | |
| Cytomap | 11p15.5 | |
| Gene Type | protein-coding | GO ID | GO:0000003 | UniProtAcc | O75398 |
Top |
Malignant transformation analysis |
| Identification of the aberrant gene expression in precancerous and cancerous lesions by comparing the gene expression of stem-like cells in diseased tissues with normal stem cells |
| Entrez ID | Symbol | Replicates | Species | Organ | Tissue | Adj P-value | Log2FC | Malignancy |
| 10522 | DEAF1 | HCC1_Meng | Human | Liver | HCC | 2.51e-71 | 2.08e-01 | 0.0246 |
| 10522 | DEAF1 | HCC2_Meng | Human | Liver | HCC | 1.42e-06 | 4.46e-02 | 0.0107 |
| 10522 | DEAF1 | S014 | Human | Liver | HCC | 2.93e-02 | 2.45e-01 | 0.2254 |
| 10522 | DEAF1 | S016 | Human | Liver | HCC | 3.05e-04 | 3.17e-01 | 0.2243 |
| 10522 | DEAF1 | S027 | Human | Liver | HCC | 1.56e-04 | 6.25e-01 | 0.2446 |
| 10522 | DEAF1 | S028 | Human | Liver | HCC | 7.24e-13 | 6.16e-01 | 0.2503 |
| 10522 | DEAF1 | S029 | Human | Liver | HCC | 2.96e-11 | 6.66e-01 | 0.2581 |
| 10522 | DEAF1 | C21 | Human | Oral cavity | OSCC | 2.11e-05 | 2.21e-01 | 0.2678 |
| 10522 | DEAF1 | C30 | Human | Oral cavity | OSCC | 4.93e-08 | 5.89e-01 | 0.3055 |
| 10522 | DEAF1 | C43 | Human | Oral cavity | OSCC | 3.02e-29 | 6.42e-01 | 0.1704 |
| 10522 | DEAF1 | C46 | Human | Oral cavity | OSCC | 3.85e-11 | 4.25e-01 | 0.1673 |
| 10522 | DEAF1 | C51 | Human | Oral cavity | OSCC | 3.36e-02 | 2.98e-01 | 0.2674 |
| 10522 | DEAF1 | C08 | Human | Oral cavity | OSCC | 6.68e-04 | 1.69e-01 | 0.1919 |
| 10522 | DEAF1 | C09 | Human | Oral cavity | OSCC | 1.42e-08 | 5.39e-01 | 0.1431 |
| 10522 | DEAF1 | LN46 | Human | Oral cavity | OSCC | 1.97e-13 | 7.07e-01 | 0.1666 |
| 10522 | DEAF1 | SYSMH1 | Human | Oral cavity | OSCC | 7.85e-15 | 3.01e-01 | 0.1127 |
| 10522 | DEAF1 | SYSMH2 | Human | Oral cavity | OSCC | 1.65e-06 | 2.31e-01 | 0.2326 |
| 10522 | DEAF1 | SYSMH3 | Human | Oral cavity | OSCC | 9.03e-05 | 2.29e-01 | 0.2442 |
| 10522 | DEAF1 | SYSMH4 | Human | Oral cavity | OSCC | 5.28e-08 | 1.17e-01 | 0.1226 |
| 10522 | DEAF1 | SYSMH6 | Human | Oral cavity | OSCC | 4.11e-06 | 1.53e-01 | 0.1275 |
| Page: 1 2 |
| Tissue | Expression Dynamics | Abbreviation |
| Liver | 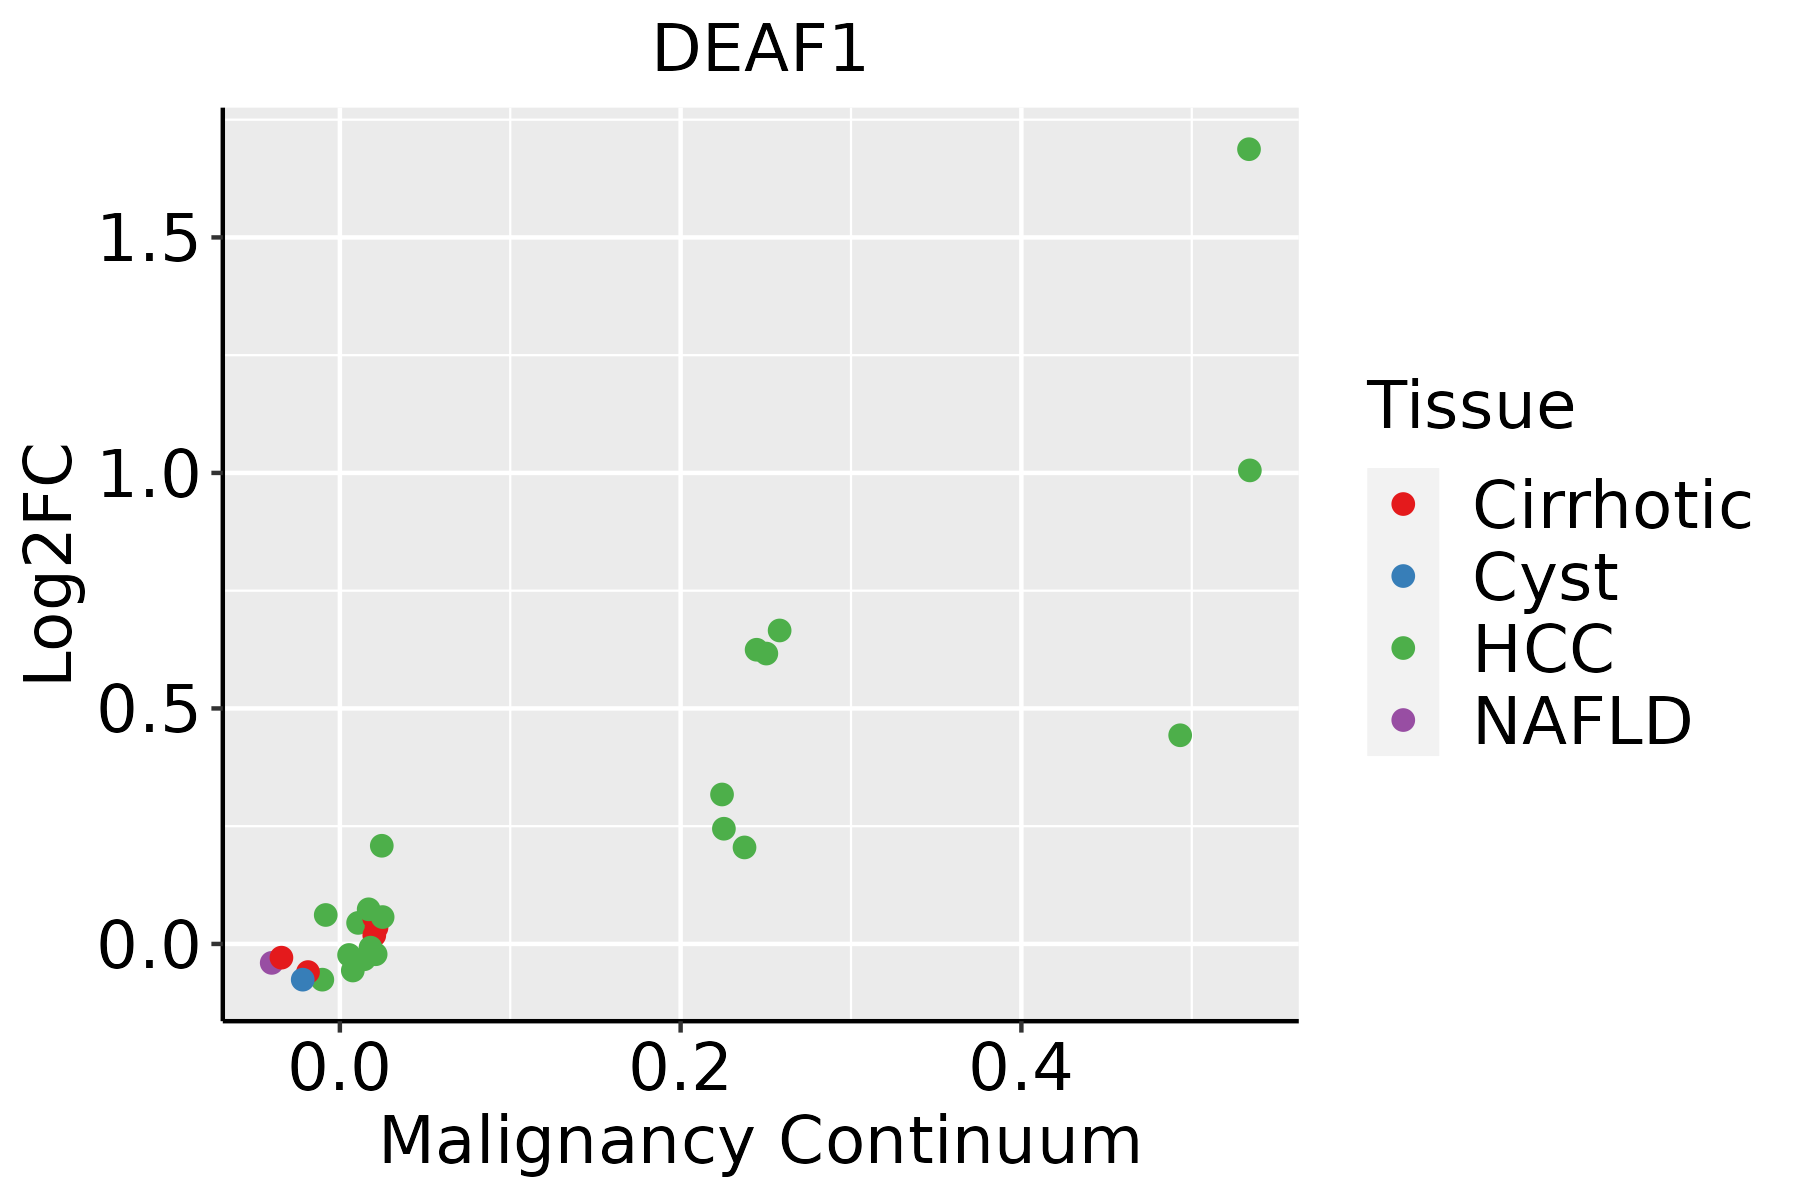 | HCC: Hepatocellular carcinoma |
| NAFLD: Non-alcoholic fatty liver disease | ||
| Oral Cavity |  | EOLP: Erosive Oral lichen planus |
| LP: leukoplakia | ||
| NEOLP: Non-erosive oral lichen planus | ||
| OSCC: Oral squamous cell carcinoma | ||
| Skin |  | AK: Actinic keratosis |
| cSCC: Cutaneous squamous cell carcinoma | ||
| SCCIS:squamous cell carcinoma in situ | ||
| Thyroid |  | ATC: Anaplastic thyroid cancer |
| HT: Hashimoto's thyroiditis | ||
| PTC: Papillary thyroid cancer |
| ∗log2FC in expression of this searched gene in stem-like cells from each diseased tissue sample relative to stem-like cells in normal samples in each tissue plotted against the malignancy continuum. Samples are colored based on if they are from different disease stage. |
Top |
Malignant transformation related pathway analysis |
| Find out the enriched GO biological processes and KEGG pathways involved in transition from healthy to precancer to cancer |
| Tissue | Disease Stage | Enriched GO biological Processes |
| Colorectum | AD |  |
| Colorectum | SER |  |
| Colorectum | MSS |  |
| Colorectum | MSI-H |  |
| Colorectum | FAP |  |
| ∗Top 15 enriched GO BP terms are showed in the bar plot of each disease state in each tissue. Each row represents a significant GO biological process which is colored according to the -log10(p.adjust). |
| Page: 1 2 3 4 5 6 7 8 9 |
| GO ID | Tissue | Disease Stage | Description | Gene Ratio | Bg Ratio | pvalue | p.adjust | Count |
| GO:004873222 | Liver | HCC | gland development | 242/7958 | 436/18723 | 2.26e-08 | 5.28e-07 | 242 |
| GO:00018415 | Liver | HCC | neural tube formation | 62/7958 | 102/18723 | 1.47e-04 | 1.18e-03 | 62 |
| GO:00018433 | Liver | HCC | neural tube closure | 53/7958 | 88/18723 | 5.95e-04 | 3.75e-03 | 53 |
| GO:00140204 | Liver | HCC | primary neural tube formation | 56/7958 | 94/18723 | 6.19e-04 | 3.86e-03 | 56 |
| GO:00606063 | Liver | HCC | tube closure | 53/7958 | 89/18723 | 8.67e-04 | 5.14e-03 | 53 |
| GO:00308795 | Liver | HCC | mammary gland development | 75/7958 | 137/18723 | 2.52e-03 | 1.22e-02 | 75 |
| GO:00219154 | Liver | HCC | neural tube development | 82/7958 | 152/18723 | 2.83e-03 | 1.33e-02 | 82 |
| GO:00018384 | Liver | HCC | embryonic epithelial tube formation | 66/7958 | 121/18723 | 4.94e-03 | 2.07e-02 | 66 |
| GO:00721754 | Liver | HCC | epithelial tube formation | 70/7958 | 132/18723 | 9.29e-03 | 3.57e-02 | 70 |
| GO:00351484 | Liver | HCC | tube formation | 77/7958 | 148/18723 | 1.20e-02 | 4.39e-02 | 77 |
| GO:004873220 | Oral cavity | OSCC | gland development | 226/7305 | 436/18723 | 2.78e-08 | 5.39e-07 | 226 |
| GO:005067310 | Oral cavity | OSCC | epithelial cell proliferation | 212/7305 | 437/18723 | 2.82e-05 | 2.61e-04 | 212 |
| GO:000184110 | Oral cavity | OSCC | neural tube formation | 60/7305 | 102/18723 | 3.90e-05 | 3.43e-04 | 60 |
| GO:00140208 | Oral cavity | OSCC | primary neural tube formation | 55/7305 | 94/18723 | 9.87e-05 | 7.43e-04 | 55 |
| GO:00018437 | Oral cavity | OSCC | neural tube closure | 52/7305 | 88/18723 | 1.06e-04 | 7.84e-04 | 52 |
| GO:00606066 | Oral cavity | OSCC | tube closure | 52/7305 | 89/18723 | 1.59e-04 | 1.10e-03 | 52 |
| GO:00018388 | Oral cavity | OSCC | embryonic epithelial tube formation | 66/7305 | 121/18723 | 3.70e-04 | 2.26e-03 | 66 |
| GO:003514810 | Oral cavity | OSCC | tube formation | 78/7305 | 148/18723 | 4.82e-04 | 2.85e-03 | 78 |
| GO:005067810 | Oral cavity | OSCC | regulation of epithelial cell proliferation | 180/7305 | 381/18723 | 5.88e-04 | 3.35e-03 | 180 |
| GO:00163315 | Oral cavity | OSCC | morphogenesis of embryonic epithelium | 77/7305 | 147/18723 | 6.63e-04 | 3.72e-03 | 77 |
| Page: 1 2 3 4 |
| Pathway ID | Tissue | Disease Stage | Description | Gene Ratio | Bg Ratio | pvalue | p.adjust | qvalue | Count |
| Page: 1 |
Top |
Cell-cell communication analysis |
| Identification of potential cell-cell interactions between two cell types and their ligand-receptor pairs for different disease states |
| Ligand | Receptor | LRpair | Pathway | Tissue | Disease Stage |
| Page: 1 |
Top |
Single-cell gene regulatory network inference analysis |
| Find out the significant the regulons (TFs) and the target genes of each regulon across cell types for different disease states |
| TF | Cell Type | Tissue | Disease Stage | Target Gene | RSS | Regulon Activity |
| DEAF1 | pDC | Breast | DCIS | CHAF1A,MCM2,GAB1, etc. | 3.15e-02 |  |
| DEAF1 | TFH | Liver | Cirrhotic | CMC1,PSMG2,DCP1B, etc. | 3.35e-01 |  |
| DEAF1 | TFH | Liver | NAFLD | CMC1,PSMG2,DCP1B, etc. | 4.28e-01 |  |
| ∗The dot plots of a searched regulon are shown for all cell subpopulations in each disease state of each tissue based on the regulon specific score inferred using pySCENIC and by calculating the average expression. |
| Page: 1 |
Top |
Somatic mutation of malignant transformation related genes |
| Annotation of somatic variants for genes involved in malignant transformation |
| Hugo Symbol | Variant Class | Variant Classification | dbSNP RS | HGVSc | HGVSp | HGVSp Short | SWISSPROT | BIOTYPE | SIFT | PolyPhen | Tumor Sample Barcode | Tissue | Histology | Sex | Age | Stage | Therapy Types | Drugs | Outcome |
| DEAF1 | SNV | Missense_Mutation | c.1085N>T | p.Ser362Leu | p.S362L | O75398 | protein_coding | deleterious(0) | probably_damaging(0.991) | TCGA-5L-AAT1-01 | Breast | breast invasive carcinoma | Female | <65 | III/IV | Hormone Therapy | letrozol | SD | |
| DEAF1 | SNV | Missense_Mutation | c.634N>T | p.Gly212Cys | p.G212C | O75398 | protein_coding | deleterious(0) | probably_damaging(1) | TCGA-A2-A0EO-01 | Breast | breast invasive carcinoma | Female | <65 | I/II | Hormone Therapy | tamoxiphen | SD | |
| DEAF1 | insertion | Frame_Shift_Ins | novel | c.1413_1414insG | p.Thr472AspfsTer4 | p.T472Dfs*4 | O75398 | protein_coding | TCGA-A2-A0EY-01 | Breast | breast invasive carcinoma | Female | <65 | I/II | Chemotherapy | adriamycin | SD | ||
| DEAF1 | insertion | Frame_Shift_Ins | novel | c.1411_1412insTCTTGGCTAACTGCAACCTCCACTTCCTGGGATCA | p.Lys471IlefsTer54 | p.K471Ifs*54 | O75398 | protein_coding | TCGA-A2-A0EY-01 | Breast | breast invasive carcinoma | Female | <65 | I/II | Chemotherapy | adriamycin | SD | ||
| DEAF1 | insertion | Frame_Shift_Ins | novel | c.308_309insCTTGTGCCTCAGCCTCCTGAGTAGCTGGGATTACA | p.Ala104LeufsTer50 | p.A104Lfs*50 | O75398 | protein_coding | TCGA-A8-A07R-01 | Breast | breast invasive carcinoma | Female | >=65 | III/IV | Ancillary | zoledronic | SD | ||
| DEAF1 | deletion | Frame_Shift_Del | novel | c.907_916delNNNNNNNNNN | p.Lys304MetfsTer8 | p.K304Mfs*8 | O75398 | protein_coding | TCGA-AC-A3W5-01 | Breast | breast invasive carcinoma | Female | >=65 | I/II | Chemotherapy | docetaxel | CR | ||
| DEAF1 | insertion | Frame_Shift_Ins | novel | c.1543_1544insT | p.Cys515LeufsTer43 | p.C515Lfs*43 | O75398 | protein_coding | TCGA-AR-A0TV-01 | Breast | breast invasive carcinoma | Female | >=65 | I/II | Unknown | Unknown | SD | ||
| DEAF1 | insertion | In_Frame_Ins | novel | c.537_538insAGCTACTCG | p.Thr179_Pro180insSerTyrSer | p.T179_P180insSYS | O75398 | protein_coding | TCGA-BH-A0B1-01 | Breast | breast invasive carcinoma | Female | >=65 | I/II | Chemotherapy | adriamycin | SD | ||
| DEAF1 | insertion | Frame_Shift_Ins | novel | c.535_536insGCGTGGTGGCAGGCGCCTGTAGTCCCATAGTC | p.Thr179SerfsTer105 | p.T179Sfs*105 | O75398 | protein_coding | TCGA-BH-A0B1-01 | Breast | breast invasive carcinoma | Female | >=65 | I/II | Chemotherapy | adriamycin | SD | ||
| DEAF1 | SNV | Missense_Mutation | rs868811033 | c.364N>A | p.Ala122Thr | p.A122T | O75398 | protein_coding | tolerated(0.12) | benign(0.012) | TCGA-2W-A8YY-01 | Cervix | cervical & endocervical cancer | Female | <65 | I/II | Chemotherapy | cisplatin | CR |
| Page: 1 2 3 4 5 6 7 |
Top |
Related drugs of malignant transformation related genes |
| Identification of chemicals and drugs interact with genes involved in malignant transfromation |
| (DGIdb 4.0) |
| Entrez ID | Symbol | Category | Interaction Types | Drug Claim Name | Drug Name | PMIDs |
| Page: 1 |

Copyright 2023-Present -The University of Texas Health Science Center at Houston |