
|
|||||
|
 | |
| |
| |
| |
| |
| |
|
Gene: DDX60L |
Gene summary for DDX60L |
| Gene information | Species | Human | Gene symbol | DDX60L | Gene ID | 91351 |
| Gene name | DExD/H-box 60 like | |
| Gene Alias | DDX60L | |
| Cytomap | 4q32.3 | |
| Gene Type | protein-coding | GO ID | GO:0000166 | UniProtAcc | Q5H9U9 |
Top |
Malignant transformation analysis |
| Identification of the aberrant gene expression in precancerous and cancerous lesions by comparing the gene expression of stem-like cells in diseased tissues with normal stem cells |
| Entrez ID | Symbol | Replicates | Species | Organ | Tissue | Adj P-value | Log2FC | Malignancy |
| 91351 | DDX60L | LZE5T | Human | Esophagus | ESCC | 4.88e-05 | 3.27e-01 | 0.0514 |
| 91351 | DDX60L | LZE24T | Human | Esophagus | ESCC | 7.78e-11 | 3.58e-01 | 0.0596 |
| 91351 | DDX60L | P1T-E | Human | Esophagus | ESCC | 1.99e-02 | 3.05e-01 | 0.0875 |
| 91351 | DDX60L | P2T-E | Human | Esophagus | ESCC | 1.25e-26 | 4.84e-01 | 0.1177 |
| 91351 | DDX60L | P4T-E | Human | Esophagus | ESCC | 1.17e-02 | 6.46e-02 | 0.1323 |
| 91351 | DDX60L | P5T-E | Human | Esophagus | ESCC | 1.29e-03 | 1.15e-01 | 0.1327 |
| 91351 | DDX60L | P8T-E | Human | Esophagus | ESCC | 4.23e-09 | 2.07e-01 | 0.0889 |
| 91351 | DDX60L | P9T-E | Human | Esophagus | ESCC | 3.19e-03 | 9.94e-02 | 0.1131 |
| 91351 | DDX60L | P11T-E | Human | Esophagus | ESCC | 5.04e-14 | 5.65e-01 | 0.1426 |
| 91351 | DDX60L | P12T-E | Human | Esophagus | ESCC | 7.74e-04 | 1.15e-01 | 0.1122 |
| 91351 | DDX60L | P15T-E | Human | Esophagus | ESCC | 2.37e-02 | 9.65e-02 | 0.1149 |
| 91351 | DDX60L | P20T-E | Human | Esophagus | ESCC | 5.77e-03 | 1.25e-01 | 0.1124 |
| 91351 | DDX60L | P21T-E | Human | Esophagus | ESCC | 2.84e-06 | 1.77e-01 | 0.1617 |
| 91351 | DDX60L | P23T-E | Human | Esophagus | ESCC | 1.36e-03 | 1.91e-01 | 0.108 |
| 91351 | DDX60L | P24T-E | Human | Esophagus | ESCC | 1.58e-07 | 1.96e-01 | 0.1287 |
| 91351 | DDX60L | P26T-E | Human | Esophagus | ESCC | 9.45e-08 | 1.82e-01 | 0.1276 |
| 91351 | DDX60L | P27T-E | Human | Esophagus | ESCC | 9.20e-03 | 1.26e-01 | 0.1055 |
| 91351 | DDX60L | P28T-E | Human | Esophagus | ESCC | 6.44e-06 | 1.19e-01 | 0.1149 |
| 91351 | DDX60L | P31T-E | Human | Esophagus | ESCC | 1.23e-18 | 3.64e-01 | 0.1251 |
| 91351 | DDX60L | P32T-E | Human | Esophagus | ESCC | 4.34e-06 | 1.65e-01 | 0.1666 |
| Page: 1 2 3 |
| Tissue | Expression Dynamics | Abbreviation |
| Esophagus | 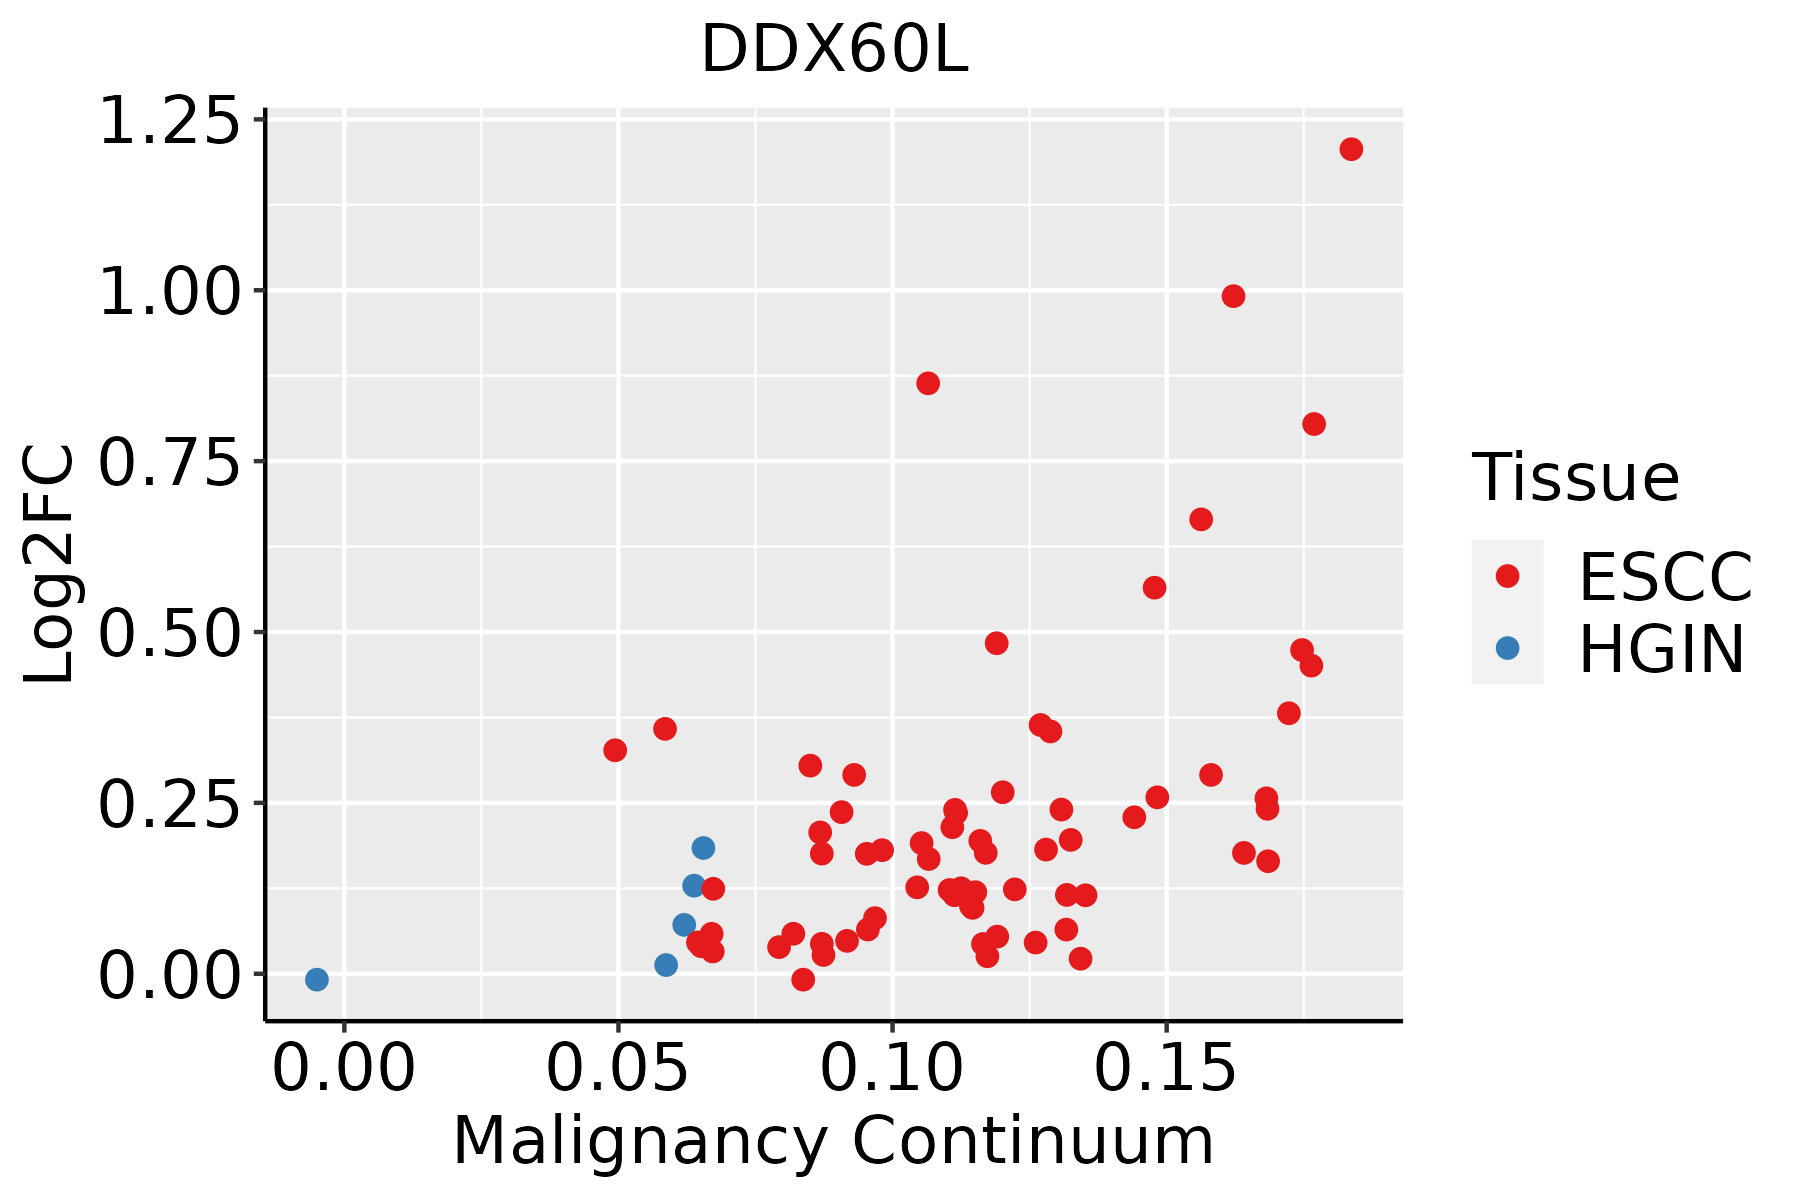 | ESCC: Esophageal squamous cell carcinoma |
| HGIN: High-grade intraepithelial neoplasias | ||
| LGIN: Low-grade intraepithelial neoplasias | ||
| Oral Cavity | 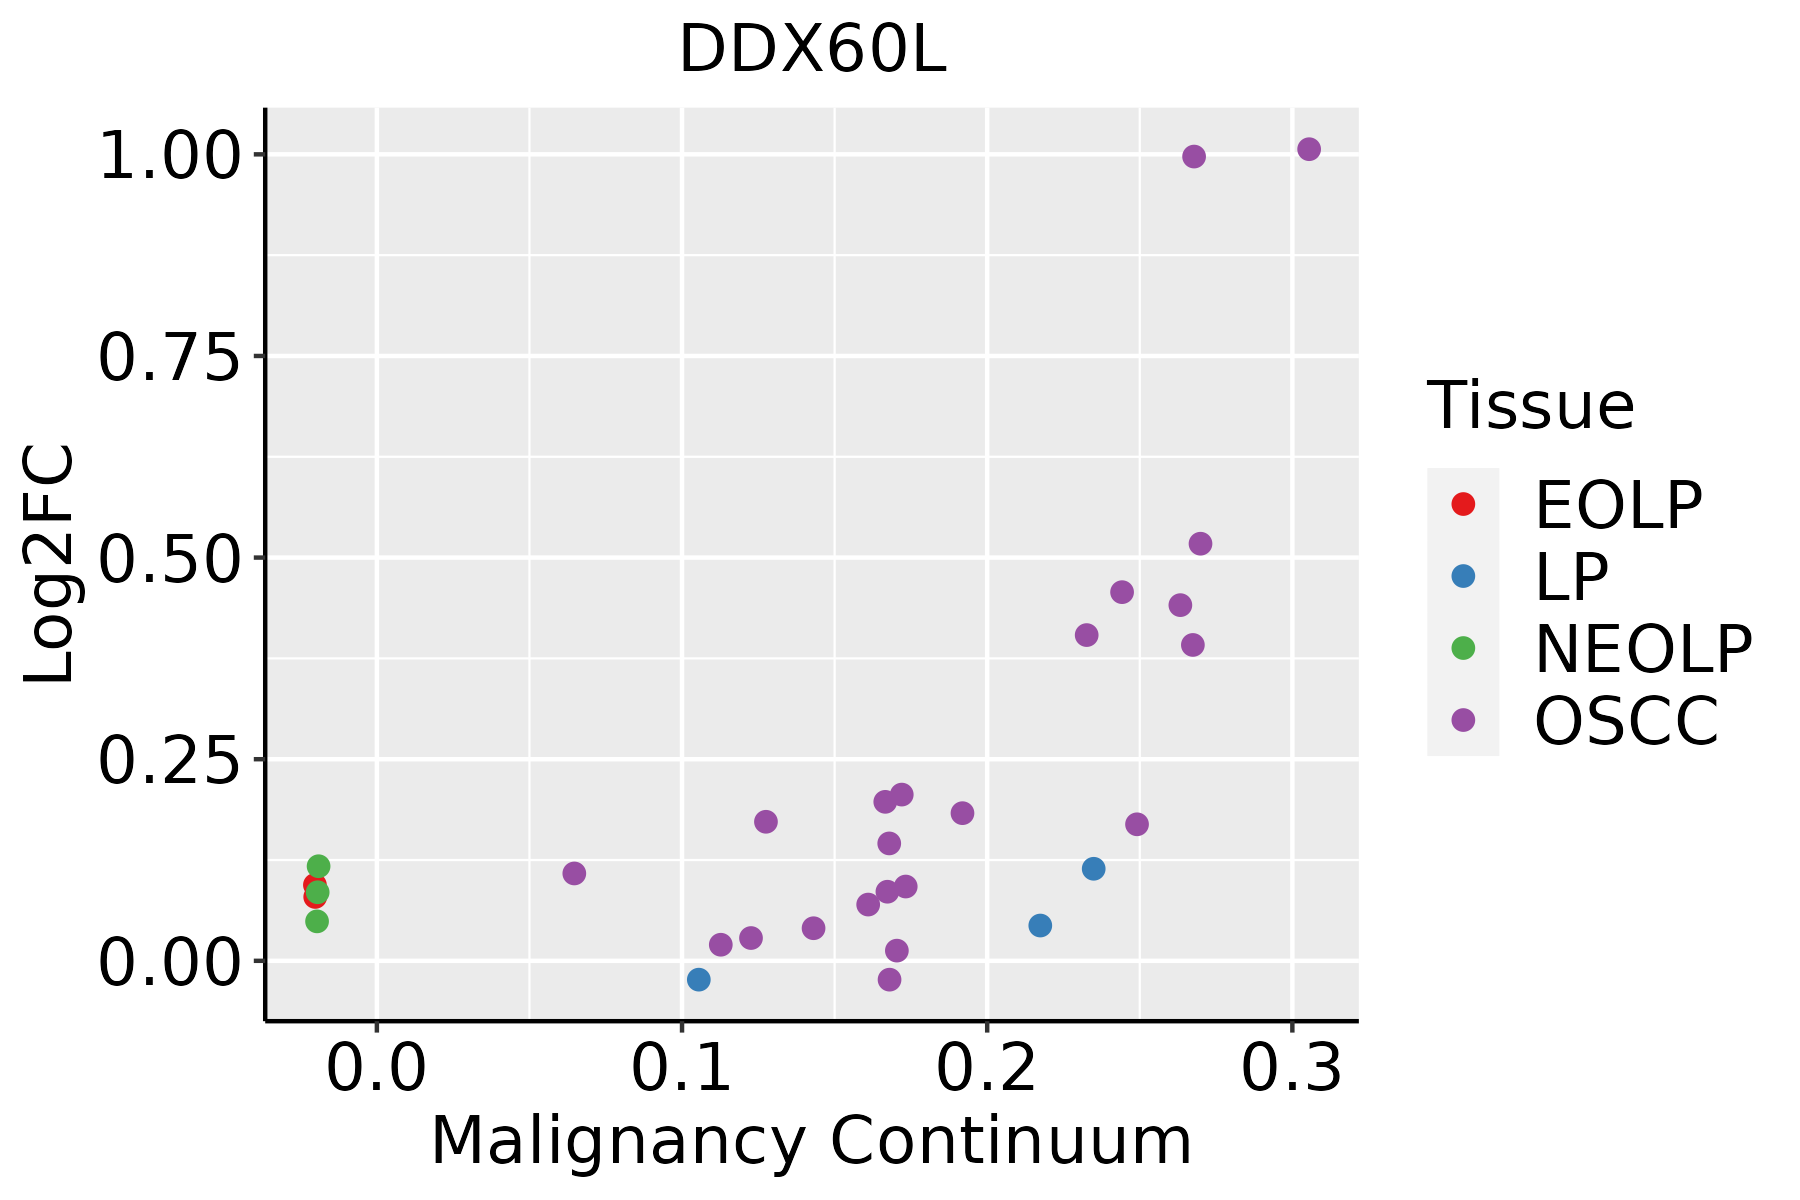 | EOLP: Erosive Oral lichen planus |
| LP: leukoplakia | ||
| NEOLP: Non-erosive oral lichen planus | ||
| OSCC: Oral squamous cell carcinoma |
| ∗log2FC in expression of this searched gene in stem-like cells from each diseased tissue sample relative to stem-like cells in normal samples in each tissue plotted against the malignancy continuum. Samples are colored based on if they are from different disease stage. |
Top |
Malignant transformation related pathway analysis |
| Find out the enriched GO biological processes and KEGG pathways involved in transition from healthy to precancer to cancer |
| Tissue | Disease Stage | Enriched GO biological Processes |
| Colorectum | AD |  |
| Colorectum | SER |  |
| Colorectum | MSS |  |
| Colorectum | MSI-H |  |
| Colorectum | FAP |  |
| ∗Top 15 enriched GO BP terms are showed in the bar plot of each disease state in each tissue. Each row represents a significant GO biological process which is colored according to the -log10(p.adjust). |
| Page: 1 2 3 4 5 6 7 8 9 |
| GO ID | Tissue | Disease Stage | Description | Gene Ratio | Bg Ratio | pvalue | p.adjust | Count |
| Page: 1 |
| Pathway ID | Tissue | Disease Stage | Description | Gene Ratio | Bg Ratio | pvalue | p.adjust | qvalue | Count |
| Page: 1 |
Top |
Cell-cell communication analysis |
| Identification of potential cell-cell interactions between two cell types and their ligand-receptor pairs for different disease states |
| Ligand | Receptor | LRpair | Pathway | Tissue | Disease Stage |
| Page: 1 |
Top |
Single-cell gene regulatory network inference analysis |
| Find out the significant the regulons (TFs) and the target genes of each regulon across cell types for different disease states |
| TF | Cell Type | Tissue | Disease Stage | Target Gene | RSS | Regulon Activity |
| ∗The dot plots of a searched regulon are shown for all cell subpopulations in each disease state of each tissue based on the regulon specific score inferred using pySCENIC and by calculating the average expression. |
| Page: 1 |
Top |
Somatic mutation of malignant transformation related genes |
| Annotation of somatic variants for genes involved in malignant transformation |
| Hugo Symbol | Variant Class | Variant Classification | dbSNP RS | HGVSc | HGVSp | HGVSp Short | SWISSPROT | BIOTYPE | SIFT | PolyPhen | Tumor Sample Barcode | Tissue | Histology | Sex | Age | Stage | Therapy Types | Drugs | Outcome |
| DDX60L | SNV | Missense_Mutation | c.4924A>T | p.Asn1642Tyr | p.N1642Y | Q5H9U9 | protein_coding | deleterious(0) | probably_damaging(0.976) | TCGA-A2-A0T0-01 | Breast | breast invasive carcinoma | Female | <65 | I/II | Chemotherapy | taxotere | SD | |
| DDX60L | SNV | Missense_Mutation | novel | c.4702G>T | p.Val1568Leu | p.V1568L | Q5H9U9 | protein_coding | tolerated(0.27) | benign(0.009) | TCGA-A8-A06R-01 | Breast | breast invasive carcinoma | Female | >=65 | I/II | Chemotherapy | 5-fluorouracil | CR |
| DDX60L | SNV | Missense_Mutation | novel | c.2997N>G | p.Phe999Leu | p.F999L | Q5H9U9 | protein_coding | tolerated(0.23) | benign(0.395) | TCGA-AC-A3W6-01 | Breast | breast invasive carcinoma | Female | >=65 | III/IV | Unknown | Unknown | SD |
| DDX60L | SNV | Missense_Mutation | novel | c.4498G>A | p.Glu1500Lys | p.E1500K | Q5H9U9 | protein_coding | deleterious(0.01) | benign(0.045) | TCGA-AN-A046-01 | Breast | breast invasive carcinoma | Female | >=65 | I/II | Unknown | Unknown | SD |
| DDX60L | SNV | Missense_Mutation | novel | c.3328A>C | p.Ile1110Leu | p.I1110L | Q5H9U9 | protein_coding | tolerated(0.88) | benign(0.003) | TCGA-AN-A046-01 | Breast | breast invasive carcinoma | Female | >=65 | I/II | Unknown | Unknown | SD |
| DDX60L | SNV | Missense_Mutation | novel | c.1278G>T | p.Glu426Asp | p.E426D | Q5H9U9 | protein_coding | tolerated(0.3) | benign(0.001) | TCGA-AN-A046-01 | Breast | breast invasive carcinoma | Female | >=65 | I/II | Unknown | Unknown | SD |
| DDX60L | SNV | Missense_Mutation | rs748422357 | c.1940N>T | p.Ser647Leu | p.S647L | Q5H9U9 | protein_coding | deleterious(0.04) | benign(0.03) | TCGA-AO-A0J3-01 | Breast | breast invasive carcinoma | Female | >=65 | I/II | Chemotherapy | cyclophosphamide | SD |
| DDX60L | SNV | Missense_Mutation | c.3978N>G | p.Ile1326Met | p.I1326M | Q5H9U9 | protein_coding | deleterious(0) | probably_damaging(0.91) | TCGA-AR-A0TS-01 | Breast | breast invasive carcinoma | Female | <65 | I/II | Chemotherapy | doxorubicin | SD | |
| DDX60L | SNV | Missense_Mutation | c.614C>G | p.Thr205Arg | p.T205R | Q5H9U9 | protein_coding | tolerated(0.45) | benign(0) | TCGA-AR-A0TT-01 | Breast | breast invasive carcinoma | Female | <65 | III/IV | Chemotherapy | doxorubicin | SD | |
| DDX60L | SNV | Missense_Mutation | novel | c.4702G>T | p.Val1568Leu | p.V1568L | Q5H9U9 | protein_coding | tolerated(0.27) | benign(0.009) | TCGA-BH-A0BG-01 | Breast | breast invasive carcinoma | Female | >=65 | I/II | Unknown | Unknown | SD |
| Page: 1 2 3 4 5 6 7 8 9 10 11 12 13 14 15 16 17 18 19 |
Top |
Related drugs of malignant transformation related genes |
| Identification of chemicals and drugs interact with genes involved in malignant transfromation |
| (DGIdb 4.0) |
| Entrez ID | Symbol | Category | Interaction Types | Drug Claim Name | Drug Name | PMIDs |
| Page: 1 |

Copyright 2023-Present -The University of Texas Health Science Center at Houston |