
|
|||||
|
 | |
| |
| |
| |
| |
| |
|
Gene: DDX59 |
Gene summary for DDX59 |
| Gene information | Species | Human | Gene symbol | DDX59 | Gene ID | 83479 |
| Gene name | DEAD-box helicase 59 | |
| Gene Alias | OFD5 | |
| Cytomap | 1q32.1 | |
| Gene Type | protein-coding | GO ID | GO:0005575 | UniProtAcc | Q5T1V6 |
Top |
Malignant transformation analysis |
| Identification of the aberrant gene expression in precancerous and cancerous lesions by comparing the gene expression of stem-like cells in diseased tissues with normal stem cells |
| Entrez ID | Symbol | Replicates | Species | Organ | Tissue | Adj P-value | Log2FC | Malignancy |
| 83479 | DDX59 | LZE4T | Human | Esophagus | ESCC | 1.88e-05 | 3.02e-01 | 0.0811 |
| 83479 | DDX59 | LZE8T | Human | Esophagus | ESCC | 9.41e-04 | 1.46e-01 | 0.067 |
| 83479 | DDX59 | LZE24T | Human | Esophagus | ESCC | 1.67e-09 | 2.80e-01 | 0.0596 |
| 83479 | DDX59 | P1T-E | Human | Esophagus | ESCC | 2.01e-08 | 5.27e-01 | 0.0875 |
| 83479 | DDX59 | P2T-E | Human | Esophagus | ESCC | 3.01e-25 | 4.53e-01 | 0.1177 |
| 83479 | DDX59 | P4T-E | Human | Esophagus | ESCC | 2.17e-08 | 2.11e-01 | 0.1323 |
| 83479 | DDX59 | P5T-E | Human | Esophagus | ESCC | 4.22e-08 | 1.35e-01 | 0.1327 |
| 83479 | DDX59 | P8T-E | Human | Esophagus | ESCC | 2.58e-05 | 1.79e-01 | 0.0889 |
| 83479 | DDX59 | P9T-E | Human | Esophagus | ESCC | 1.65e-11 | 3.87e-01 | 0.1131 |
| 83479 | DDX59 | P10T-E | Human | Esophagus | ESCC | 2.82e-21 | 3.75e-01 | 0.116 |
| 83479 | DDX59 | P11T-E | Human | Esophagus | ESCC | 5.31e-12 | 4.95e-01 | 0.1426 |
| 83479 | DDX59 | P12T-E | Human | Esophagus | ESCC | 8.75e-11 | 2.28e-01 | 0.1122 |
| 83479 | DDX59 | P15T-E | Human | Esophagus | ESCC | 1.96e-12 | 3.18e-01 | 0.1149 |
| 83479 | DDX59 | P16T-E | Human | Esophagus | ESCC | 6.78e-22 | 4.10e-01 | 0.1153 |
| 83479 | DDX59 | P17T-E | Human | Esophagus | ESCC | 1.52e-03 | 2.11e-01 | 0.1278 |
| 83479 | DDX59 | P20T-E | Human | Esophagus | ESCC | 3.72e-15 | 4.20e-01 | 0.1124 |
| 83479 | DDX59 | P21T-E | Human | Esophagus | ESCC | 1.35e-15 | 3.09e-01 | 0.1617 |
| 83479 | DDX59 | P22T-E | Human | Esophagus | ESCC | 3.12e-11 | 1.47e-01 | 0.1236 |
| 83479 | DDX59 | P23T-E | Human | Esophagus | ESCC | 1.55e-18 | 5.83e-01 | 0.108 |
| 83479 | DDX59 | P24T-E | Human | Esophagus | ESCC | 6.16e-09 | 1.58e-01 | 0.1287 |
| Page: 1 2 3 4 |
| Tissue | Expression Dynamics | Abbreviation |
| Esophagus | 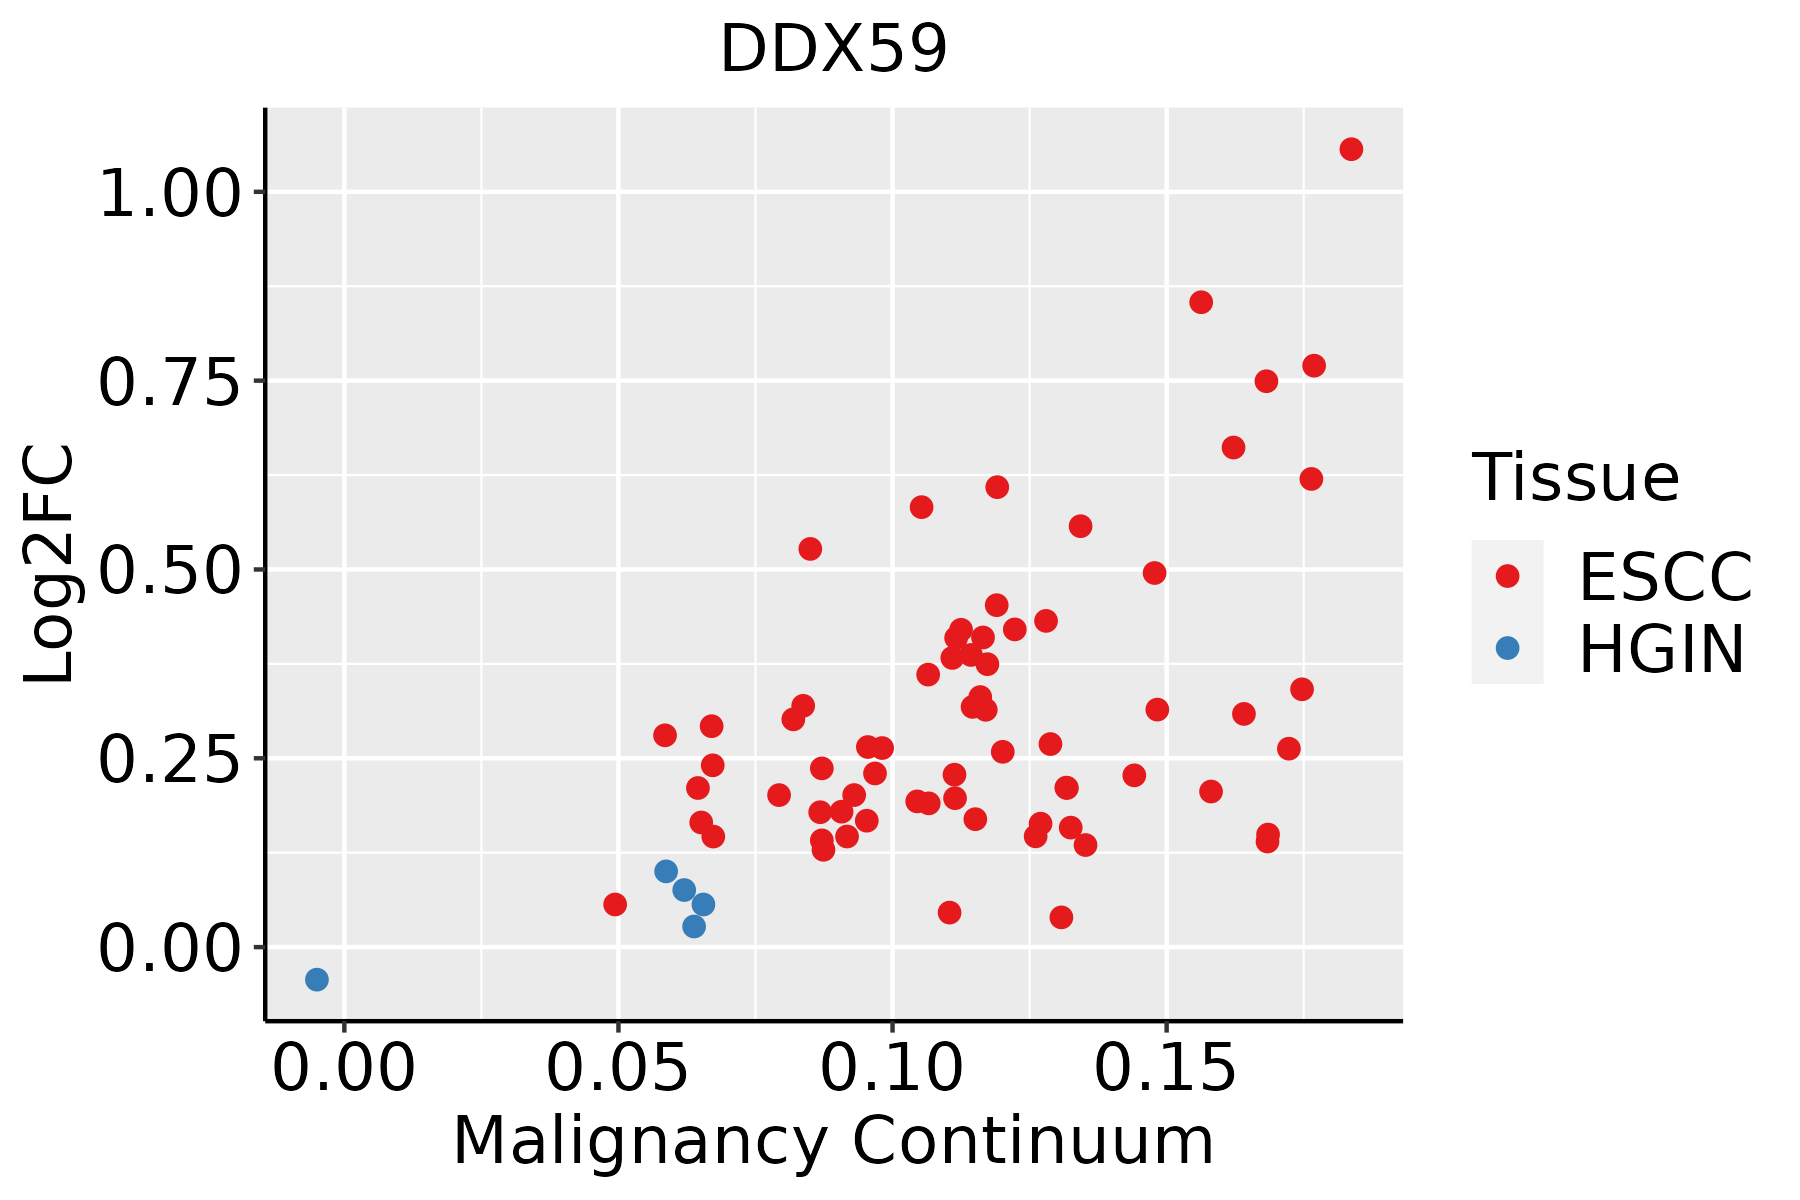 | ESCC: Esophageal squamous cell carcinoma |
| HGIN: High-grade intraepithelial neoplasias | ||
| LGIN: Low-grade intraepithelial neoplasias | ||
| Liver | 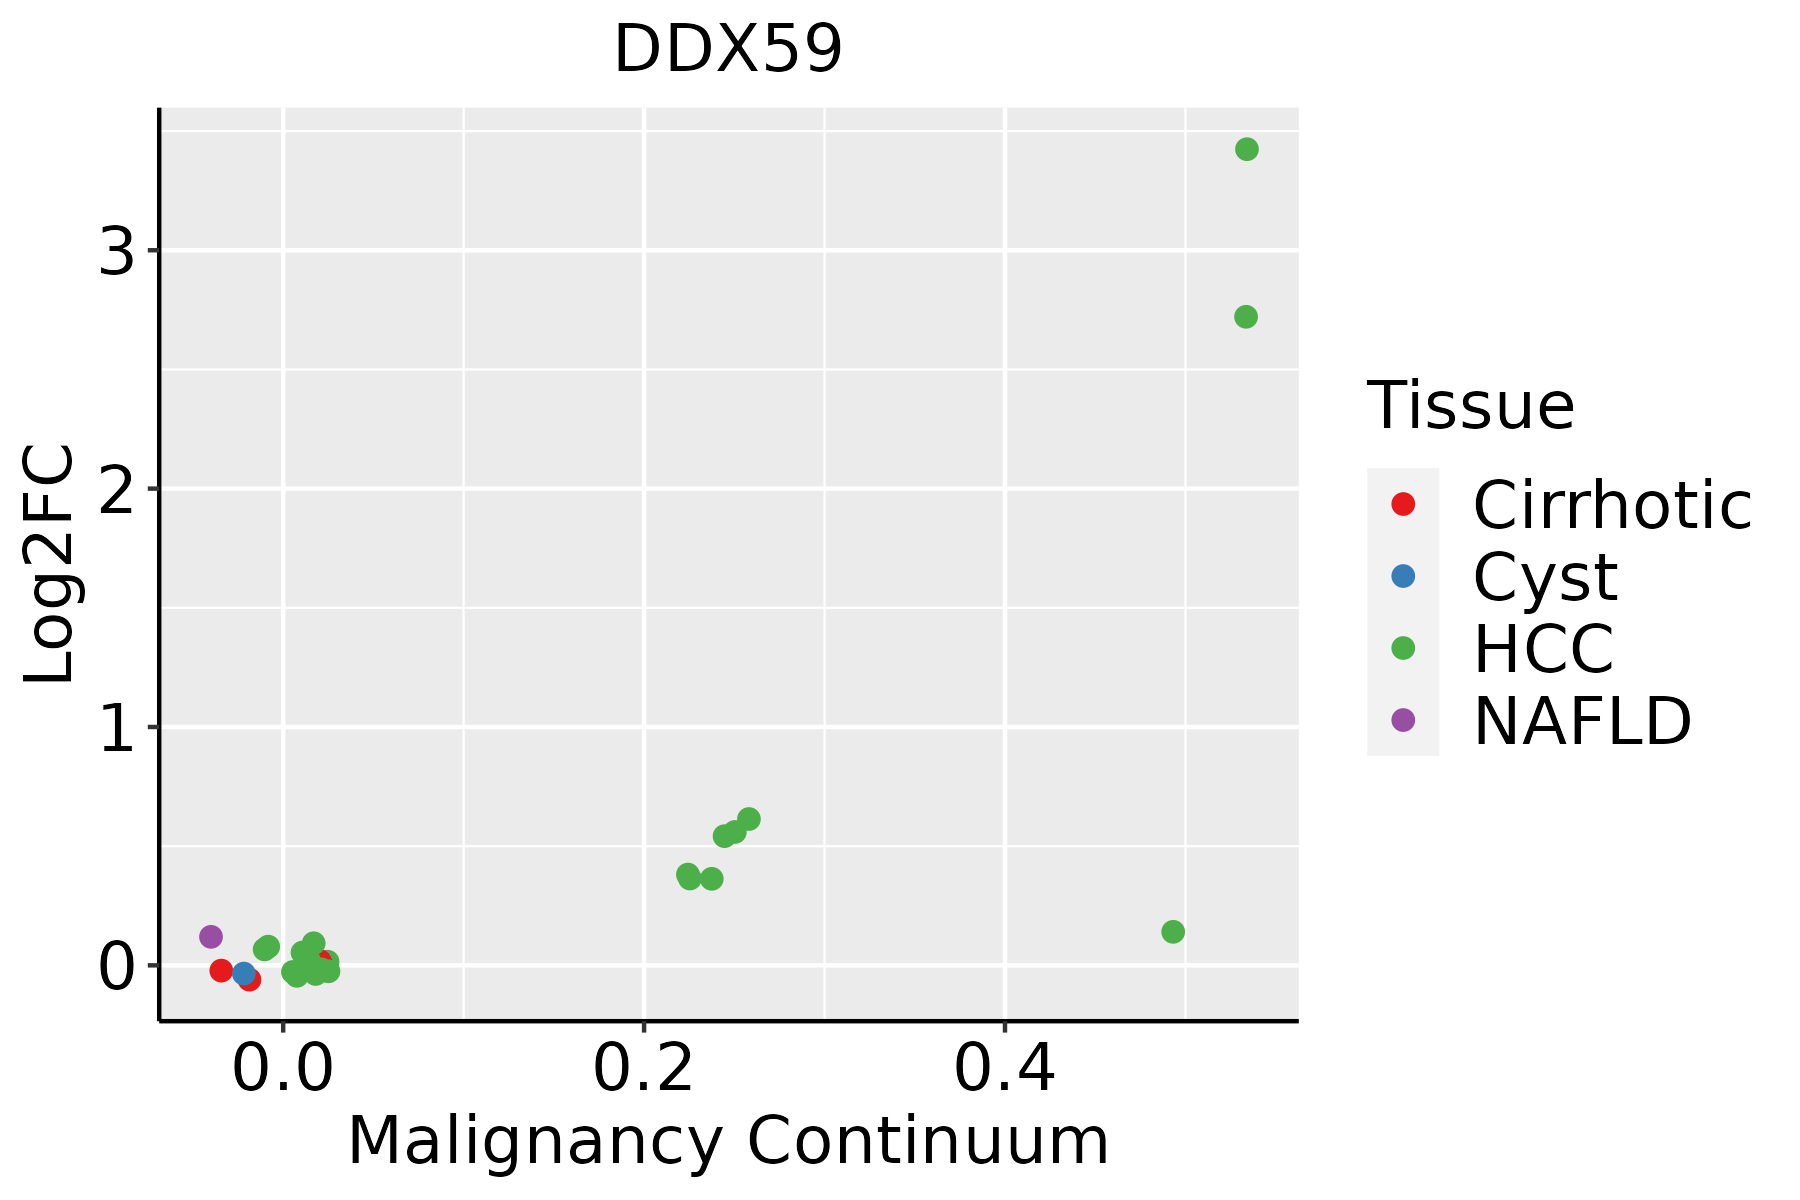 | HCC: Hepatocellular carcinoma |
| NAFLD: Non-alcoholic fatty liver disease |
| ∗log2FC in expression of this searched gene in stem-like cells from each diseased tissue sample relative to stem-like cells in normal samples in each tissue plotted against the malignancy continuum. Samples are colored based on if they are from different disease stage. |
Top |
Malignant transformation related pathway analysis |
| Find out the enriched GO biological processes and KEGG pathways involved in transition from healthy to precancer to cancer |
| Tissue | Disease Stage | Enriched GO biological Processes |
| Colorectum | AD |  |
| Colorectum | SER |  |
| Colorectum | MSS |  |
| Colorectum | MSI-H |  |
| Colorectum | FAP |  |
| ∗Top 15 enriched GO BP terms are showed in the bar plot of each disease state in each tissue. Each row represents a significant GO biological process which is colored according to the -log10(p.adjust). |
| Page: 1 2 3 4 5 6 7 8 9 |
| GO ID | Tissue | Disease Stage | Description | Gene Ratio | Bg Ratio | pvalue | p.adjust | Count |
| Page: 1 |
| Pathway ID | Tissue | Disease Stage | Description | Gene Ratio | Bg Ratio | pvalue | p.adjust | qvalue | Count |
| Page: 1 |
Top |
Cell-cell communication analysis |
| Identification of potential cell-cell interactions between two cell types and their ligand-receptor pairs for different disease states |
| Ligand | Receptor | LRpair | Pathway | Tissue | Disease Stage |
| Page: 1 |
Top |
Single-cell gene regulatory network inference analysis |
| Find out the significant the regulons (TFs) and the target genes of each regulon across cell types for different disease states |
| TF | Cell Type | Tissue | Disease Stage | Target Gene | RSS | Regulon Activity |
| ∗The dot plots of a searched regulon are shown for all cell subpopulations in each disease state of each tissue based on the regulon specific score inferred using pySCENIC and by calculating the average expression. |
| Page: 1 |
Top |
Somatic mutation of malignant transformation related genes |
| Annotation of somatic variants for genes involved in malignant transformation |
| Hugo Symbol | Variant Class | Variant Classification | dbSNP RS | HGVSc | HGVSp | HGVSp Short | SWISSPROT | BIOTYPE | SIFT | PolyPhen | Tumor Sample Barcode | Tissue | Histology | Sex | Age | Stage | Therapy Types | Drugs | Outcome |
| DDX59 | SNV | Missense_Mutation | c.1483G>C | p.Asp495His | p.D495H | Q5T1V6 | protein_coding | deleterious(0) | possibly_damaging(0.868) | TCGA-B6-A0RS-01 | Breast | breast invasive carcinoma | Female | <65 | I/II | Unknown | Unknown | PD | |
| DDX59 | SNV | Missense_Mutation | c.547N>C | p.Glu183Gln | p.E183Q | Q5T1V6 | protein_coding | tolerated(0.26) | benign(0.045) | TCGA-E2-A1IN-01 | Breast | breast invasive carcinoma | Female | <65 | I/II | Hormone Therapy | arimidex | SD | |
| DDX59 | SNV | Missense_Mutation | rs754184314 | c.1372G>A | p.Asp458Asn | p.D458N | Q5T1V6 | protein_coding | deleterious(0) | probably_damaging(0.974) | TCGA-C5-A8XH-01 | Cervix | cervical & endocervical cancer | Female | <65 | I/II | Unknown | Unknown | SD |
| DDX59 | SNV | Missense_Mutation | novel | c.430N>C | p.Glu144Gln | p.E144Q | Q5T1V6 | protein_coding | tolerated(0.44) | benign(0.007) | TCGA-VS-A8EK-01 | Cervix | cervical & endocervical cancer | Female | >=65 | I/II | Chemotherapy | cisplatin | PD |
| DDX59 | SNV | Missense_Mutation | c.1294A>G | p.Lys432Glu | p.K432E | Q5T1V6 | protein_coding | deleterious(0) | possibly_damaging(0.566) | TCGA-A6-5665-01 | Colorectum | colon adenocarcinoma | Female | >=65 | I/II | Unknown | Unknown | PD | |
| DDX59 | SNV | Missense_Mutation | c.660A>C | p.Lys220Asn | p.K220N | Q5T1V6 | protein_coding | tolerated(0.4) | benign(0) | TCGA-AA-3510-01 | Colorectum | colon adenocarcinoma | Male | >=65 | I/II | Unknown | Unknown | SD | |
| DDX59 | SNV | Missense_Mutation | c.479N>A | p.Ser160Tyr | p.S160Y | Q5T1V6 | protein_coding | tolerated(1) | benign(0.129) | TCGA-AD-6895-01 | Colorectum | colon adenocarcinoma | Male | >=65 | III/IV | Unknown | Unknown | SD | |
| DDX59 | SNV | Missense_Mutation | novel | c.1211G>T | p.Arg404Ile | p.R404I | Q5T1V6 | protein_coding | tolerated(0.43) | benign(0.03) | TCGA-AZ-4315-01 | Colorectum | colon adenocarcinoma | Male | <65 | I/II | Unknown | Unknown | SD |
| DDX59 | SNV | Missense_Mutation | c.1230N>T | p.Lys410Asn | p.K410N | Q5T1V6 | protein_coding | tolerated(0.08) | benign(0.209) | TCGA-CA-6717-01 | Colorectum | colon adenocarcinoma | Male | <65 | I/II | Chemotherapy | oxaliplatin | CR | |
| DDX59 | SNV | Missense_Mutation | rs755695604 | c.1795N>A | p.Leu599Met | p.L599M | Q5T1V6 | protein_coding | deleterious_low_confidence(0.04) | possibly_damaging(0.905) | TCGA-D5-6540-01 | Colorectum | colon adenocarcinoma | Male | >=65 | I/II | Unknown | Unknown | SD |
| Page: 1 2 3 4 5 6 7 |
Top |
Related drugs of malignant transformation related genes |
| Identification of chemicals and drugs interact with genes involved in malignant transfromation |
| (DGIdb 4.0) |
| Entrez ID | Symbol | Category | Interaction Types | Drug Claim Name | Drug Name | PMIDs |
| Page: 1 |

Copyright 2023-Present -The University of Texas Health Science Center at Houston |