| Tissue | Expression Dynamics | Abbreviation |
| Cervix |  | CC: Cervix cancer |
| HSIL_HPV: HPV-infected high-grade squamous intraepithelial lesions |
| N_HPV: HPV-infected normal cervix |
| Colorectum (GSE201348) |  | FAP: Familial adenomatous polyposis |
| CRC: Colorectal cancer |
| Colorectum (HTA11) |  | AD: Adenomas |
| SER: Sessile serrated lesions |
| MSI-H: Microsatellite-high colorectal cancer |
| MSS: Microsatellite stable colorectal cancer |
| Esophagus | 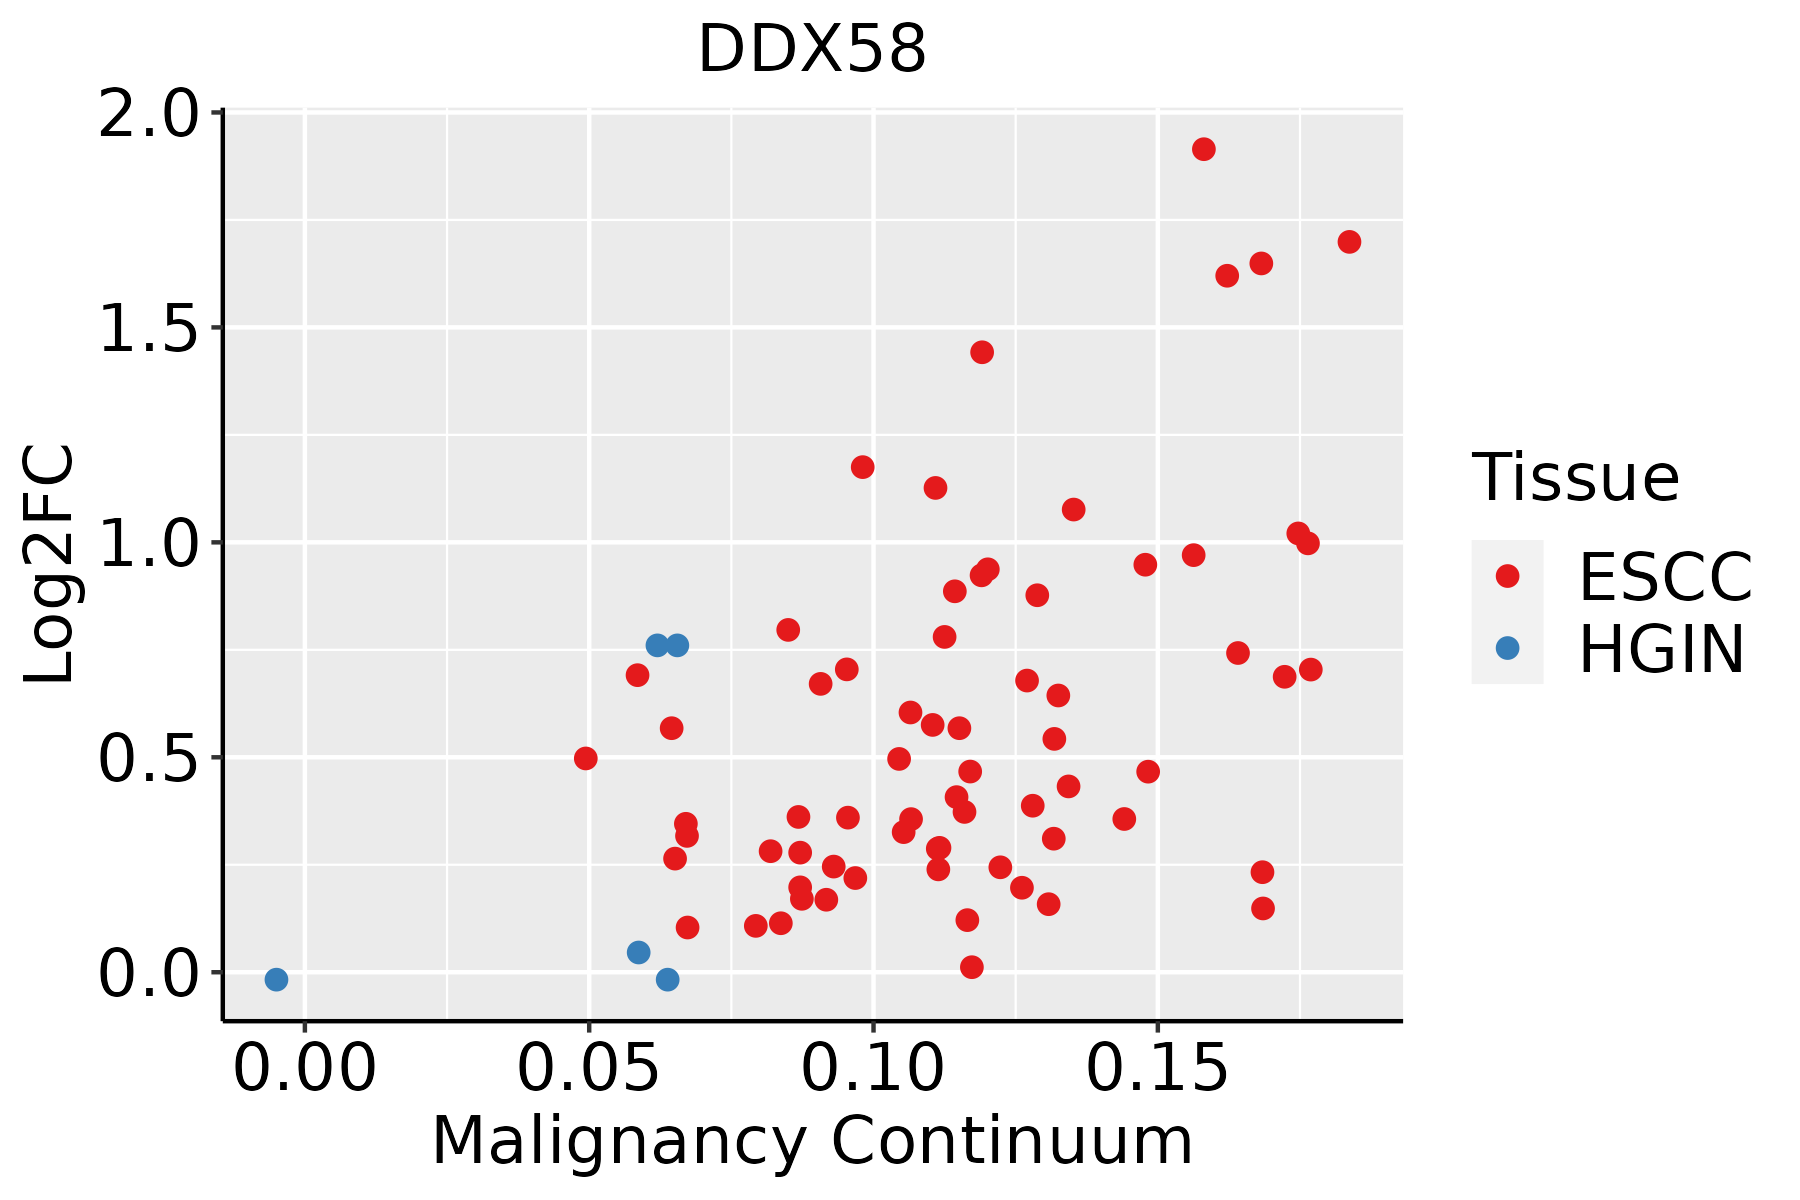 | ESCC: Esophageal squamous cell carcinoma |
| HGIN: High-grade intraepithelial neoplasias |
| LGIN: Low-grade intraepithelial neoplasias |
| Liver |  | HCC: Hepatocellular carcinoma |
| NAFLD: Non-alcoholic fatty liver disease |
| Oral Cavity | 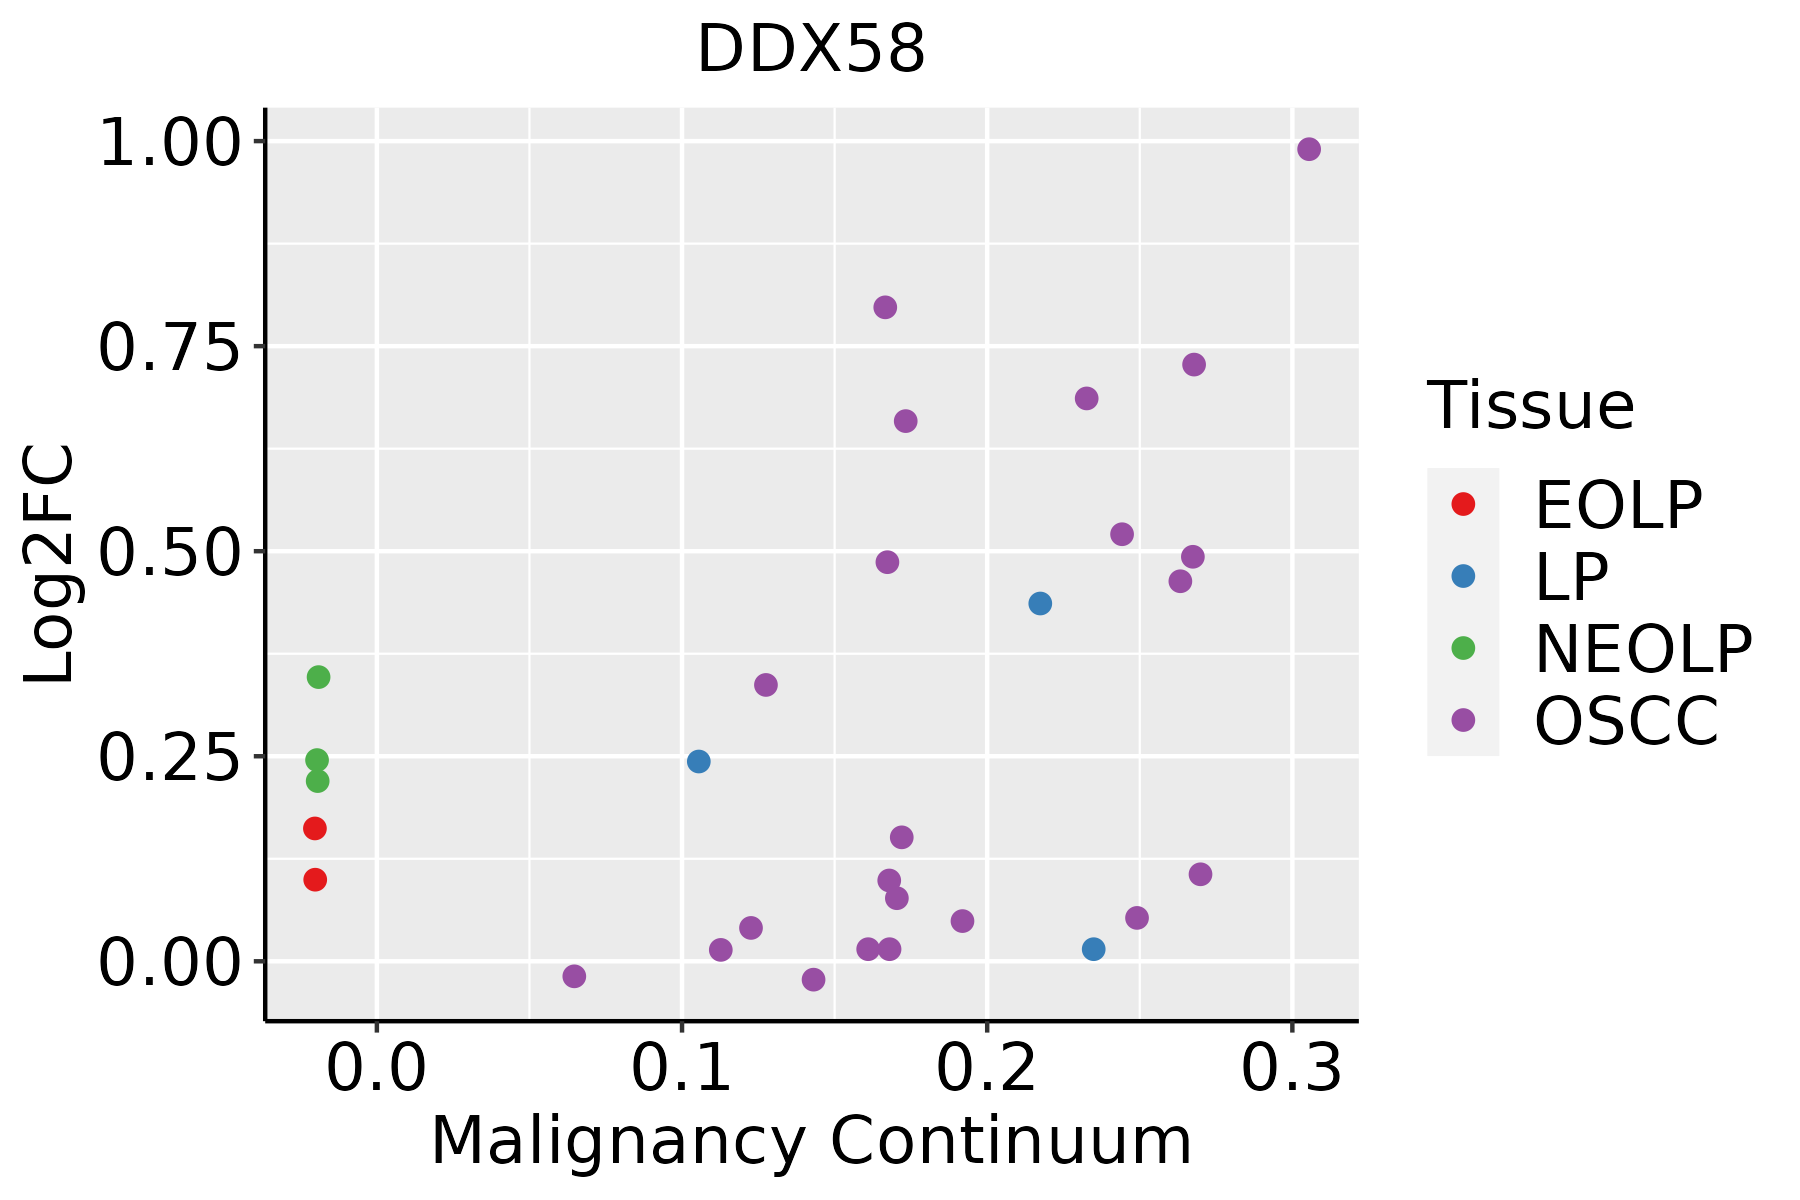 | EOLP: Erosive Oral lichen planus |
| LP: leukoplakia |
| NEOLP: Non-erosive oral lichen planus |
| OSCC: Oral squamous cell carcinoma |
| Skin | 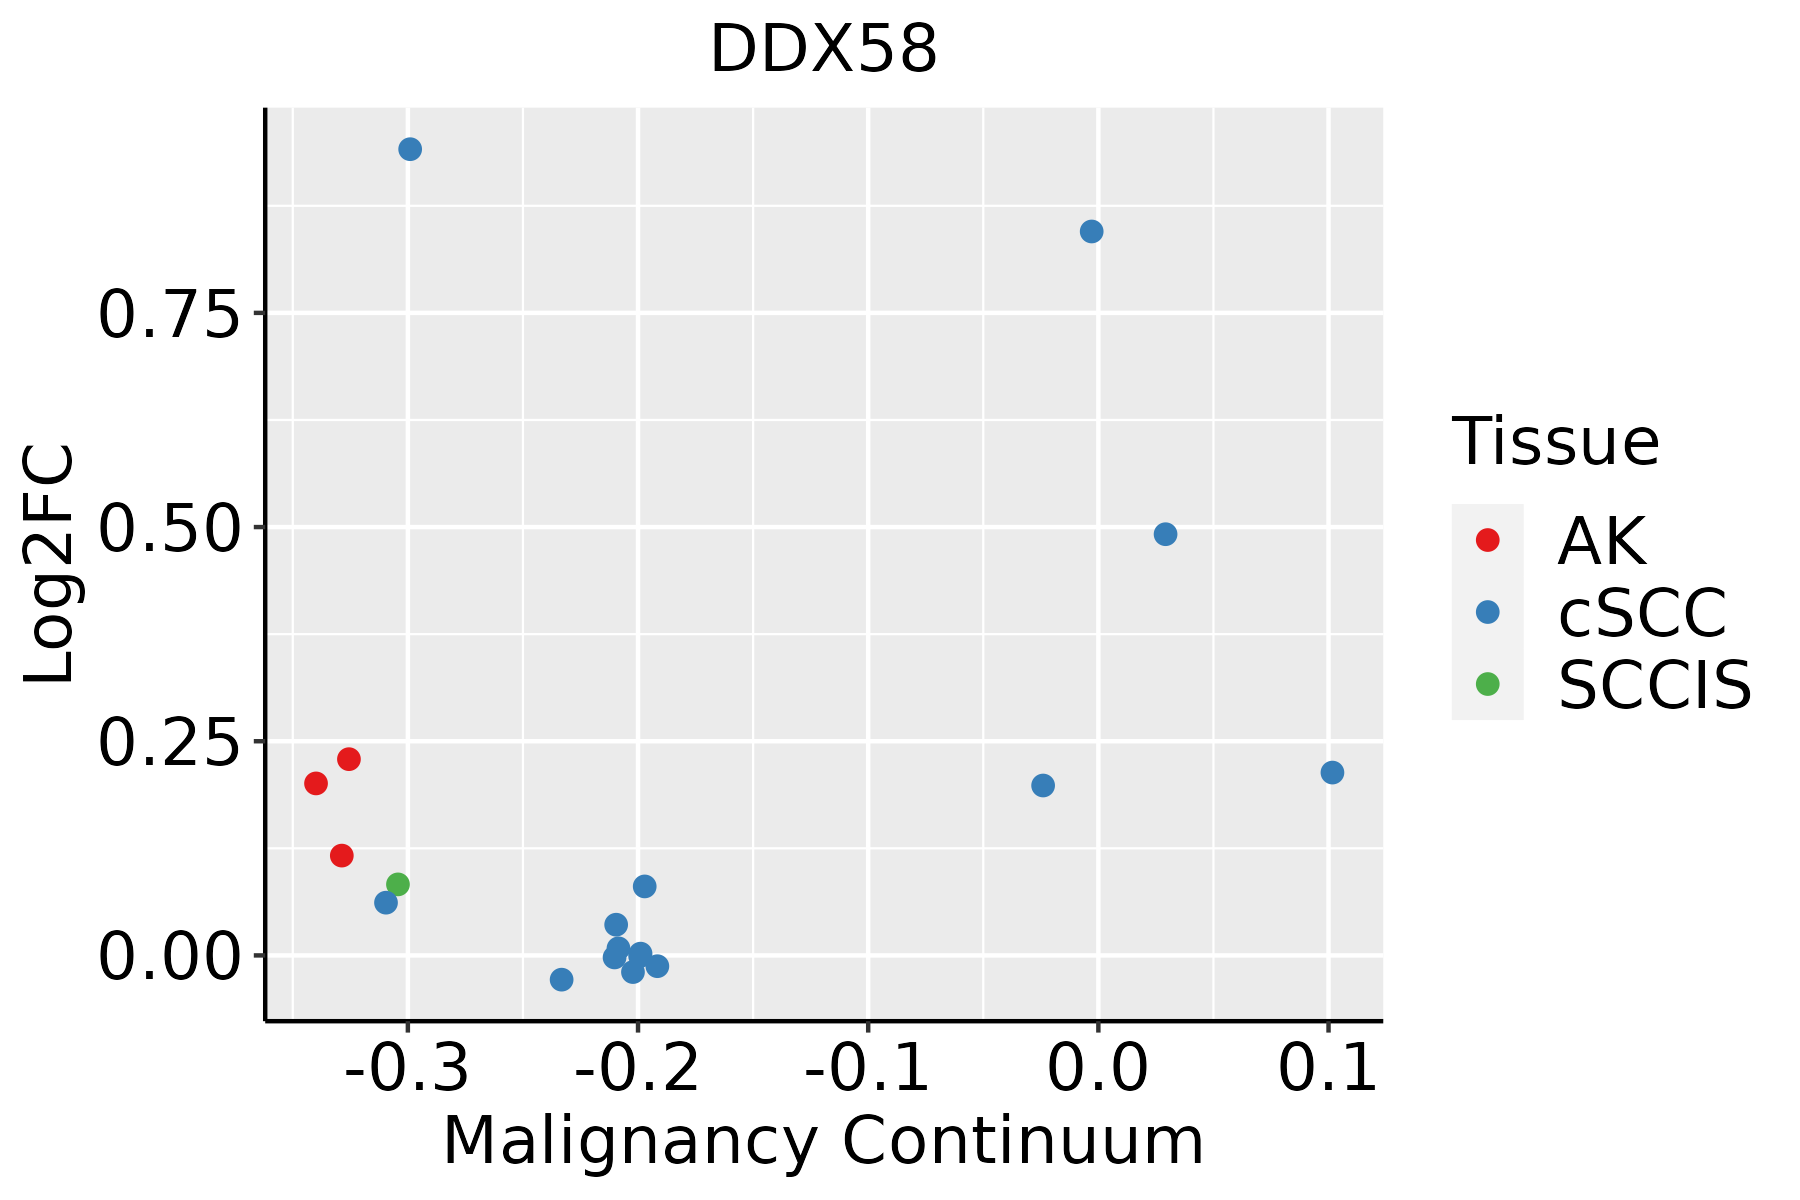 | AK: Actinic keratosis |
| cSCC: Cutaneous squamous cell carcinoma |
| SCCIS:squamous cell carcinoma in situ |
| Thyroid |  | ATC: Anaplastic thyroid cancer |
| HT: Hashimoto's thyroiditis |
| PTC: Papillary thyroid cancer |
| GO ID | Tissue | Disease Stage | Description | Gene Ratio | Bg Ratio | pvalue | p.adjust | Count |
| GO:00027644 | Cervix | CC | immune response-regulating signaling pathway | 97/2311 | 468/18723 | 1.49e-07 | 7.07e-06 | 97 |
| GO:00018197 | Cervix | CC | positive regulation of cytokine production | 95/2311 | 467/18723 | 4.88e-07 | 1.85e-05 | 95 |
| GO:00305229 | Cervix | CC | intracellular receptor signaling pathway | 60/2311 | 265/18723 | 1.89e-06 | 5.97e-05 | 60 |
| GO:00510904 | Cervix | CC | regulation of DNA-binding transcription factor activity | 87/2311 | 440/18723 | 4.85e-06 | 1.22e-04 | 87 |
| GO:00028315 | Cervix | CC | regulation of response to biotic stimulus | 67/2311 | 327/18723 | 1.79e-05 | 3.36e-04 | 67 |
| GO:00096158 | Cervix | CC | response to virus | 73/2311 | 367/18723 | 2.22e-05 | 3.95e-04 | 73 |
| GO:00022212 | Cervix | CC | pattern recognition receptor signaling pathway | 39/2311 | 172/18723 | 1.08e-04 | 1.38e-03 | 39 |
| GO:00027534 | Cervix | CC | cytoplasmic pattern recognition receptor signaling pathway | 18/2311 | 60/18723 | 2.26e-04 | 2.55e-03 | 18 |
| GO:00510915 | Cervix | CC | positive regulation of DNA-binding transcription factor activity | 51/2311 | 260/18723 | 5.05e-04 | 4.92e-03 | 51 |
| GO:00395292 | Cervix | CC | RIG-I signaling pathway | 10/2311 | 27/18723 | 9.25e-04 | 7.84e-03 | 10 |
| GO:00026973 | Cervix | CC | regulation of immune effector process | 62/2311 | 339/18723 | 9.25e-04 | 7.84e-03 | 62 |
| GO:00027201 | Cervix | CC | positive regulation of cytokine production involved in immune response | 17/2311 | 65/18723 | 1.84e-03 | 1.37e-02 | 17 |
| GO:00985863 | Cervix | CC | cellular response to virus | 20/2311 | 84/18723 | 2.62e-03 | 1.81e-02 | 20 |
| GO:0002443 | Cervix | CC | leukocyte mediated immunity | 73/2311 | 440/18723 | 5.01e-03 | 2.98e-02 | 73 |
| GO:0002699 | Cervix | CC | positive regulation of immune effector process | 43/2311 | 235/18723 | 5.13e-03 | 3.02e-02 | 43 |
| GO:00324791 | Cervix | CC | regulation of type I interferon production | 21/2311 | 95/18723 | 5.32e-03 | 3.10e-02 | 21 |
| GO:00326061 | Cervix | CC | type I interferon production | 21/2311 | 95/18723 | 5.32e-03 | 3.10e-02 | 21 |
| GO:00395281 | Cervix | CC | cytoplasmic pattern recognition receptor signaling pathway in response to virus | 10/2311 | 34/18723 | 6.40e-03 | 3.58e-02 | 10 |
| GO:00607602 | Cervix | CC | positive regulation of response to cytokine stimulus | 14/2311 | 57/18723 | 8.17e-03 | 4.25e-02 | 14 |
| GO:00324815 | Cervix | CC | positive regulation of type I interferon production | 14/2311 | 58/18723 | 9.57e-03 | 4.73e-02 | 14 |
| Pathway ID | Tissue | Disease Stage | Description | Gene Ratio | Bg Ratio | pvalue | p.adjust | qvalue | Count |
| hsa0517120 | Cervix | CC | Coronavirus disease - COVID-19 | 111/1267 | 232/8465 | 1.82e-33 | 5.90e-31 | 3.49e-31 | 111 |
| hsa0516920 | Cervix | CC | Epstein-Barr virus infection | 57/1267 | 202/8465 | 7.30e-07 | 7.39e-06 | 4.37e-06 | 57 |
| hsa0516414 | Cervix | CC | Influenza A | 43/1267 | 171/8465 | 3.03e-04 | 1.64e-03 | 9.68e-04 | 43 |
| hsa05171110 | Cervix | CC | Coronavirus disease - COVID-19 | 111/1267 | 232/8465 | 1.82e-33 | 5.90e-31 | 3.49e-31 | 111 |
| hsa05169110 | Cervix | CC | Epstein-Barr virus infection | 57/1267 | 202/8465 | 7.30e-07 | 7.39e-06 | 4.37e-06 | 57 |
| hsa0516415 | Cervix | CC | Influenza A | 43/1267 | 171/8465 | 3.03e-04 | 1.64e-03 | 9.68e-04 | 43 |
| hsa05171 | Colorectum | AD | Coronavirus disease - COVID-19 | 113/2092 | 232/8465 | 9.90e-16 | 2.55e-14 | 1.63e-14 | 113 |
| hsa05160 | Colorectum | AD | Hepatitis C | 54/2092 | 157/8465 | 3.87e-03 | 1.96e-02 | 1.25e-02 | 54 |
| hsa051711 | Colorectum | AD | Coronavirus disease - COVID-19 | 113/2092 | 232/8465 | 9.90e-16 | 2.55e-14 | 1.63e-14 | 113 |
| hsa051601 | Colorectum | AD | Hepatitis C | 54/2092 | 157/8465 | 3.87e-03 | 1.96e-02 | 1.25e-02 | 54 |
| hsa051714 | Colorectum | MSS | Coronavirus disease - COVID-19 | 108/1875 | 232/8465 | 6.50e-17 | 1.67e-15 | 1.03e-15 | 108 |
| hsa051602 | Colorectum | MSS | Hepatitis C | 52/1875 | 157/8465 | 9.29e-04 | 5.58e-03 | 3.42e-03 | 52 |
| hsa05169 | Colorectum | MSS | Epstein-Barr virus infection | 63/1875 | 202/8465 | 1.63e-03 | 8.98e-03 | 5.50e-03 | 63 |
| hsa05161 | Colorectum | MSS | Hepatitis B | 48/1875 | 162/8465 | 1.53e-02 | 4.93e-02 | 3.02e-02 | 48 |
| hsa051715 | Colorectum | MSS | Coronavirus disease - COVID-19 | 108/1875 | 232/8465 | 6.50e-17 | 1.67e-15 | 1.03e-15 | 108 |
| hsa051603 | Colorectum | MSS | Hepatitis C | 52/1875 | 157/8465 | 9.29e-04 | 5.58e-03 | 3.42e-03 | 52 |
| hsa051691 | Colorectum | MSS | Epstein-Barr virus infection | 63/1875 | 202/8465 | 1.63e-03 | 8.98e-03 | 5.50e-03 | 63 |
| hsa051611 | Colorectum | MSS | Hepatitis B | 48/1875 | 162/8465 | 1.53e-02 | 4.93e-02 | 3.02e-02 | 48 |
| hsa051716 | Colorectum | MSI-H | Coronavirus disease - COVID-19 | 91/797 | 232/8465 | 2.21e-35 | 3.58e-33 | 3.00e-33 | 91 |
| hsa051717 | Colorectum | MSI-H | Coronavirus disease - COVID-19 | 91/797 | 232/8465 | 2.21e-35 | 3.58e-33 | 3.00e-33 | 91 |
| Hugo Symbol | Variant Class | Variant Classification | dbSNP RS | HGVSc | HGVSp | HGVSp Short | SWISSPROT | BIOTYPE | SIFT | PolyPhen | Tumor Sample Barcode | Tissue | Histology | Sex | Age | Stage | Therapy Types | Drugs | Outcome |
| DDX58 | SNV | Missense_Mutation | | c.2549N>A | p.Pro850Gln | p.P850Q | O95786 | protein_coding | deleterious(0.02) | possibly_damaging(0.596) | TCGA-A2-A25A-01 | Breast | breast invasive carcinoma | Female | <65 | I/II | Unspecific | Cytoxan | SD |
| DDX58 | SNV | Missense_Mutation | | c.2356N>T | p.His786Tyr | p.H786Y | O95786 | protein_coding | deleterious(0.01) | benign(0.063) | TCGA-A2-A25D-01 | Breast | breast invasive carcinoma | Female | >=65 | III/IV | Hormone Therapy | tamoxiphen | SD |
| DDX58 | SNV | Missense_Mutation | novel | c.2251N>A | p.Glu751Lys | p.E751K | O95786 | protein_coding | deleterious(0) | probably_damaging(0.987) | TCGA-AC-A2QI-01 | Breast | breast invasive carcinoma | Female | >=65 | III/IV | Chemotherapy | cytoxan | CR |
| DDX58 | SNV | Missense_Mutation | | c.1313N>C | p.Val438Ala | p.V438A | O95786 | protein_coding | tolerated(0.28) | benign(0.031) | TCGA-D8-A1XK-01 | Breast | breast invasive carcinoma | Female | <65 | I/II | Chemotherapy | doxorubicine+cyclophosphamide | SD |
| DDX58 | insertion | Frame_Shift_Ins | novel | c.2532_2533insCCCTGGGCTTCTCTCTCTTCTAGTTCTATTCTAGTCTTTTTTTA | p.Arg845ProfsTer15 | p.R845Pfs*15 | O95786 | protein_coding | | | TCGA-A2-A0EY-01 | Breast | breast invasive carcinoma | Female | <65 | I/II | Chemotherapy | adriamycin | SD |
| DDX58 | deletion | Frame_Shift_Del | novel | c.2560delN | p.Ser854GlnfsTer24 | p.S854Qfs*24 | O95786 | protein_coding | | | TCGA-D8-A27V-01 | Breast | breast invasive carcinoma | Female | <65 | I/II | Hormone Therapy | tamoxiphen | SD |
| DDX58 | SNV | Missense_Mutation | novel | c.1047N>T | p.Gln349His | p.Q349H | O95786 | protein_coding | deleterious(0.05) | probably_damaging(0.999) | TCGA-2W-A8YY-01 | Cervix | cervical & endocervical cancer | Female | <65 | I/II | Chemotherapy | cisplatin | CR |
| DDX58 | SNV | Missense_Mutation | novel | c.2245N>C | p.Glu749Gln | p.E749Q | O95786 | protein_coding | deleterious(0.02) | benign(0.235) | TCGA-HM-A4S6-01 | Cervix | cervical & endocervical cancer | Female | <65 | III/IV | Chemotherapy | cisplatin | CR |
| DDX58 | SNV | Missense_Mutation | | c.1447G>A | p.Glu483Lys | p.E483K | O95786 | protein_coding | deleterious(0) | probably_damaging(0.992) | TCGA-JW-A5VJ-01 | Cervix | cervical & endocervical cancer | Female | <65 | I/II | Unknown | Unknown | PD |
| DDX58 | SNV | Missense_Mutation | novel | c.63N>G | p.Asp21Glu | p.D21E | O95786 | protein_coding | tolerated(0.14) | benign(0.23) | TCGA-MA-AA42-01 | Cervix | cervical & endocervical cancer | Female | >=65 | I/II | Unknown | Unknown | SD |


