Schematic overview of the cellular and molecular mechanisms involved in the cancer progression, including the proposed cellular and molecular mechanisms in cancer cells trajectory. AT1: alveolar type 1 cells; AT2: alveolar type 2 cells; AAH: atypical adenomatous hyperplasia; AIS: adenocarcinoma in situ; MIA: minimally invasive adenocarcinoma; IA: invasive adenocarcinoma; EMT: epithelial-mesenchymal transition

Home

Download

Statistics

Help

Contact

Center for Computational Systems Medicine
leaf

Gene summary

leaf

Malignant transformation analysis

leaf

Malignant transformation related pathway analysis

leaf

Cell-cell communication analysis

leaf

Single-cell gene regulatory network inference analysis

leaf

Somatic mutation of malignant transformation related genes

leaf

Related drugs of malignant transformation related genes

Gene: DDX49

Gene summary for DDX49

check button Gene summary.

Gene informationSpeciesHuman
Gene symbol

DDX49

Gene ID

54555

Gene nameDEAD-box helicase 49
Gene AliasDbp8
Cytomap19p13.11
Gene Typeprotein-coding
GO ID

GO:0001558

UniProtAcc

Q9Y6V7


Top

Malignant transformation analysis

check button Identification of the aberrant gene expression in precancerous and cancerous lesions by comparing the gene expression of stem-like cells in diseased tissues with normal stem cells
check button Malignant transformation involving gene list.
Entrez IDSymbolReplicatesSpeciesOrganTissueAdj P-valueLog2FCMalignancy
54555DDX49LZE4THumanEsophagusESCC7.08e-052.76e-010.0811
54555DDX49LZE7THumanEsophagusESCC1.13e-188.85e-010.0667
54555DDX49LZE8THumanEsophagusESCC1.71e-021.39e-010.067
54555DDX49LZE20THumanEsophagusESCC5.15e-062.31e-010.0662
54555DDX49LZE22D1HumanEsophagusHGIN1.68e-031.69e-010.0595
54555DDX49LZE24THumanEsophagusESCC2.71e-154.72e-010.0596
54555DDX49LZE21THumanEsophagusESCC1.46e-063.99e-010.0655
54555DDX49LZE6THumanEsophagusESCC5.19e-053.04e-010.0845
54555DDX49P1T-EHumanEsophagusESCC9.17e-135.05e-010.0875
54555DDX49P2T-EHumanEsophagusESCC3.61e-203.65e-010.1177
54555DDX49P4T-EHumanEsophagusESCC5.05e-205.98e-010.1323
54555DDX49P5T-EHumanEsophagusESCC3.20e-255.50e-010.1327
54555DDX49P8T-EHumanEsophagusESCC6.42e-347.25e-010.0889
54555DDX49P9T-EHumanEsophagusESCC3.54e-285.51e-010.1131
54555DDX49P10T-EHumanEsophagusESCC2.55e-447.87e-010.116
54555DDX49P11T-EHumanEsophagusESCC3.14e-186.86e-010.1426
54555DDX49P12T-EHumanEsophagusESCC2.11e-234.27e-010.1122
54555DDX49P15T-EHumanEsophagusESCC2.12e-214.35e-010.1149
54555DDX49P16T-EHumanEsophagusESCC9.75e-193.86e-010.1153
54555DDX49P17T-EHumanEsophagusESCC1.50e-177.83e-010.1278
Page: 1 2 3 4 5 6 

check button Transcriptomic changes along malignancy continuum.
TissueExpression DynamicsAbbreviation
EsophagusThe image shows the transcriptomic changes along malignancy continuum.log2FC in expression of this searched gene in stem-like cells from each diseased tissue sample relative to stem-like cells in normal samples in each tissue plotted against the malignancy continuum. Samples are colored based on if they are from different disease stage.
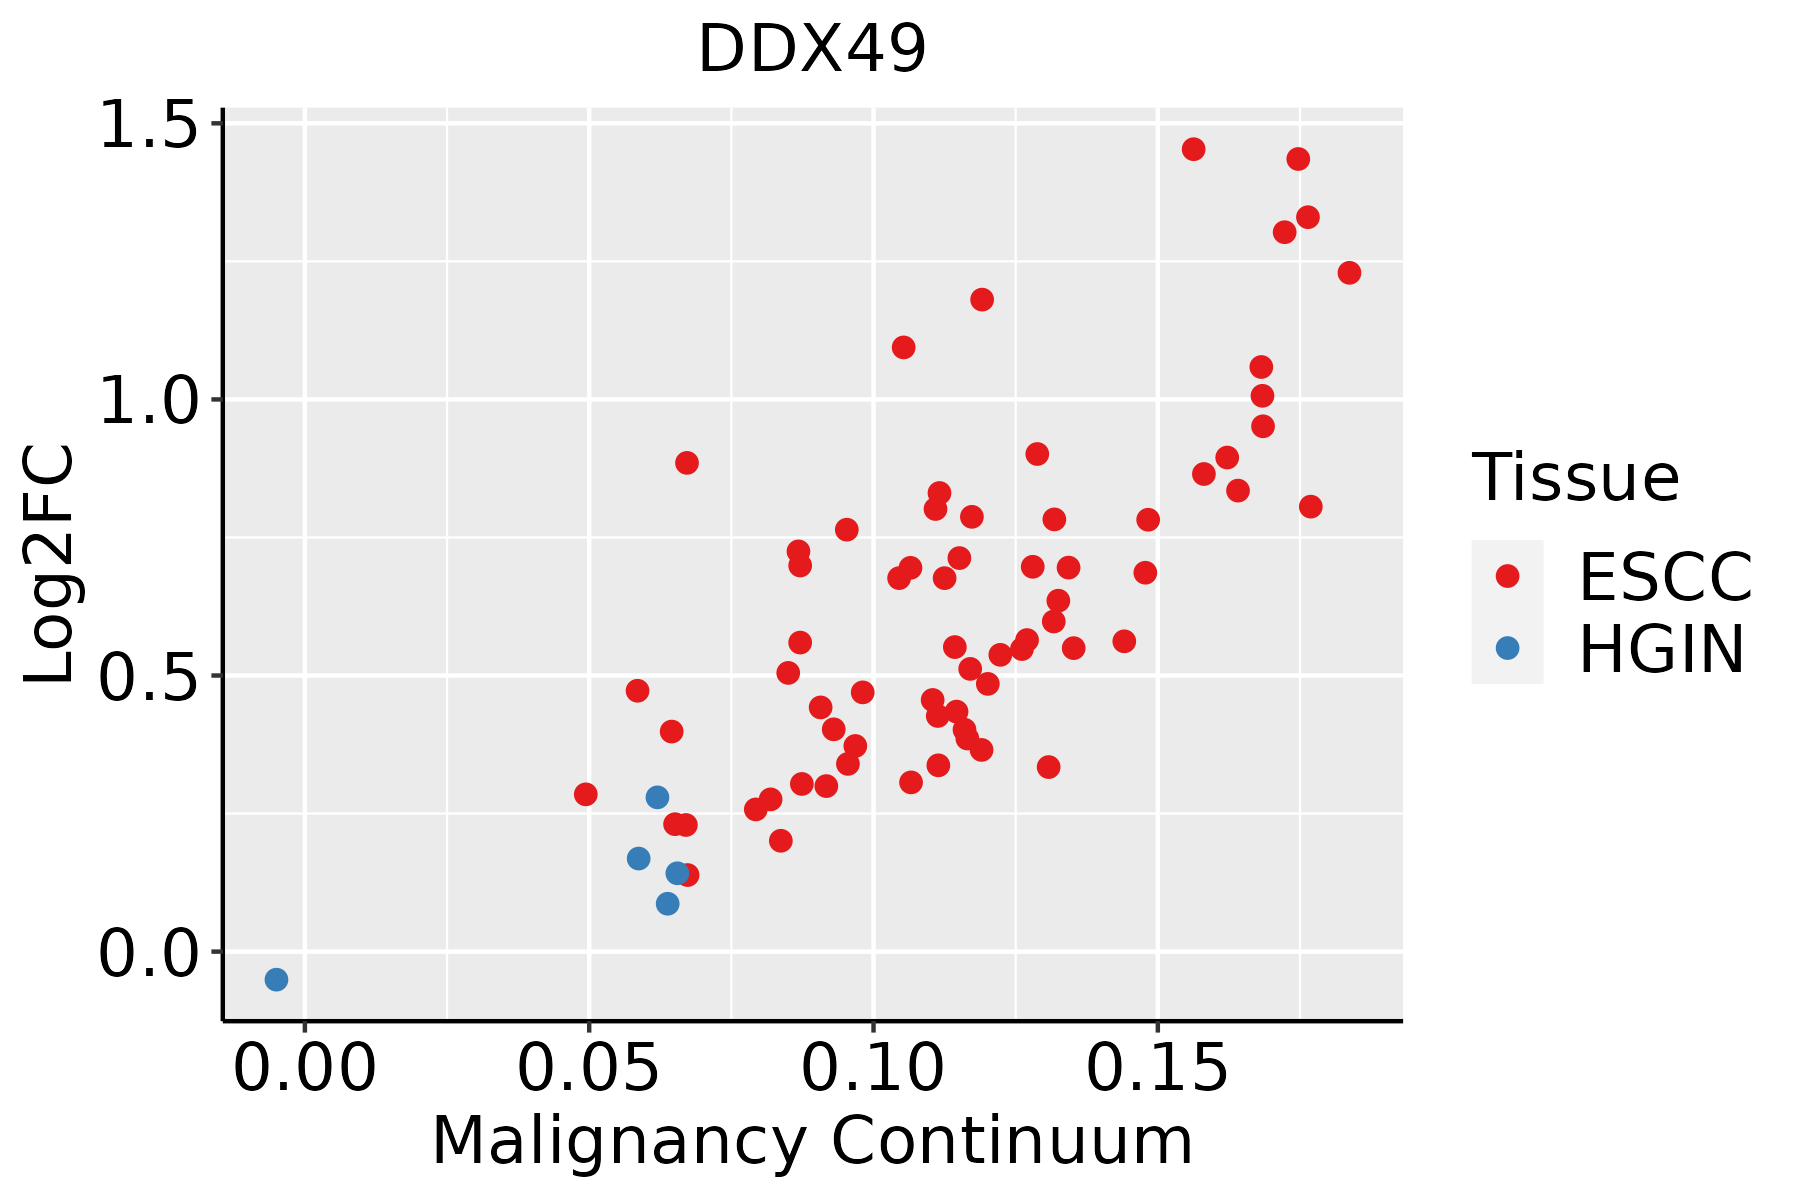
ESCC: Esophageal squamous cell carcinoma
HGIN: High-grade intraepithelial neoplasias
LGIN: Low-grade intraepithelial neoplasias
LiverThe image shows the transcriptomic changes along malignancy continuum.log2FC in expression of this searched gene in stem-like cells from each diseased tissue sample relative to stem-like cells in normal samples in each tissue plotted against the malignancy continuum. Samples are colored based on if they are from different disease stage.
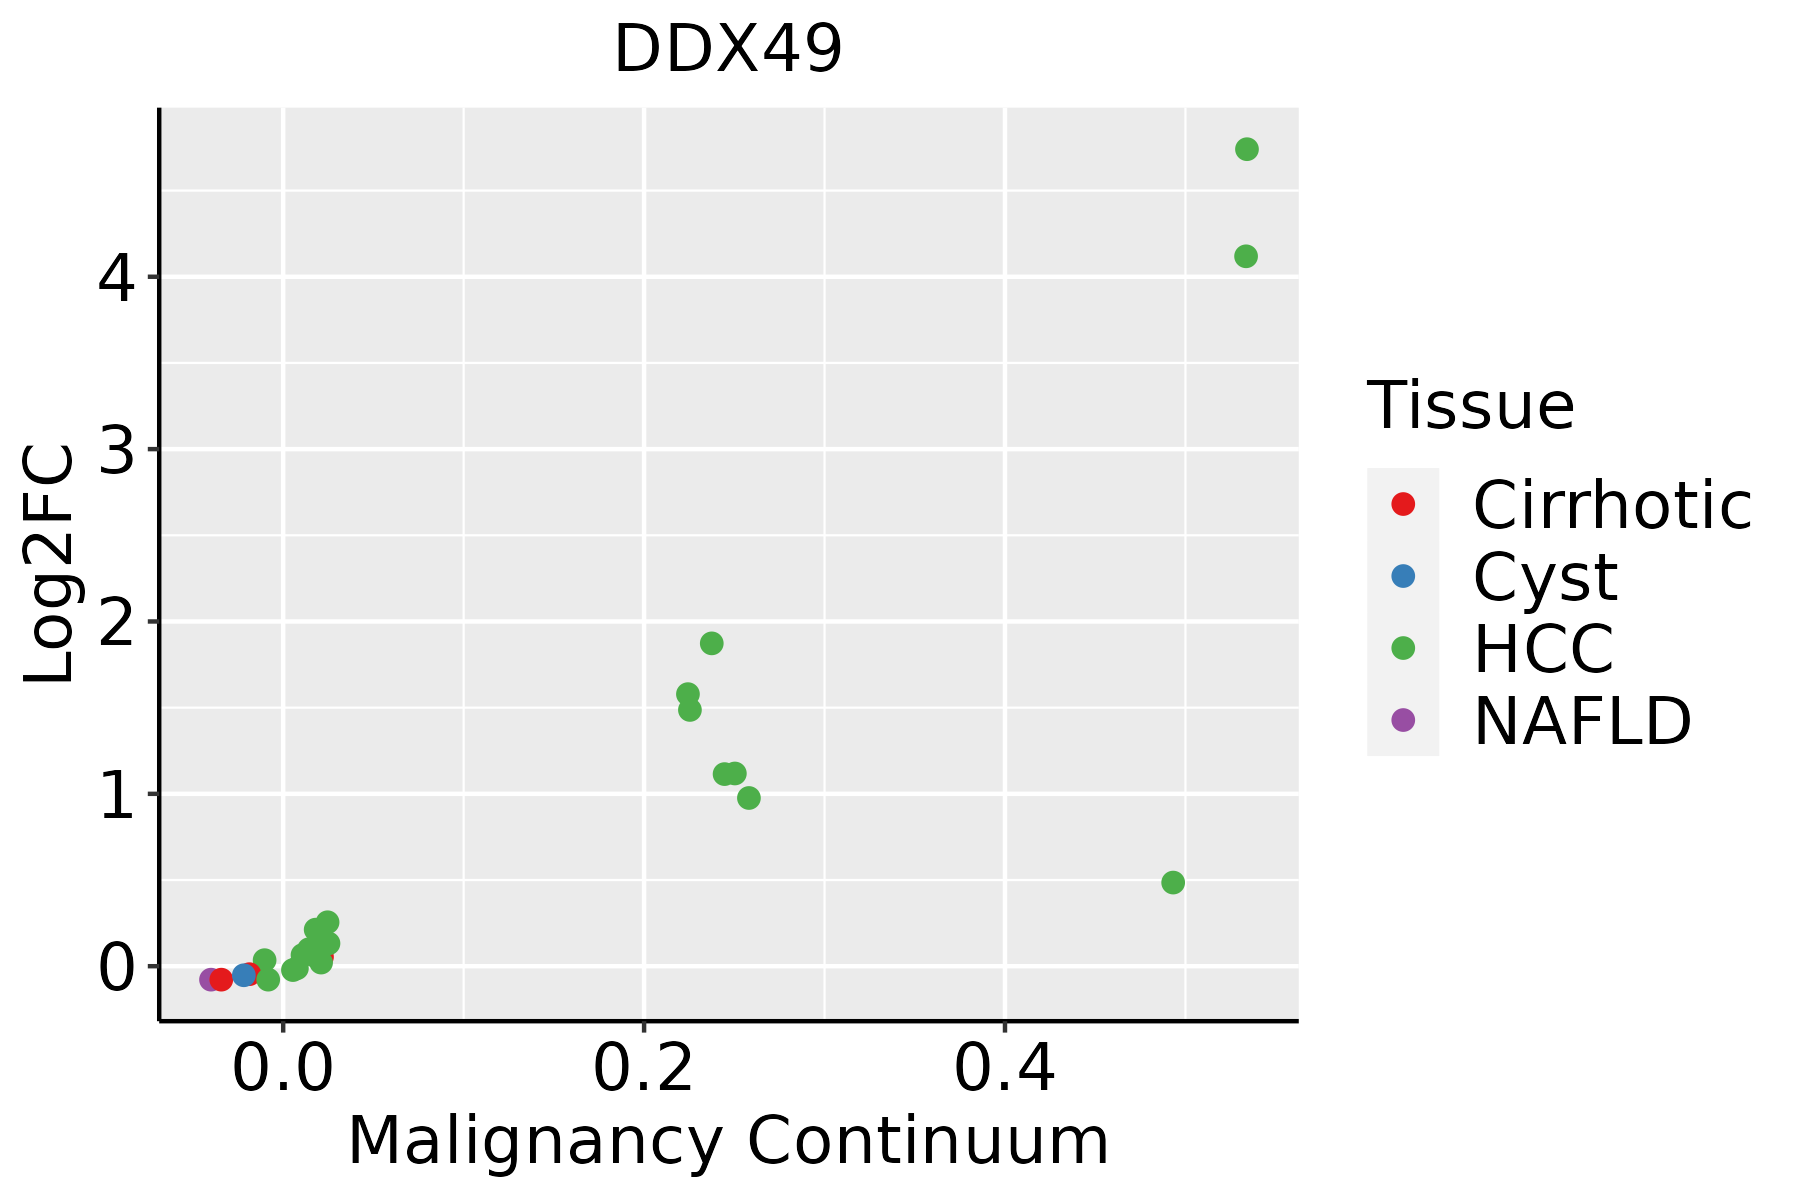
HCC: Hepatocellular carcinoma
NAFLD: Non-alcoholic fatty liver disease
Oral CavityThe image shows the transcriptomic changes along malignancy continuum.log2FC in expression of this searched gene in stem-like cells from each diseased tissue sample relative to stem-like cells in normal samples in each tissue plotted against the malignancy continuum. Samples are colored based on if they are from different disease stage.
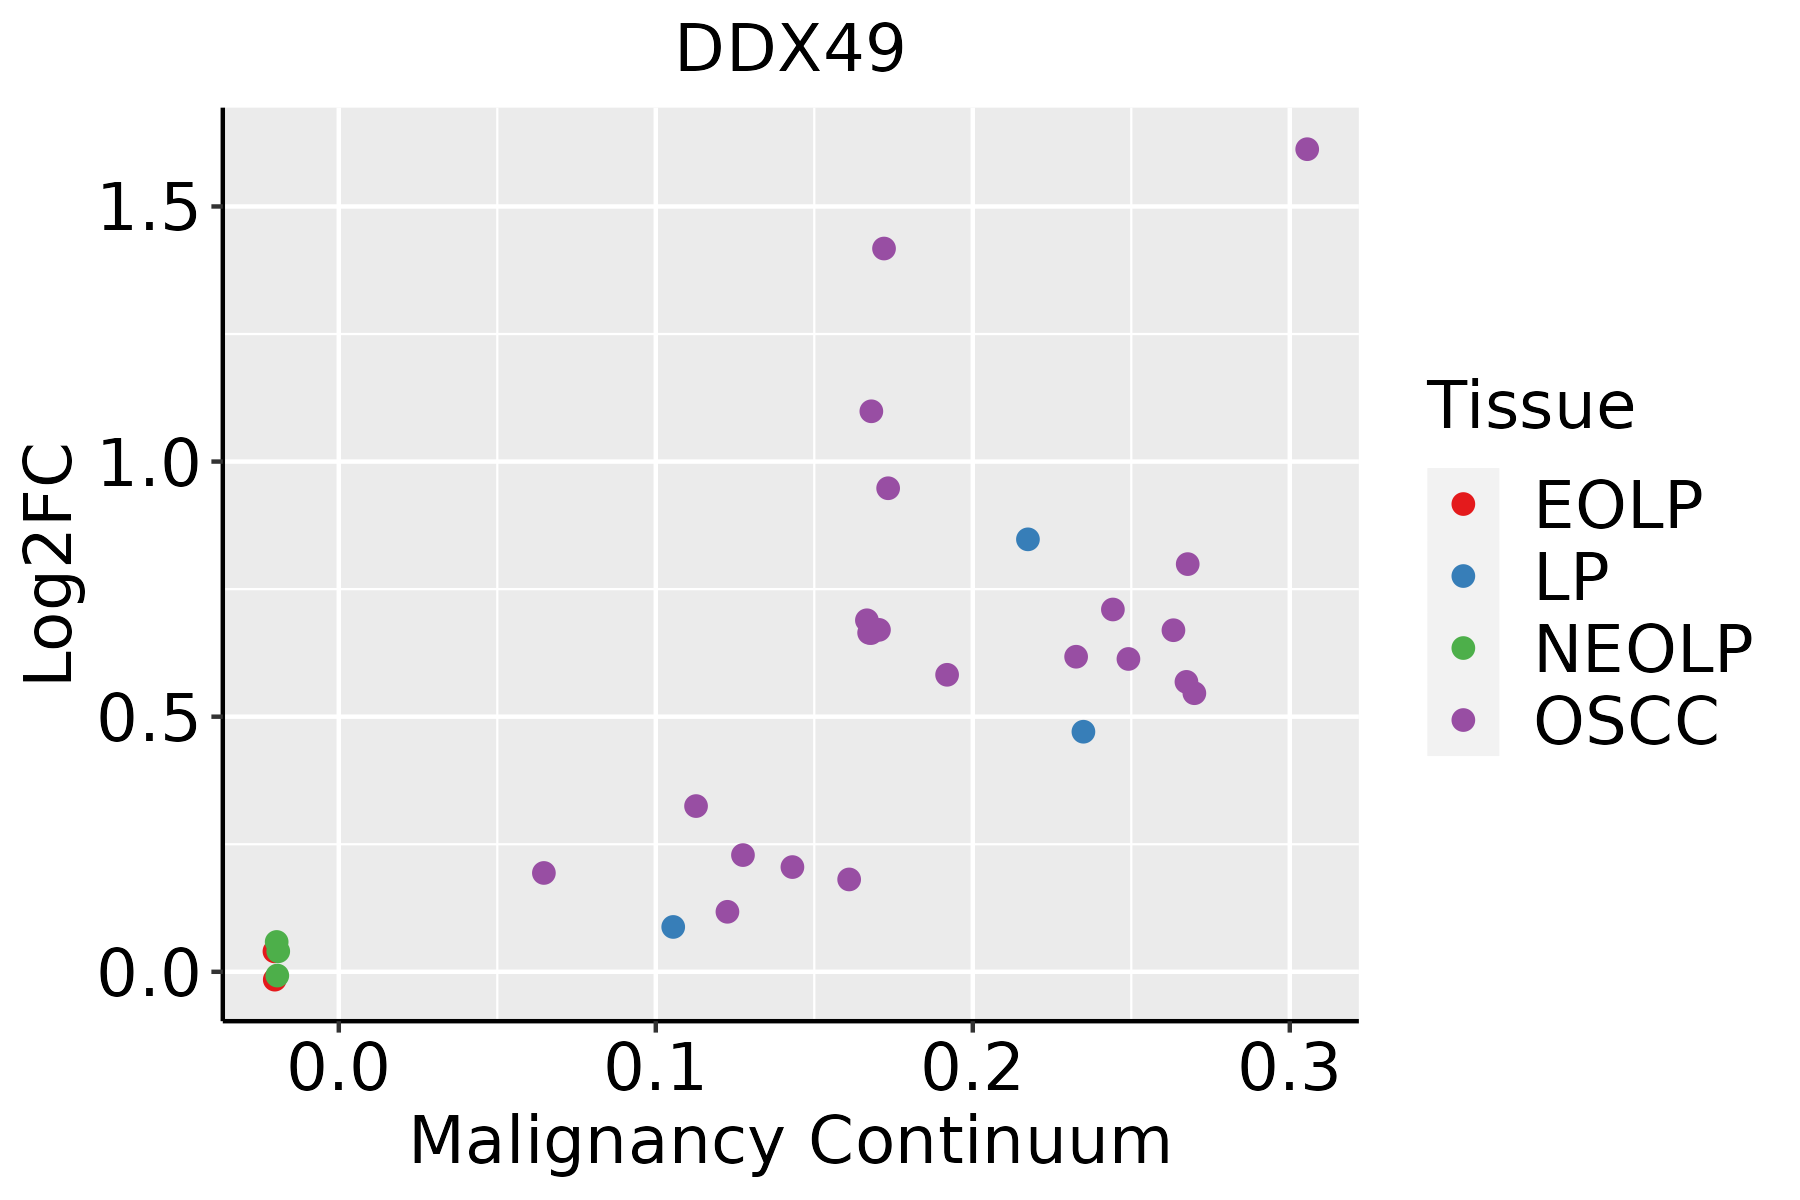
EOLP: Erosive Oral lichen planus
LP: leukoplakia
NEOLP: Non-erosive oral lichen planus
OSCC: Oral squamous cell carcinoma
SkinThe image shows the transcriptomic changes along malignancy continuum.log2FC in expression of this searched gene in stem-like cells from each diseased tissue sample relative to stem-like cells in normal samples in each tissue plotted against the malignancy continuum. Samples are colored based on if they are from different disease stage.
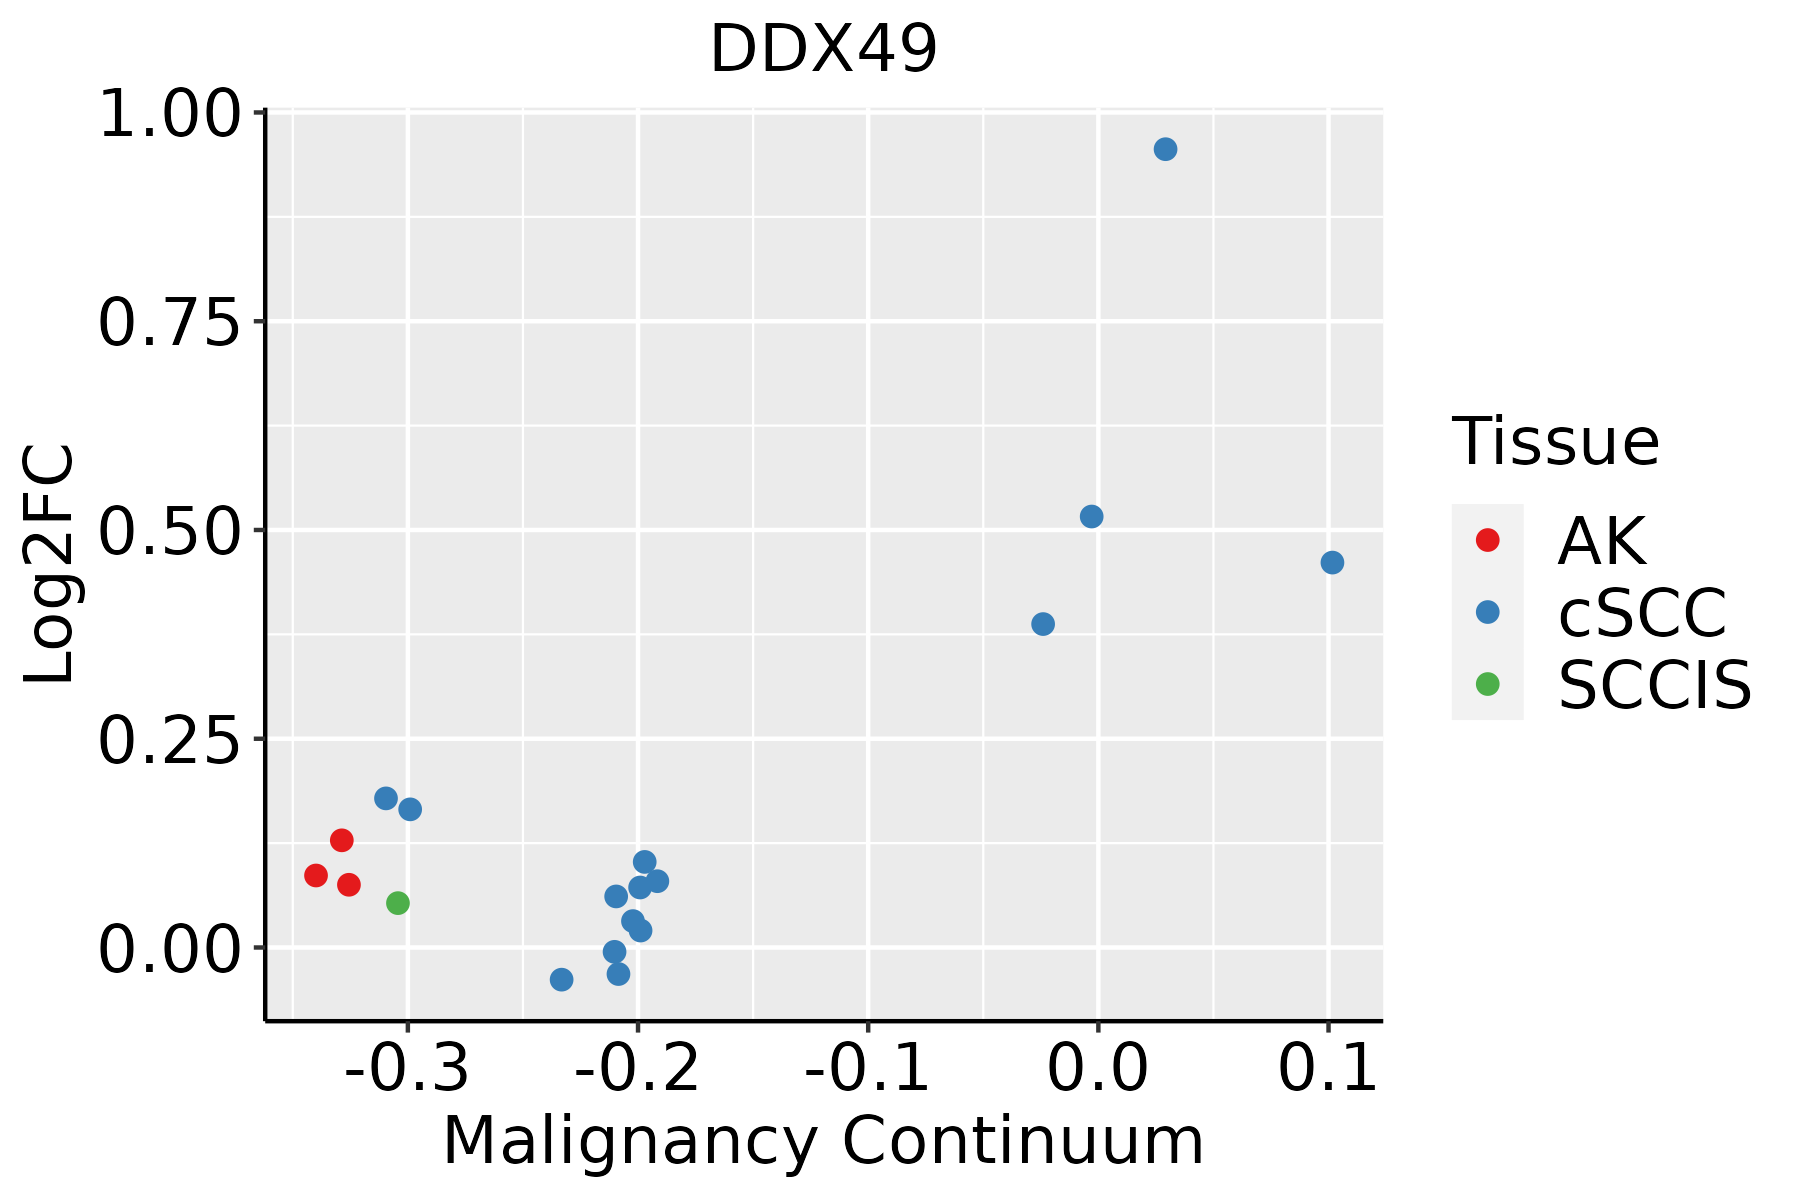
AK: Actinic keratosis
cSCC: Cutaneous squamous cell carcinoma
SCCIS:squamous cell carcinoma in situ
ThyroidThe image shows the transcriptomic changes along malignancy continuum.log2FC in expression of this searched gene in stem-like cells from each diseased tissue sample relative to stem-like cells in normal samples in each tissue plotted against the malignancy continuum. Samples are colored based on if they are from different disease stage.
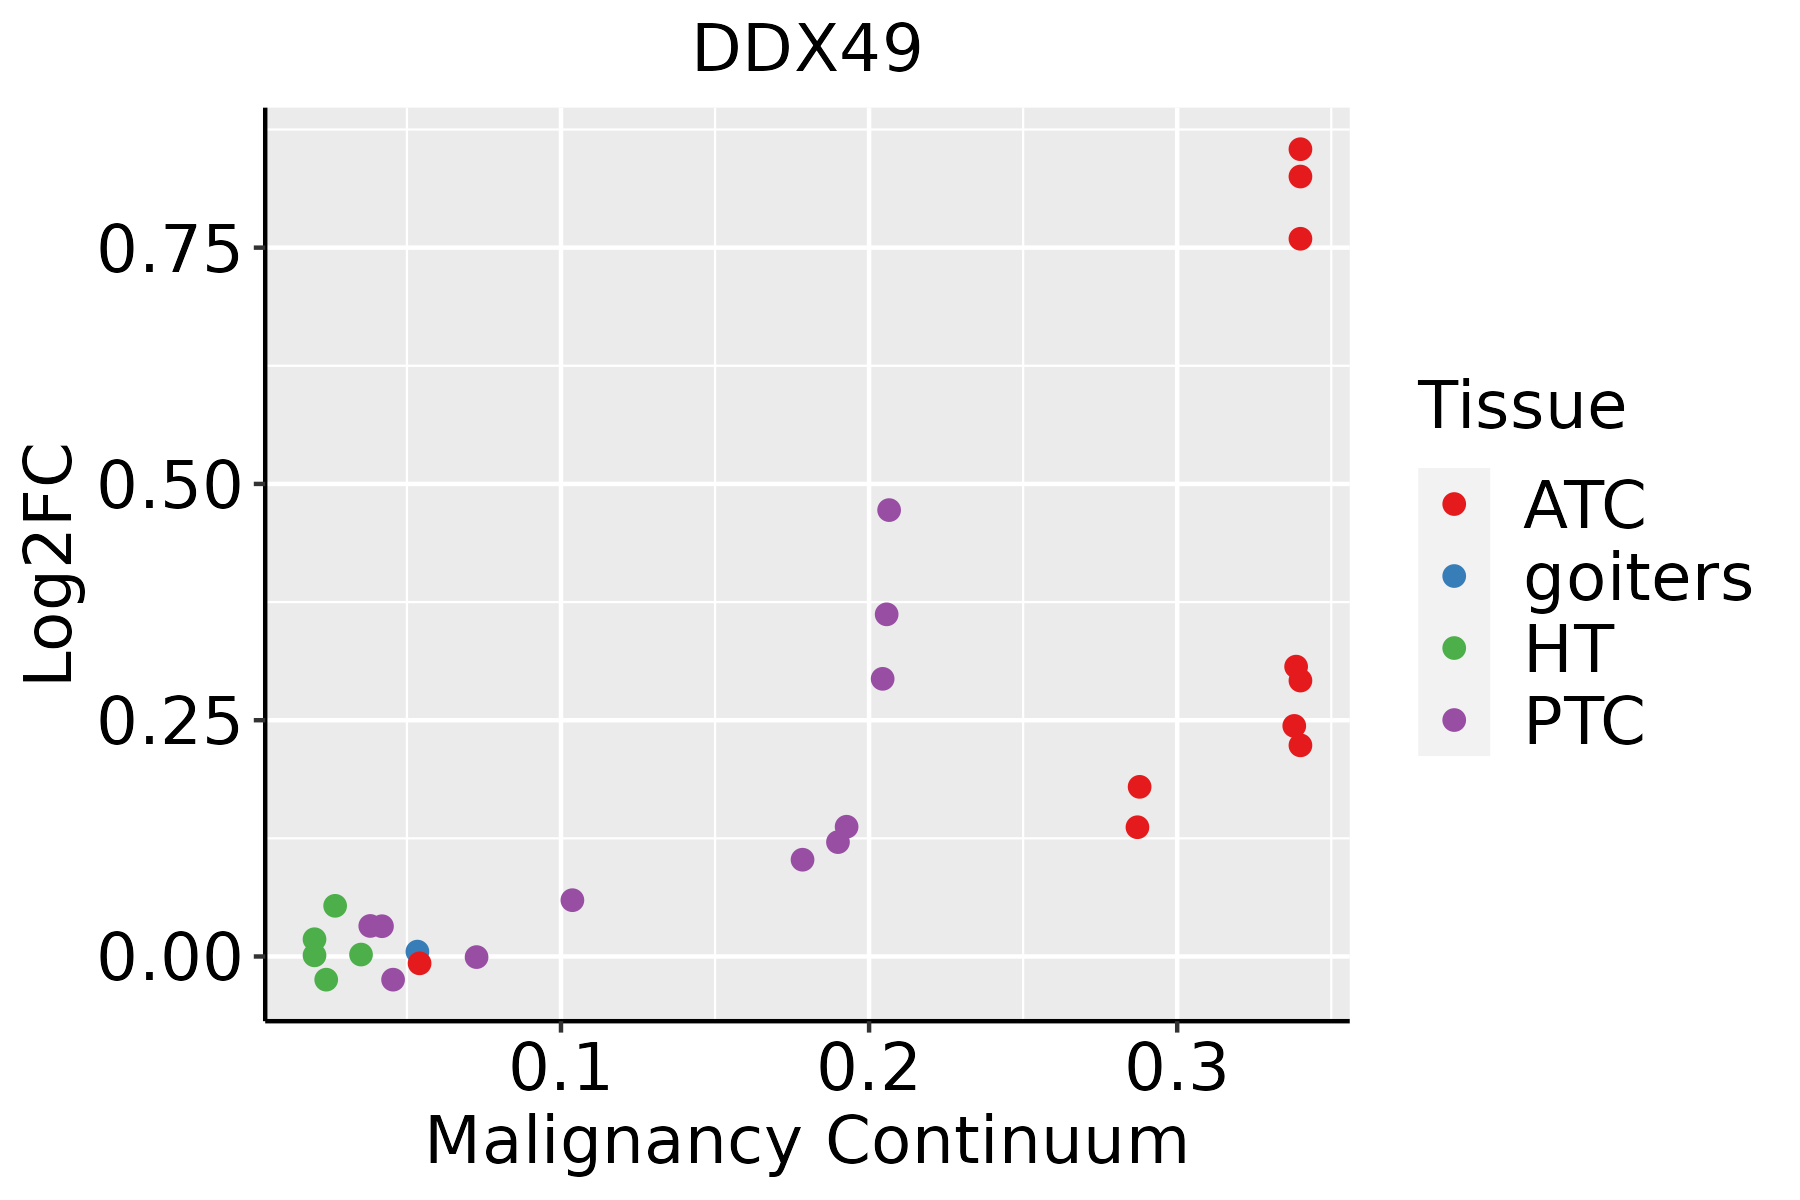
ATC: Anaplastic thyroid cancer
HT: Hashimoto's thyroiditis
PTC: Papillary thyroid cancer
∗log2FC in expression of this searched gene in stem-like cells from each diseased tissue sample relative to stem-like cells in normal samples in each tissue plotted against the malignancy continuum. Samples are colored based on if they are from different disease stage.

Top

Malignant transformation related pathway analysis

check buttonFind out the enriched GO biological processes and KEGG pathways involved in transition from healthy to precancer to cancer
check button Figure of enriched GO biological processes.
TissueDisease StageEnriched GO biological Processes
ColorectumADGO analysis - Figure of enriched GO biological processes: Top 15 enriched GO BP terms are showed in the bar plot of each disease state in each tissue. Each row represents a significant GO biological process which is colored according to the -log10(p.adjust).
ColorectumSERGO analysis - Figure of enriched GO biological processes: Top 15 enriched GO BP terms are showed in the bar plot of each disease state in each tissue. Each row represents a significant GO biological process which is colored according to the -log10(p.adjust).
ColorectumMSSGO analysis - Figure of enriched GO biological processes: Top 15 enriched GO BP terms are showed in the bar plot of each disease state in each tissue. Each row represents a significant GO biological process which is colored according to the -log10(p.adjust).
ColorectumMSI-HGO analysis - Figure of enriched GO biological processes: Top 15 enriched GO BP terms are showed in the bar plot of each disease state in each tissue. Each row represents a significant GO biological process which is colored according to the -log10(p.adjust).
ColorectumFAPGO analysis - Figure of enriched GO biological processes: Top 15 enriched GO BP terms are showed in the bar plot of each disease state in each tissue. Each row represents a significant GO biological process which is colored according to the -log10(p.adjust).
∗Top 15 enriched GO BP terms are showed in the bar plot of each disease state in each tissue. Each row represents a significant GO biological process which is colored according to the -log10(p.adjust).
Page: 1 2 3 4 5 6 7 8 9 

check button Enriched GO biological processes.
GO IDTissueDisease StageDescriptionGene RatioBg Ratiopvaluep.adjustCount
GO:002261327EsophagusHGINribonucleoprotein complex biogenesis158/2587463/187232.61e-295.23e-26158
GO:004225426EsophagusHGINribosome biogenesis101/2587299/187238.74e-194.03e-16101
GO:001607219EsophagusHGINrRNA metabolic process72/2587236/187232.26e-112.56e-0972
GO:000636419EsophagusHGINrRNA processing69/2587225/187234.53e-115.04e-0969
GO:000640120EsophagusHGINRNA catabolic process77/2587278/187237.63e-106.36e-0877
GO:003447010EsophagusHGINncRNA processing97/2587395/187235.92e-093.90e-0797
GO:003465519EsophagusHGINnucleobase-containing compound catabolic process98/2587407/187231.44e-088.94e-0798
GO:004670017EsophagusHGINheterocycle catabolic process103/2587445/187235.44e-082.99e-06103
GO:004427018EsophagusHGINcellular nitrogen compound catabolic process103/2587451/187231.10e-075.56e-06103
GO:001943917EsophagusHGINaromatic compound catabolic process105/2587467/187231.89e-079.31e-06105
GO:190136117EsophagusHGINorganic cyclic compound catabolic process106/2587495/187231.94e-067.13e-05106
GO:00346606EsophagusHGINncRNA metabolic process104/2587485/187232.26e-068.23e-05104
GO:001604919EsophagusHGINcell growth93/2587482/187234.49e-046.62e-0393
GO:004348718EsophagusHGINregulation of RNA stability39/2587170/187238.42e-041.09e-0239
GO:000155818EsophagusHGINregulation of cell growth76/2587414/187235.40e-034.42e-0276
GO:0022613111EsophagusESCCribonucleoprotein complex biogenesis365/8552463/187231.74e-491.11e-45365
GO:0042254111EsophagusESCCribosome biogenesis252/8552299/187233.27e-441.04e-40252
GO:003447015EsophagusESCCncRNA processing300/8552395/187233.09e-353.26e-32300
GO:0016072110EsophagusESCCrRNA metabolic process197/8552236/187231.31e-331.18e-30197
GO:0006364110EsophagusESCCrRNA processing189/8552225/187234.88e-333.87e-30189
Page: 1 2 3 4 5 6 7 8 

check button Enriched KEGG pathways.
Pathway IDTissueDisease StageDescriptionGene RatioBg Ratiopvaluep.adjustqvalueCount
Page: 1 

Top

Cell-cell communication analysis

check buttonIdentification of potential cell-cell interactions between two cell types and their ligand-receptor pairs for different disease states
LigandReceptorLRpairPathwayTissueDisease Stage
Page: 1 

Top

Single-cell gene regulatory network inference analysis

check buttonFind out the significant the regulons (TFs) and the target genes of each regulon across cell types for different disease states
TFCell TypeTissueDisease StageTarget GeneRSSRegulon Activity
∗The dot plots of a searched regulon are shown for all cell subpopulations in each disease state of each tissue based on the regulon specific score inferred using pySCENIC and by calculating the average expression.
Page: 1 

Top

Somatic mutation of malignant transformation related genes

check buttonAnnotation of somatic variants for genes involved in malignant transformation
Hugo SymbolVariant ClassVariant ClassificationdbSNP RSHGVScHGVSpHGVSp ShortSWISSPROTBIOTYPESIFTPolyPhenTumor Sample BarcodeTissueHistologySexAgeStageTherapy TypesDrugsOutcome
DDX49SNVMissense_Mutationrs778338254c.868N>Ap.Ala290Thrp.A290TQ9Y6V7protein_codingdeleterious(0.03)possibly_damaging(0.473)TCGA-AC-A23C-01Breastbreast invasive carcinomaFemale<65I/IIChemotherapychemoCR
DDX49SNVMissense_Mutationrs143128503c.1274N>Cp.Leu425Prop.L425PQ9Y6V7protein_codingdeleterious(0.04)possibly_damaging(0.592)TCGA-AR-A1AM-01Breastbreast invasive carcinomaFemale<65III/IVChemotherapyadriamycinSD
DDX49SNVMissense_Mutationrs768911735c.422N>Gp.Phe141Cysp.F141CQ9Y6V7protein_codingdeleterious(0.01)probably_damaging(0.948)TCGA-AR-A1AV-01Breastbreast invasive carcinomaMale>=65I/IIChemotherapycytoxanSD
DDX49SNVMissense_Mutationc.119N>Ap.Arg40Glnp.R40QQ9Y6V7protein_codingtolerated(0.4)benign(0.1)TCGA-BH-A0E1-01Breastbreast invasive carcinomaFemale<65I/IIChemotherapycytoxanSD
DDX49SNVMissense_Mutationc.798N>Ap.Met266Ilep.M266IQ9Y6V7protein_codingtolerated(0.18)benign(0.065)TCGA-D8-A1JA-01Breastbreast invasive carcinomaFemale<65III/IVChemotherapyadriamycinPD
DDX49insertionFrame_Shift_Insnovelc.816_817insAACCTCTGTCTCCTGGGTTCAAACAAp.Phe273AsnfsTer18p.F273Nfs*18Q9Y6V7protein_codingTCGA-A8-A07O-01Breastbreast invasive carcinomaFemale<65I/IIChemotherapyCR
DDX49insertionFrame_Shift_Insnovelc.1060_1061insGGCTCACGCCTGTAATCTTp.Gln354ArgfsTer49p.Q354Rfs*49Q9Y6V7protein_codingTCGA-BH-A0HU-01Breastbreast invasive carcinomaFemale<65I/IIChemotherapydocetaxelSD
DDX49insertionFrame_Shift_Insnovelc.1062_1063insCACTTp.Tyr355HisfsTer64p.Y355Hfs*64Q9Y6V7protein_codingTCGA-BH-A0HU-01Breastbreast invasive carcinomaFemale<65I/IIChemotherapydocetaxelSD
DDX49deletionFrame_Shift_Delnovelc.516delNp.Leu173TrpfsTer17p.L173Wfs*17Q9Y6V7protein_codingTCGA-EW-A2FV-01Breastbreast invasive carcinomaFemale<65III/IVChemotherapydocetaxelSD
DDX49SNVMissense_Mutationrs143787772c.899N>Ap.Arg300Glnp.R300QQ9Y6V7protein_codingtolerated(0.21)benign(0.072)TCGA-2W-A8YY-01Cervixcervical & endocervical cancerFemale<65I/IIChemotherapycisplatinCR
Page: 1 2 3 4 5 

Top

Related drugs of malignant transformation related genes

check buttonIdentification of chemicals and drugs interact with genes involved in malignant transfromation
(DGIdb 4.0)
Entrez IDSymbolCategoryInteraction TypesDrug Claim NameDrug NamePMIDs
Page: 1