
|
|||||
|
 | |
| |
| |
| |
| |
| |
|
Gene: DDX47 |
Gene summary for DDX47 |
| Gene information | Species | Human | Gene symbol | DDX47 | Gene ID | 51202 |
| Gene name | DEAD-box helicase 47 | |
| Gene Alias | E4-DBP | |
| Cytomap | 12p13.1 | |
| Gene Type | protein-coding | GO ID | GO:0006139 | UniProtAcc | A0A024RAS3 |
Top |
Malignant transformation analysis |
| Identification of the aberrant gene expression in precancerous and cancerous lesions by comparing the gene expression of stem-like cells in diseased tissues with normal stem cells |
| Entrez ID | Symbol | Replicates | Species | Organ | Tissue | Adj P-value | Log2FC | Malignancy |
| 51202 | DDX47 | LZE7T | Human | Esophagus | ESCC | 3.90e-02 | 1.58e-01 | 0.0667 |
| 51202 | DDX47 | LZE8T | Human | Esophagus | ESCC | 5.66e-07 | 2.22e-01 | 0.067 |
| 51202 | DDX47 | LZE20T | Human | Esophagus | ESCC | 1.20e-05 | 1.75e-01 | 0.0662 |
| 51202 | DDX47 | LZE24T | Human | Esophagus | ESCC | 1.28e-07 | 1.99e-01 | 0.0596 |
| 51202 | DDX47 | P2T-E | Human | Esophagus | ESCC | 2.27e-21 | 3.05e-01 | 0.1177 |
| 51202 | DDX47 | P4T-E | Human | Esophagus | ESCC | 1.06e-14 | 3.16e-01 | 0.1323 |
| 51202 | DDX47 | P5T-E | Human | Esophagus | ESCC | 9.53e-09 | 2.03e-01 | 0.1327 |
| 51202 | DDX47 | P8T-E | Human | Esophagus | ESCC | 1.47e-14 | 3.07e-01 | 0.0889 |
| 51202 | DDX47 | P9T-E | Human | Esophagus | ESCC | 6.74e-06 | 1.49e-01 | 0.1131 |
| 51202 | DDX47 | P10T-E | Human | Esophagus | ESCC | 4.31e-06 | 1.42e-01 | 0.116 |
| 51202 | DDX47 | P11T-E | Human | Esophagus | ESCC | 1.20e-09 | 2.80e-01 | 0.1426 |
| 51202 | DDX47 | P12T-E | Human | Esophagus | ESCC | 5.30e-21 | 3.67e-01 | 0.1122 |
| 51202 | DDX47 | P15T-E | Human | Esophagus | ESCC | 2.04e-07 | 2.03e-01 | 0.1149 |
| 51202 | DDX47 | P16T-E | Human | Esophagus | ESCC | 1.41e-52 | 9.27e-01 | 0.1153 |
| 51202 | DDX47 | P17T-E | Human | Esophagus | ESCC | 1.49e-02 | 1.58e-01 | 0.1278 |
| 51202 | DDX47 | P20T-E | Human | Esophagus | ESCC | 3.11e-04 | 1.40e-01 | 0.1124 |
| 51202 | DDX47 | P21T-E | Human | Esophagus | ESCC | 4.41e-07 | 1.76e-01 | 0.1617 |
| 51202 | DDX47 | P22T-E | Human | Esophagus | ESCC | 1.77e-22 | 3.86e-01 | 0.1236 |
| 51202 | DDX47 | P23T-E | Human | Esophagus | ESCC | 7.44e-12 | 3.04e-01 | 0.108 |
| 51202 | DDX47 | P24T-E | Human | Esophagus | ESCC | 4.40e-09 | 2.04e-01 | 0.1287 |
| Page: 1 2 3 4 |
| Tissue | Expression Dynamics | Abbreviation |
| Esophagus | 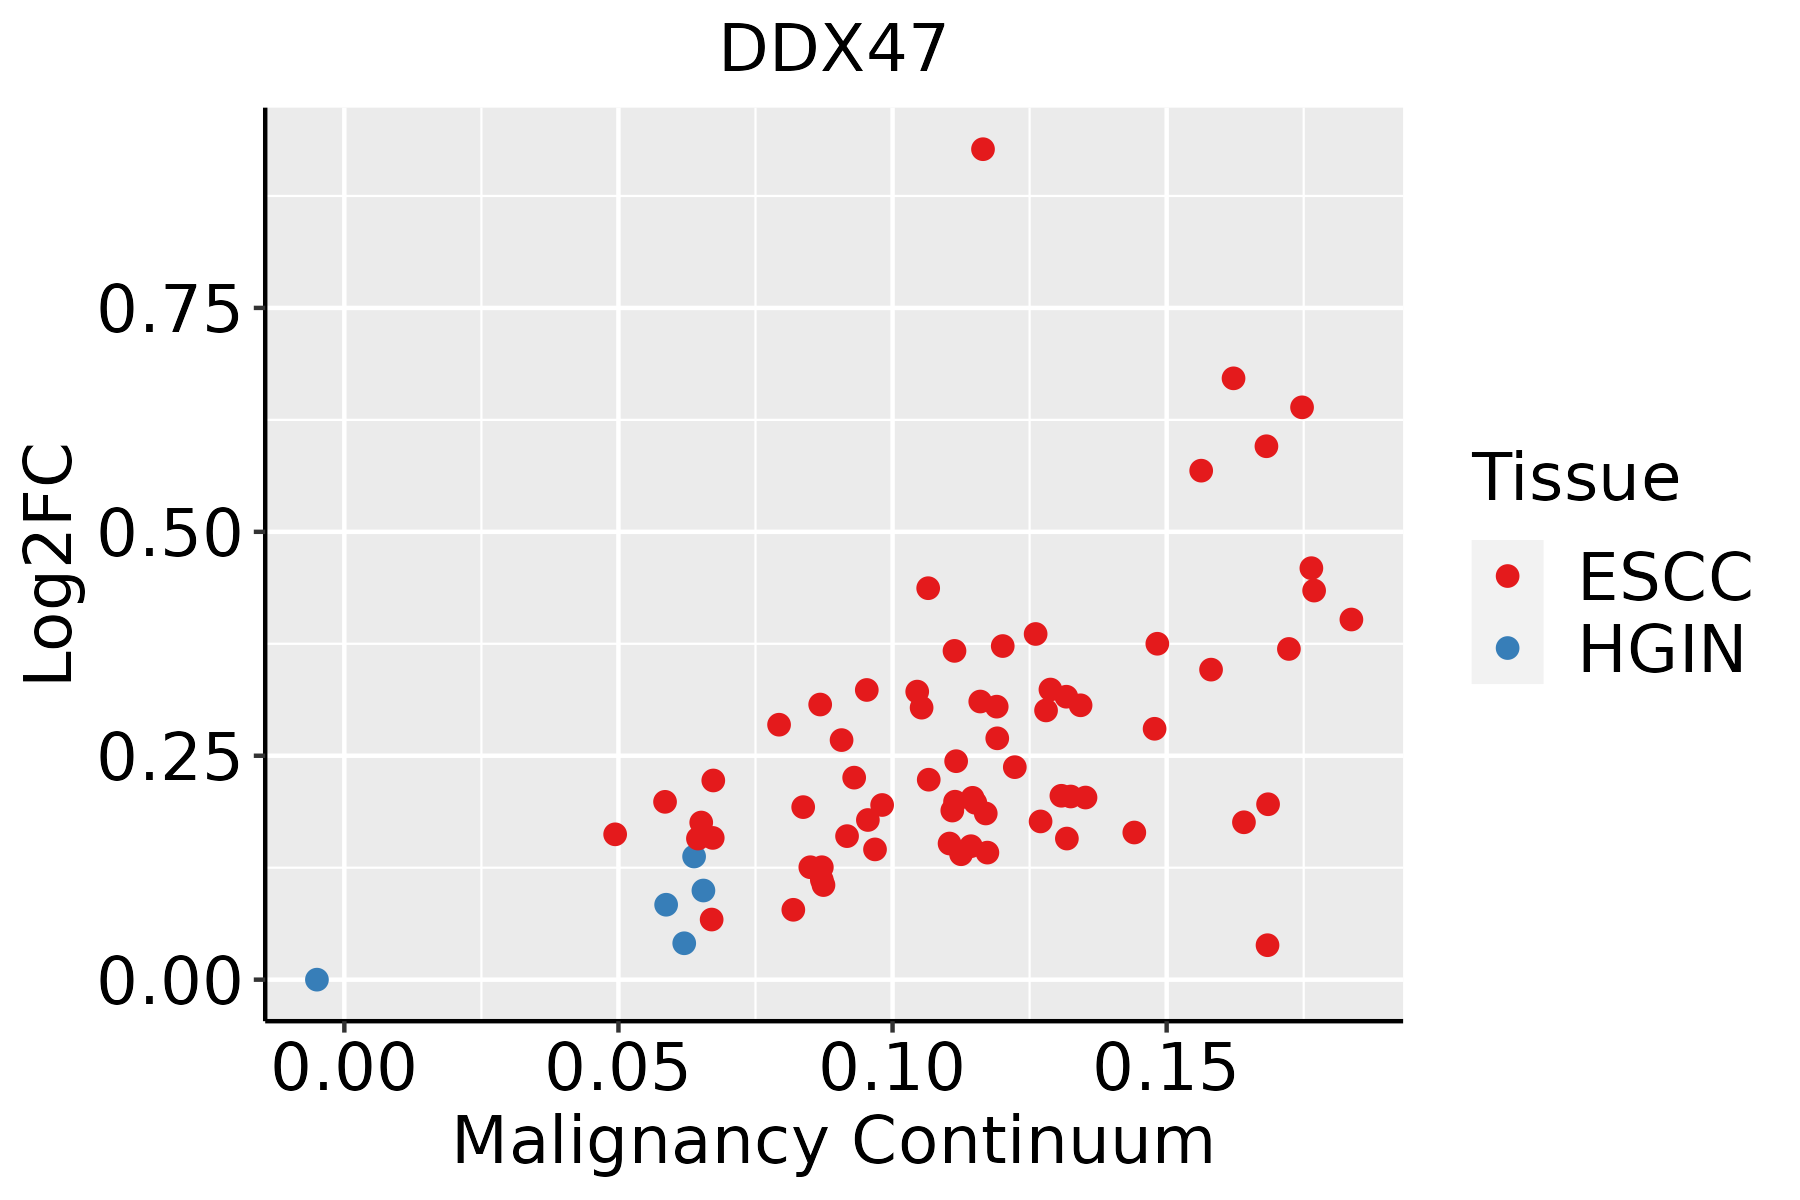 | ESCC: Esophageal squamous cell carcinoma |
| HGIN: High-grade intraepithelial neoplasias | ||
| LGIN: Low-grade intraepithelial neoplasias | ||
| Liver | 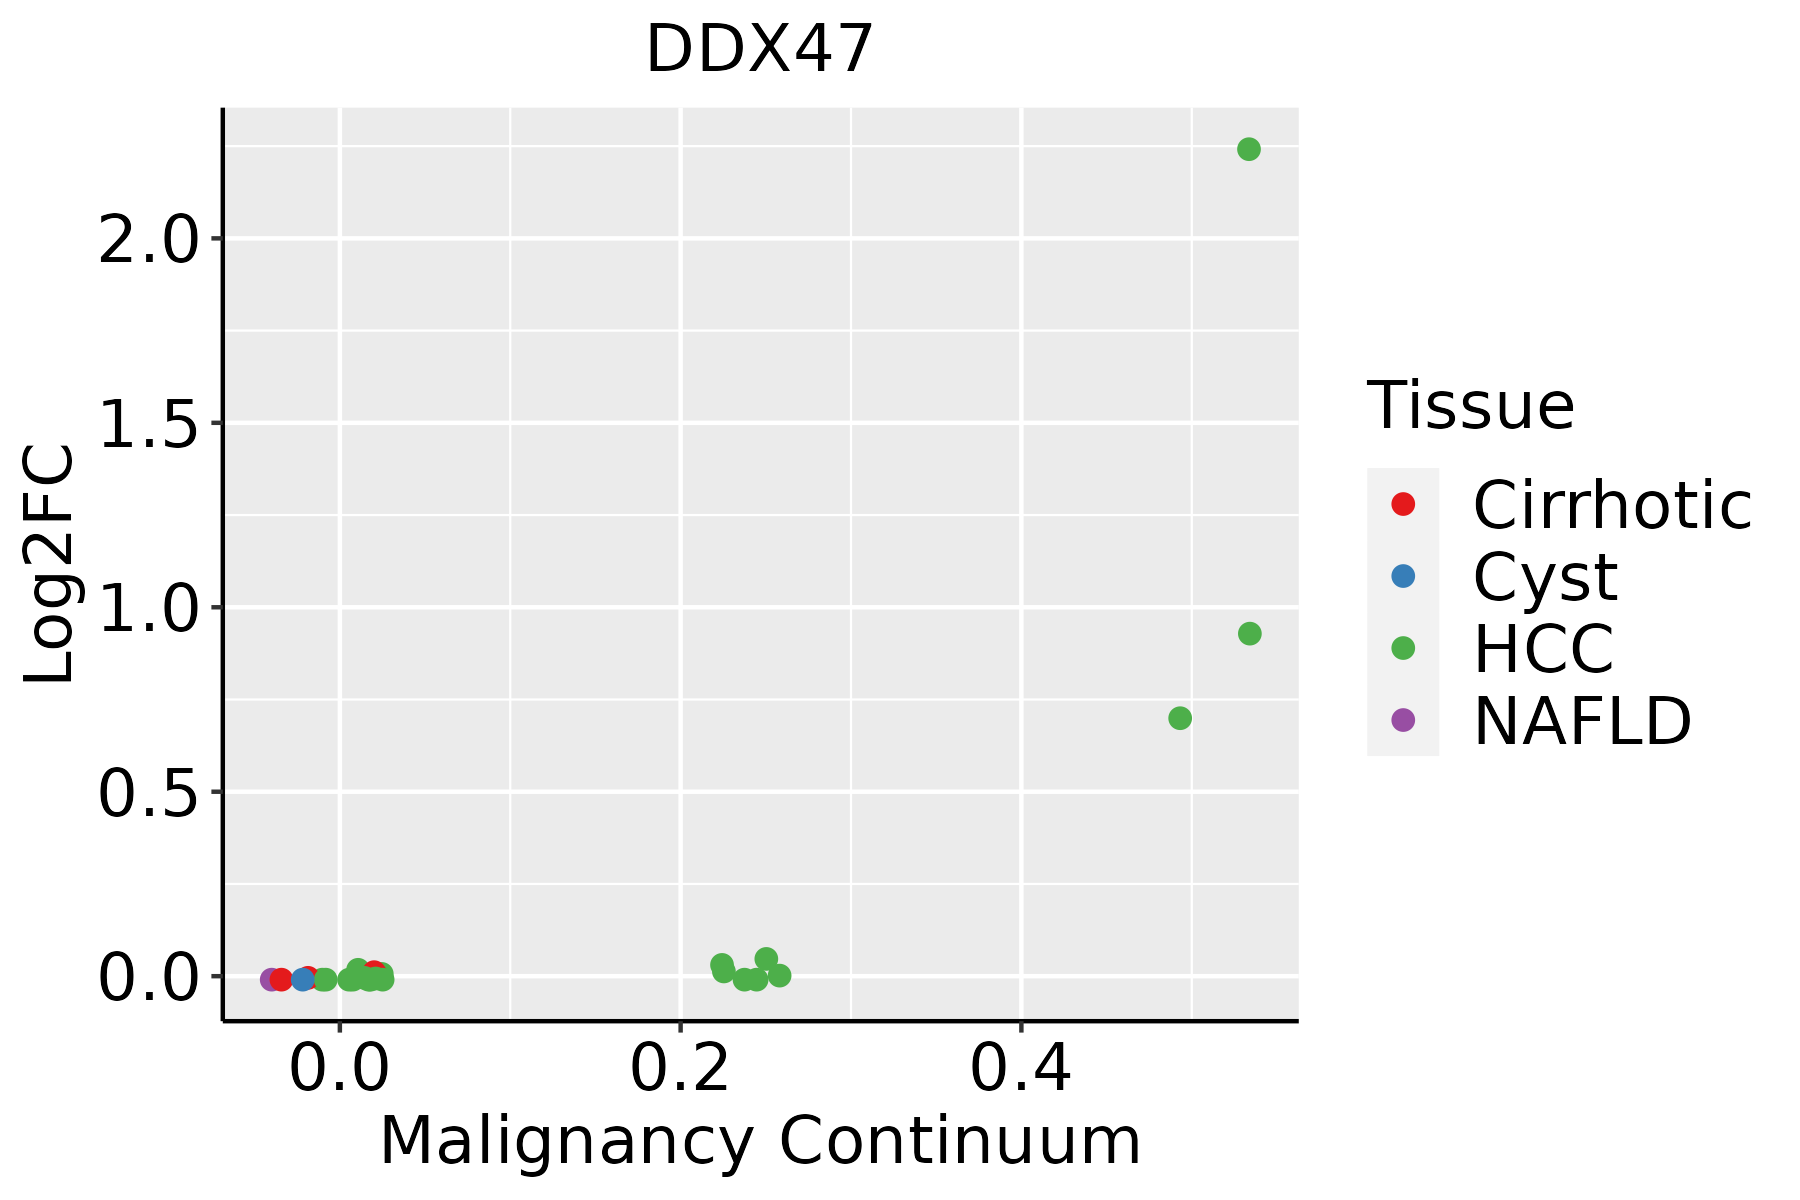 | HCC: Hepatocellular carcinoma |
| NAFLD: Non-alcoholic fatty liver disease |
| ∗log2FC in expression of this searched gene in stem-like cells from each diseased tissue sample relative to stem-like cells in normal samples in each tissue plotted against the malignancy continuum. Samples are colored based on if they are from different disease stage. |
Top |
Malignant transformation related pathway analysis |
| Find out the enriched GO biological processes and KEGG pathways involved in transition from healthy to precancer to cancer |
| Tissue | Disease Stage | Enriched GO biological Processes |
| Colorectum | AD |  |
| Colorectum | SER |  |
| Colorectum | MSS |  |
| Colorectum | MSI-H |  |
| Colorectum | FAP |  |
| ∗Top 15 enriched GO BP terms are showed in the bar plot of each disease state in each tissue. Each row represents a significant GO biological process which is colored according to the -log10(p.adjust). |
| Page: 1 2 3 4 5 6 7 8 9 |
| GO ID | Tissue | Disease Stage | Description | Gene Ratio | Bg Ratio | pvalue | p.adjust | Count |
| GO:0022613111 | Esophagus | ESCC | ribonucleoprotein complex biogenesis | 365/8552 | 463/18723 | 1.74e-49 | 1.11e-45 | 365 |
| GO:0042254111 | Esophagus | ESCC | ribosome biogenesis | 252/8552 | 299/18723 | 3.27e-44 | 1.04e-40 | 252 |
| GO:0008380111 | Esophagus | ESCC | RNA splicing | 336/8552 | 434/18723 | 1.74e-42 | 3.67e-39 | 336 |
| GO:003447015 | Esophagus | ESCC | ncRNA processing | 300/8552 | 395/18723 | 3.09e-35 | 3.26e-32 | 300 |
| GO:0016072110 | Esophagus | ESCC | rRNA metabolic process | 197/8552 | 236/18723 | 1.31e-33 | 1.18e-30 | 197 |
| GO:0006364110 | Esophagus | ESCC | rRNA processing | 189/8552 | 225/18723 | 4.88e-33 | 3.87e-30 | 189 |
| GO:003466012 | Esophagus | ESCC | ncRNA metabolic process | 346/8552 | 485/18723 | 4.35e-31 | 2.51e-28 | 346 |
| GO:0097191111 | Esophagus | ESCC | extrinsic apoptotic signaling pathway | 159/8552 | 219/18723 | 4.12e-16 | 2.94e-14 | 159 |
| GO:000862519 | Esophagus | ESCC | extrinsic apoptotic signaling pathway via death domain receptors | 59/8552 | 82/18723 | 1.23e-06 | 1.52e-05 | 59 |
| GO:002261322 | Liver | HCC | ribonucleoprotein complex biogenesis | 355/7958 | 463/18723 | 7.76e-52 | 4.92e-48 | 355 |
| GO:004225422 | Liver | HCC | ribosome biogenesis | 246/7958 | 299/18723 | 4.99e-46 | 1.58e-42 | 246 |
| GO:00344702 | Liver | HCC | ncRNA processing | 293/7958 | 395/18723 | 4.26e-38 | 6.76e-35 | 293 |
| GO:000838022 | Liver | HCC | RNA splicing | 313/7958 | 434/18723 | 1.36e-36 | 1.73e-33 | 313 |
| GO:001607212 | Liver | HCC | rRNA metabolic process | 193/7958 | 236/18723 | 1.26e-35 | 1.14e-32 | 193 |
| GO:000636421 | Liver | HCC | rRNA processing | 185/7958 | 225/18723 | 8.14e-35 | 6.45e-32 | 185 |
| GO:00346601 | Liver | HCC | ncRNA metabolic process | 332/7958 | 485/18723 | 1.48e-31 | 7.80e-29 | 332 |
| GO:009719122 | Liver | HCC | extrinsic apoptotic signaling pathway | 143/7958 | 219/18723 | 6.99e-12 | 2.97e-10 | 143 |
| GO:000862511 | Liver | HCC | extrinsic apoptotic signaling pathway via death domain receptors | 55/7958 | 82/18723 | 5.97e-06 | 7.35e-05 | 55 |
| Page: 1 |
| Pathway ID | Tissue | Disease Stage | Description | Gene Ratio | Bg Ratio | pvalue | p.adjust | qvalue | Count |
| Page: 1 |
Top |
Cell-cell communication analysis |
| Identification of potential cell-cell interactions between two cell types and their ligand-receptor pairs for different disease states |
| Ligand | Receptor | LRpair | Pathway | Tissue | Disease Stage |
| Page: 1 |
Top |
Single-cell gene regulatory network inference analysis |
| Find out the significant the regulons (TFs) and the target genes of each regulon across cell types for different disease states |
| TF | Cell Type | Tissue | Disease Stage | Target Gene | RSS | Regulon Activity |
| ∗The dot plots of a searched regulon are shown for all cell subpopulations in each disease state of each tissue based on the regulon specific score inferred using pySCENIC and by calculating the average expression. |
| Page: 1 |
Top |
Somatic mutation of malignant transformation related genes |
| Annotation of somatic variants for genes involved in malignant transformation |
| Hugo Symbol | Variant Class | Variant Classification | dbSNP RS | HGVSc | HGVSp | HGVSp Short | SWISSPROT | BIOTYPE | SIFT | PolyPhen | Tumor Sample Barcode | Tissue | Histology | Sex | Age | Stage | Therapy Types | Drugs | Outcome |
| DDX47 | SNV | Missense_Mutation | c.703N>A | p.Val235Ile | p.V235I | Q9H0S4 | protein_coding | deleterious(0) | probably_damaging(0.948) | TCGA-A8-A09A-01 | Breast | breast invasive carcinoma | Female | <65 | I/II | Hormone Therapy | tamoxiphen | SD | |
| DDX47 | SNV | Missense_Mutation | c.153G>C | p.Gln51His | p.Q51H | Q9H0S4 | protein_coding | deleterious(0) | probably_damaging(0.995) | TCGA-C8-A26Y-01 | Breast | breast invasive carcinoma | Female | >=65 | I/II | Unknown | Unknown | SD | |
| DDX47 | deletion | Frame_Shift_Del | novel | c.20delN | p.His7ProfsTer25 | p.H7Pfs*25 | Q9H0S4 | protein_coding | TCGA-EW-A2FV-01 | Breast | breast invasive carcinoma | Female | <65 | III/IV | Chemotherapy | docetaxel | SD | ||
| DDX47 | SNV | Missense_Mutation | rs766816468 | c.253N>A | p.Ala85Thr | p.A85T | Q9H0S4 | protein_coding | tolerated(0.12) | benign(0.022) | TCGA-A6-6653-01 | Colorectum | colon adenocarcinoma | Male | >=65 | I/II | Unknown | Unknown | SD |
| DDX47 | SNV | Missense_Mutation | rs199916690 | c.881N>G | p.His294Arg | p.H294R | Q9H0S4 | protein_coding | deleterious(0) | possibly_damaging(0.906) | TCGA-AA-3811-01 | Colorectum | colon adenocarcinoma | Female | >=65 | III/IV | Unknown | Unknown | PD |
| DDX47 | SNV | Missense_Mutation | c.264N>T | p.Glu88Asp | p.E88D | Q9H0S4 | protein_coding | tolerated(0.64) | benign(0.001) | TCGA-AA-3864-01 | Colorectum | colon adenocarcinoma | Male | >=65 | I/II | Unknown | Unknown | SD | |
| DDX47 | SNV | Missense_Mutation | rs142329297 | c.1010A>G | p.Asn337Ser | p.N337S | Q9H0S4 | protein_coding | deleterious(0) | probably_damaging(1) | TCGA-AA-3947-01 | Colorectum | colon adenocarcinoma | Female | <65 | I/II | Unknown | Unknown | SD |
| DDX47 | SNV | Missense_Mutation | rs774098537 | c.595N>T | p.Arg199Trp | p.R199W | Q9H0S4 | protein_coding | deleterious(0) | probably_damaging(1) | TCGA-AA-3977-01 | Colorectum | colon adenocarcinoma | Male | >=65 | I/II | Unknown | Unknown | SD |
| DDX47 | SNV | Missense_Mutation | novel | c.1076N>A | p.Arg359His | p.R359H | Q9H0S4 | protein_coding | deleterious(0) | benign(0.302) | TCGA-AA-A00N-01 | Colorectum | colon adenocarcinoma | Male | >=65 | I/II | Unknown | Unknown | PD |
| DDX47 | SNV | Missense_Mutation | c.655N>A | p.Ala219Thr | p.A219T | Q9H0S4 | protein_coding | deleterious(0.03) | benign(0.166) | TCGA-AD-6895-01 | Colorectum | colon adenocarcinoma | Male | >=65 | III/IV | Unknown | Unknown | SD |
| Page: 1 2 3 4 5 |
Top |
Related drugs of malignant transformation related genes |
| Identification of chemicals and drugs interact with genes involved in malignant transfromation |
| (DGIdb 4.0) |
| Entrez ID | Symbol | Category | Interaction Types | Drug Claim Name | Drug Name | PMIDs |
| Page: 1 |

Copyright 2023-Present -The University of Texas Health Science Center at Houston |