
|
|||||
|
 | |
| |
| |
| |
| |
| |
|
Gene: DDX46 |
Gene summary for DDX46 |
| Gene information | Species | Human | Gene symbol | DDX46 | Gene ID | 9879 |
| Gene name | DEAD-box helicase 46 | |
| Gene Alias | PRPF5 | |
| Cytomap | 5q31.1 | |
| Gene Type | protein-coding | GO ID | GO:0000375 | UniProtAcc | A0A0C4DG89 |
Top |
Malignant transformation analysis |
| Identification of the aberrant gene expression in precancerous and cancerous lesions by comparing the gene expression of stem-like cells in diseased tissues with normal stem cells |
| Entrez ID | Symbol | Replicates | Species | Organ | Tissue | Adj P-value | Log2FC | Malignancy |
| 9879 | DDX46 | HTA11_347_2000001011 | Human | Colorectum | AD | 9.98e-08 | 3.96e-01 | -0.1954 |
| 9879 | DDX46 | HTA11_99999965062_69753 | Human | Colorectum | MSI-H | 1.49e-03 | 8.89e-01 | 0.3487 |
| 9879 | DDX46 | A015-C-203 | Human | Colorectum | FAP | 4.27e-20 | -6.44e-02 | -0.1294 |
| 9879 | DDX46 | A015-C-204 | Human | Colorectum | FAP | 1.90e-02 | 1.62e-01 | -0.0228 |
| 9879 | DDX46 | A002-C-201 | Human | Colorectum | FAP | 3.87e-06 | -2.81e-02 | 0.0324 |
| 9879 | DDX46 | A002-C-203 | Human | Colorectum | FAP | 2.50e-03 | -6.09e-02 | 0.2786 |
| 9879 | DDX46 | A001-C-119 | Human | Colorectum | FAP | 4.02e-14 | 5.12e-01 | -0.1557 |
| 9879 | DDX46 | A001-C-108 | Human | Colorectum | FAP | 1.78e-15 | 2.63e-01 | -0.0272 |
| 9879 | DDX46 | A002-C-205 | Human | Colorectum | FAP | 1.96e-24 | 3.25e-01 | -0.1236 |
| 9879 | DDX46 | A001-C-104 | Human | Colorectum | FAP | 1.18e-02 | 2.13e-01 | 0.0184 |
| 9879 | DDX46 | A015-C-005 | Human | Colorectum | FAP | 2.60e-05 | 3.51e-01 | -0.0336 |
| 9879 | DDX46 | A015-C-006 | Human | Colorectum | FAP | 2.48e-17 | 3.40e-01 | -0.0994 |
| 9879 | DDX46 | A015-C-106 | Human | Colorectum | FAP | 4.30e-08 | 7.05e-02 | -0.0511 |
| 9879 | DDX46 | A002-C-114 | Human | Colorectum | FAP | 1.28e-17 | 3.04e-01 | -0.1561 |
| 9879 | DDX46 | A015-C-104 | Human | Colorectum | FAP | 8.64e-30 | 2.37e-01 | -0.1899 |
| 9879 | DDX46 | A001-C-014 | Human | Colorectum | FAP | 3.24e-07 | 4.96e-02 | 0.0135 |
| 9879 | DDX46 | A002-C-016 | Human | Colorectum | FAP | 1.92e-14 | 2.47e-02 | 0.0521 |
| 9879 | DDX46 | A015-C-002 | Human | Colorectum | FAP | 1.23e-06 | -1.40e-02 | -0.0763 |
| 9879 | DDX46 | A001-C-203 | Human | Colorectum | FAP | 6.74e-07 | 7.95e-02 | -0.0481 |
| 9879 | DDX46 | A002-C-116 | Human | Colorectum | FAP | 1.36e-24 | -6.92e-02 | -0.0452 |
| Page: 1 2 3 4 5 6 7 8 9 |
| Tissue | Expression Dynamics | Abbreviation |
| Colorectum (GSE201348) |  | FAP: Familial adenomatous polyposis |
| CRC: Colorectal cancer | ||
| Colorectum (HTA11) | 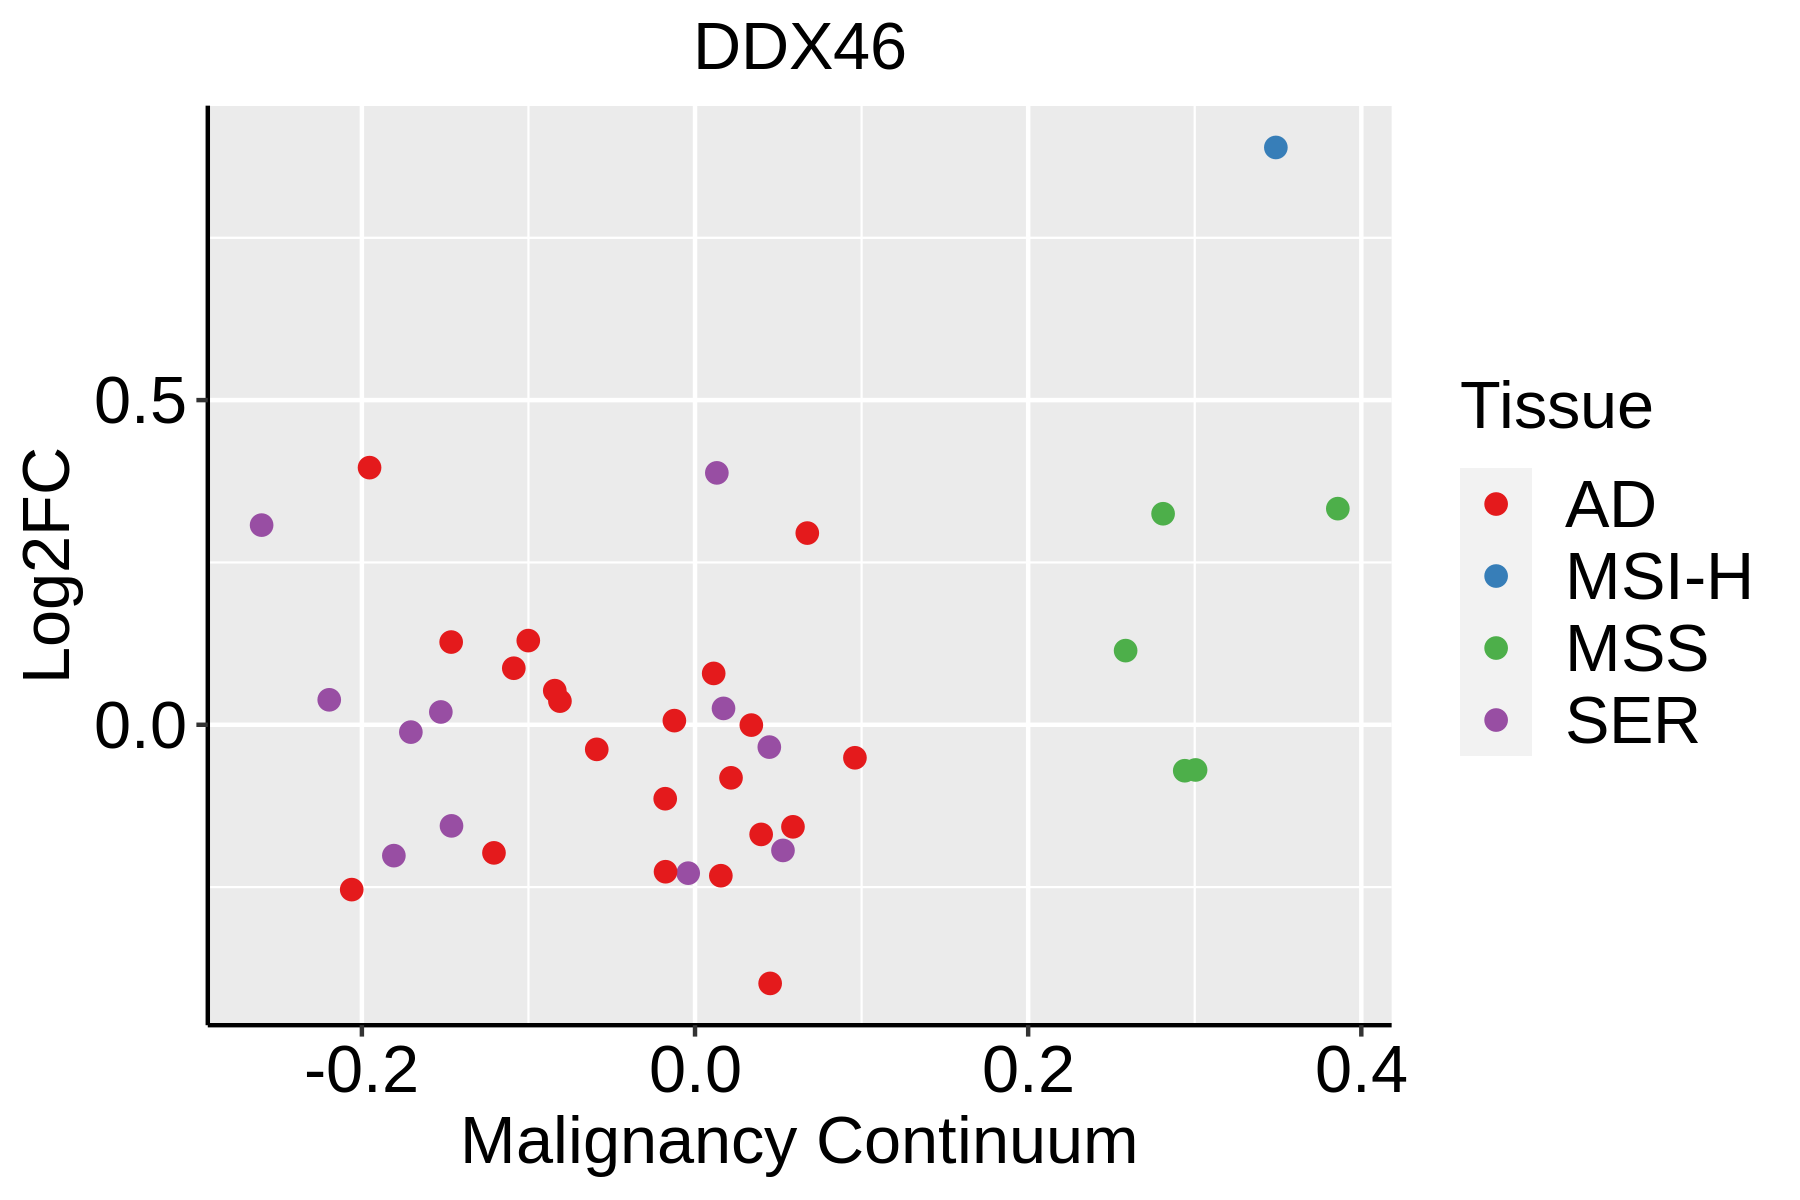 | AD: Adenomas |
| SER: Sessile serrated lesions | ||
| MSI-H: Microsatellite-high colorectal cancer | ||
| MSS: Microsatellite stable colorectal cancer | ||
| Esophagus | 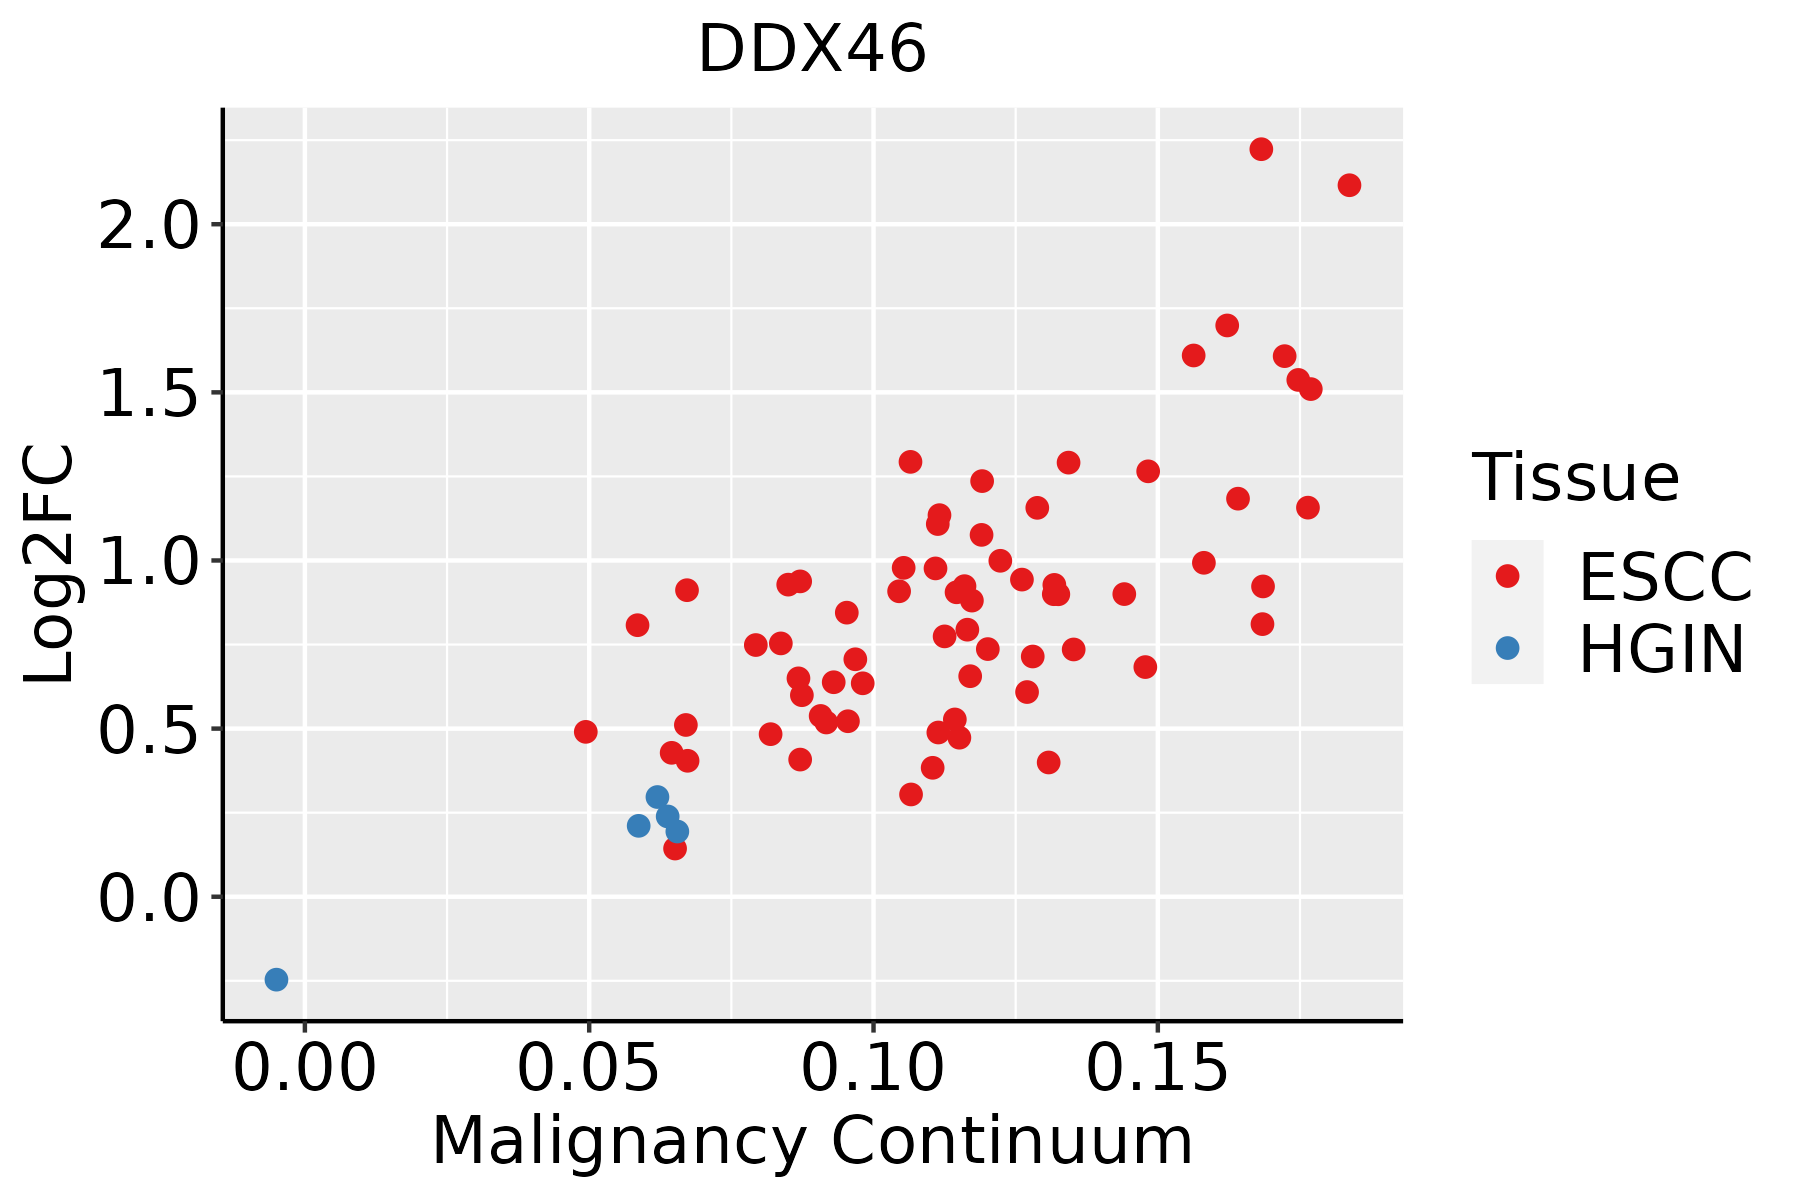 | ESCC: Esophageal squamous cell carcinoma |
| HGIN: High-grade intraepithelial neoplasias | ||
| LGIN: Low-grade intraepithelial neoplasias | ||
| Liver |  | HCC: Hepatocellular carcinoma |
| NAFLD: Non-alcoholic fatty liver disease | ||
| Oral Cavity | 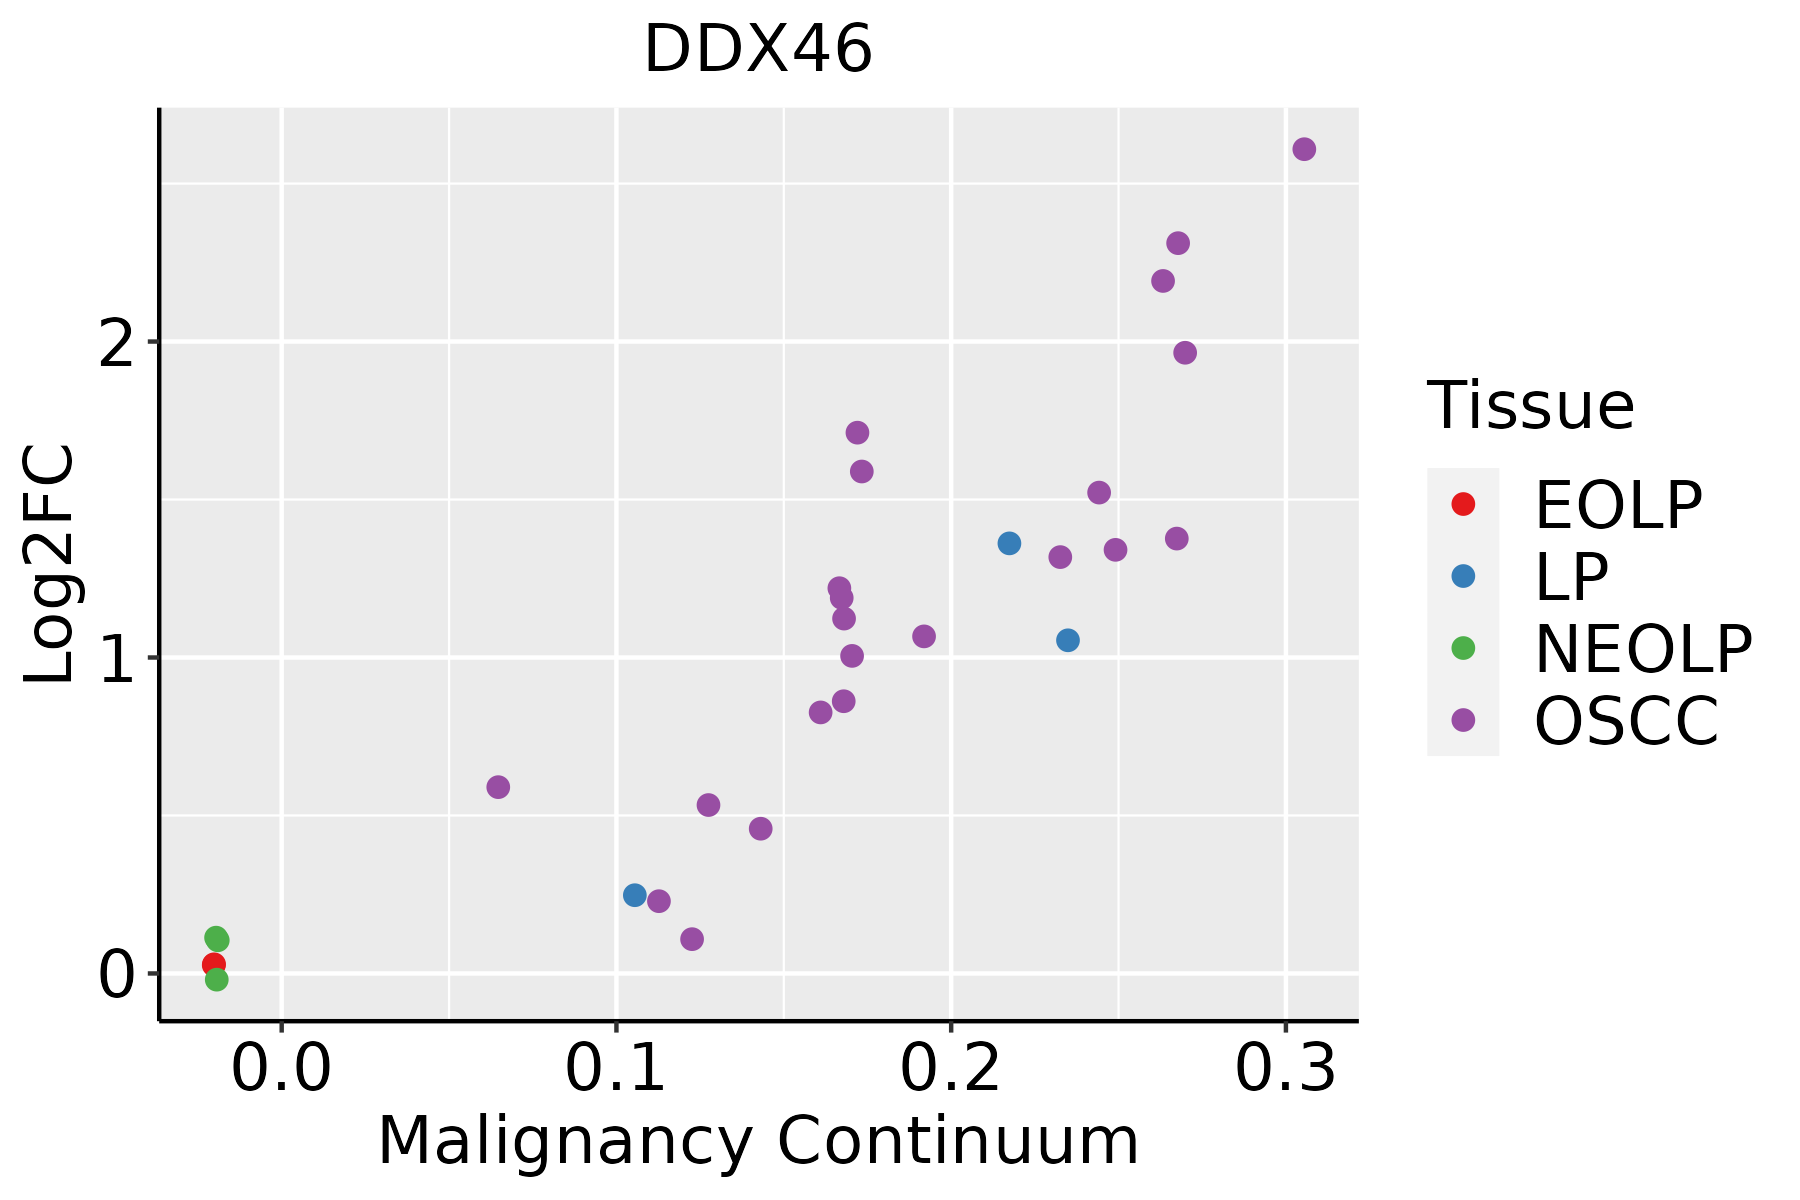 | EOLP: Erosive Oral lichen planus |
| LP: leukoplakia | ||
| NEOLP: Non-erosive oral lichen planus | ||
| OSCC: Oral squamous cell carcinoma | ||
| Prostate |  | BPH: Benign Prostatic Hyperplasia |
| Skin |  | AK: Actinic keratosis |
| cSCC: Cutaneous squamous cell carcinoma | ||
| SCCIS:squamous cell carcinoma in situ | ||
| Thyroid |  | ATC: Anaplastic thyroid cancer |
| HT: Hashimoto's thyroiditis | ||
| PTC: Papillary thyroid cancer |
| ∗log2FC in expression of this searched gene in stem-like cells from each diseased tissue sample relative to stem-like cells in normal samples in each tissue plotted against the malignancy continuum. Samples are colored based on if they are from different disease stage. |
Top |
Malignant transformation related pathway analysis |
| Find out the enriched GO biological processes and KEGG pathways involved in transition from healthy to precancer to cancer |
| Tissue | Disease Stage | Enriched GO biological Processes |
| Colorectum | AD |  |
| Colorectum | SER |  |
| Colorectum | MSS |  |
| Colorectum | MSI-H |  |
| Colorectum | FAP |  |
| ∗Top 15 enriched GO BP terms are showed in the bar plot of each disease state in each tissue. Each row represents a significant GO biological process which is colored according to the -log10(p.adjust). |
| Page: 1 2 3 4 5 6 7 8 9 |
| GO ID | Tissue | Disease Stage | Description | Gene Ratio | Bg Ratio | pvalue | p.adjust | Count |
| GO:0008380 | Colorectum | AD | RNA splicing | 169/3918 | 434/18723 | 3.59e-18 | 2.04e-15 | 169 |
| GO:0000377 | Colorectum | AD | RNA splicing, via transesterification reactions with bulged adenosine as nucleophile | 130/3918 | 320/18723 | 5.88e-16 | 2.16e-13 | 130 |
| GO:0000398 | Colorectum | AD | mRNA splicing, via spliceosome | 130/3918 | 320/18723 | 5.88e-16 | 2.16e-13 | 130 |
| GO:0000375 | Colorectum | AD | RNA splicing, via transesterification reactions | 131/3918 | 324/18723 | 7.11e-16 | 2.22e-13 | 131 |
| GO:00083803 | Colorectum | MSI-H | RNA splicing | 82/1319 | 434/18723 | 1.22e-16 | 4.53e-14 | 82 |
| GO:00003753 | Colorectum | MSI-H | RNA splicing, via transesterification reactions | 67/1319 | 324/18723 | 7.99e-16 | 2.61e-13 | 67 |
| GO:00003773 | Colorectum | MSI-H | RNA splicing, via transesterification reactions with bulged adenosine as nucleophile | 66/1319 | 320/18723 | 1.51e-15 | 4.41e-13 | 66 |
| GO:00003983 | Colorectum | MSI-H | mRNA splicing, via spliceosome | 66/1319 | 320/18723 | 1.51e-15 | 4.41e-13 | 66 |
| GO:00083804 | Colorectum | FAP | RNA splicing | 108/2622 | 434/18723 | 7.90e-10 | 1.86e-07 | 108 |
| GO:00003754 | Colorectum | FAP | RNA splicing, via transesterification reactions | 84/2622 | 324/18723 | 8.06e-09 | 1.10e-06 | 84 |
| GO:00003774 | Colorectum | FAP | RNA splicing, via transesterification reactions with bulged adenosine as nucleophile | 83/2622 | 320/18723 | 9.66e-09 | 1.23e-06 | 83 |
| GO:00003984 | Colorectum | FAP | mRNA splicing, via spliceosome | 83/2622 | 320/18723 | 9.66e-09 | 1.23e-06 | 83 |
| GO:00083805 | Colorectum | CRC | RNA splicing | 90/2078 | 434/18723 | 2.80e-09 | 7.97e-07 | 90 |
| GO:00003775 | Colorectum | CRC | RNA splicing, via transesterification reactions with bulged adenosine as nucleophile | 66/2078 | 320/18723 | 4.39e-07 | 3.37e-05 | 66 |
| GO:00003985 | Colorectum | CRC | mRNA splicing, via spliceosome | 66/2078 | 320/18723 | 4.39e-07 | 3.37e-05 | 66 |
| GO:00003755 | Colorectum | CRC | RNA splicing, via transesterification reactions | 66/2078 | 324/18723 | 7.00e-07 | 4.61e-05 | 66 |
| GO:000838026 | Esophagus | HGIN | RNA splicing | 160/2587 | 434/18723 | 3.74e-34 | 1.12e-30 | 160 |
| GO:000037520 | Esophagus | HGIN | RNA splicing, via transesterification reactions | 115/2587 | 324/18723 | 3.16e-23 | 3.80e-20 | 115 |
| GO:000037720 | Esophagus | HGIN | RNA splicing, via transesterification reactions with bulged adenosine as nucleophile | 113/2587 | 320/18723 | 1.24e-22 | 9.26e-20 | 113 |
| GO:000039820 | Esophagus | HGIN | mRNA splicing, via spliceosome | 113/2587 | 320/18723 | 1.24e-22 | 9.26e-20 | 113 |
| Page: 1 2 3 4 |
| Pathway ID | Tissue | Disease Stage | Description | Gene Ratio | Bg Ratio | pvalue | p.adjust | qvalue | Count |
| hsa03040 | Colorectum | AD | Spliceosome | 73/2092 | 217/8465 | 1.73e-03 | 9.68e-03 | 6.18e-03 | 73 |
| hsa030401 | Colorectum | AD | Spliceosome | 73/2092 | 217/8465 | 1.73e-03 | 9.68e-03 | 6.18e-03 | 73 |
| hsa030404 | Colorectum | MSI-H | Spliceosome | 37/797 | 217/8465 | 2.49e-04 | 3.23e-03 | 2.70e-03 | 37 |
| hsa030405 | Colorectum | MSI-H | Spliceosome | 37/797 | 217/8465 | 2.49e-04 | 3.23e-03 | 2.70e-03 | 37 |
| hsa0304018 | Esophagus | HGIN | Spliceosome | 79/1383 | 217/8465 | 3.22e-13 | 7.00e-12 | 5.56e-12 | 79 |
| hsa0304019 | Esophagus | HGIN | Spliceosome | 79/1383 | 217/8465 | 3.22e-13 | 7.00e-12 | 5.56e-12 | 79 |
| hsa0304027 | Esophagus | ESCC | Spliceosome | 128/4205 | 217/8465 | 3.31e-03 | 8.79e-03 | 4.50e-03 | 128 |
| hsa0304037 | Esophagus | ESCC | Spliceosome | 128/4205 | 217/8465 | 3.31e-03 | 8.79e-03 | 4.50e-03 | 128 |
| hsa030407 | Liver | Cirrhotic | Spliceosome | 102/2530 | 217/8465 | 5.69e-08 | 9.47e-07 | 5.84e-07 | 102 |
| hsa0304012 | Liver | Cirrhotic | Spliceosome | 102/2530 | 217/8465 | 5.69e-08 | 9.47e-07 | 5.84e-07 | 102 |
| hsa0304022 | Liver | HCC | Spliceosome | 122/4020 | 217/8465 | 5.55e-03 | 1.60e-02 | 8.91e-03 | 122 |
| hsa0304032 | Liver | HCC | Spliceosome | 122/4020 | 217/8465 | 5.55e-03 | 1.60e-02 | 8.91e-03 | 122 |
| hsa0304016 | Oral cavity | OSCC | Spliceosome | 123/3704 | 217/8465 | 7.21e-05 | 2.74e-04 | 1.40e-04 | 123 |
| hsa0304017 | Oral cavity | OSCC | Spliceosome | 123/3704 | 217/8465 | 7.21e-05 | 2.74e-04 | 1.40e-04 | 123 |
| hsa0304026 | Oral cavity | LP | Spliceosome | 106/2418 | 217/8465 | 1.30e-10 | 2.40e-09 | 1.55e-09 | 106 |
| hsa0304036 | Oral cavity | LP | Spliceosome | 106/2418 | 217/8465 | 1.30e-10 | 2.40e-09 | 1.55e-09 | 106 |
| hsa0304010 | Prostate | BPH | Spliceosome | 62/1718 | 217/8465 | 1.99e-03 | 7.92e-03 | 4.90e-03 | 62 |
| hsa0304015 | Prostate | BPH | Spliceosome | 62/1718 | 217/8465 | 1.99e-03 | 7.92e-03 | 4.90e-03 | 62 |
| hsa0304025 | Prostate | Tumor | Spliceosome | 66/1791 | 217/8465 | 7.53e-04 | 3.59e-03 | 2.23e-03 | 66 |
| hsa0304035 | Prostate | Tumor | Spliceosome | 66/1791 | 217/8465 | 7.53e-04 | 3.59e-03 | 2.23e-03 | 66 |
| Page: 1 |
Top |
Cell-cell communication analysis |
| Identification of potential cell-cell interactions between two cell types and their ligand-receptor pairs for different disease states |
| Ligand | Receptor | LRpair | Pathway | Tissue | Disease Stage |
| Page: 1 |
Top |
Single-cell gene regulatory network inference analysis |
| Find out the significant the regulons (TFs) and the target genes of each regulon across cell types for different disease states |
| TF | Cell Type | Tissue | Disease Stage | Target Gene | RSS | Regulon Activity |
| ∗The dot plots of a searched regulon are shown for all cell subpopulations in each disease state of each tissue based on the regulon specific score inferred using pySCENIC and by calculating the average expression. |
| Page: 1 |
Top |
Somatic mutation of malignant transformation related genes |
| Annotation of somatic variants for genes involved in malignant transformation |
| Hugo Symbol | Variant Class | Variant Classification | dbSNP RS | HGVSc | HGVSp | HGVSp Short | SWISSPROT | BIOTYPE | SIFT | PolyPhen | Tumor Sample Barcode | Tissue | Histology | Sex | Age | Stage | Therapy Types | Drugs | Outcome |
| DDX46 | SNV | Missense_Mutation | novel | c.1570A>T | p.Thr524Ser | p.T524S | protein_coding | deleterious(0.03) | probably_damaging(0.971) | TCGA-AC-A8OP-01 | Breast | breast invasive carcinoma | Female | >=65 | I/II | Unknown | Unknown | SD | |
| DDX46 | SNV | Missense_Mutation | rs188688500 | c.257N>A | p.Arg86Gln | p.R86Q | protein_coding | tolerated(0.31) | benign(0.05) | TCGA-AN-A046-01 | Breast | breast invasive carcinoma | Female | >=65 | I/II | Unknown | Unknown | SD | |
| DDX46 | SNV | Missense_Mutation | novel | c.2421N>T | p.Glu807Asp | p.E807D | protein_coding | tolerated(0.4) | possibly_damaging(0.457) | TCGA-AN-A046-01 | Breast | breast invasive carcinoma | Female | >=65 | I/II | Unknown | Unknown | SD | |
| DDX46 | SNV | Missense_Mutation | c.3083N>A | p.Arg1028Lys | p.R1028K | protein_coding | tolerated(0.17) | probably_damaging(0.997) | TCGA-EW-A1J5-01 | Breast | breast invasive carcinoma | Female | <65 | I/II | Chemotherapy | adriamycin | SD | ||
| DDX46 | insertion | Frame_Shift_Ins | novel | c.574_575insCTTTCTTTCTTTTTGTCTTTCTT | p.Met192ThrfsTer9 | p.M192Tfs*9 | protein_coding | TCGA-AO-A03T-01 | Breast | breast invasive carcinoma | Female | <65 | I/II | Chemotherapy | cyclophosphamide | SD | |||
| DDX46 | SNV | Missense_Mutation | rs367926830 | c.200G>A | p.Arg67His | p.R67H | protein_coding | deleterious(0.02) | benign(0) | TCGA-2W-A8YY-01 | Cervix | cervical & endocervical cancer | Female | <65 | I/II | Chemotherapy | cisplatin | CR | |
| DDX46 | SNV | Missense_Mutation | c.2644N>T | p.Leu882Phe | p.L882F | protein_coding | tolerated(0.08) | benign(0.106) | TCGA-DR-A0ZM-01 | Cervix | cervical & endocervical cancer | Female | <65 | III/IV | Unspecific | Cisplatin | SD | ||
| DDX46 | SNV | Missense_Mutation | c.2539N>A | p.Glu847Lys | p.E847K | protein_coding | tolerated(0.34) | benign(0.281) | TCGA-EK-A2RA-01 | Cervix | cervical & endocervical cancer | Female | >=65 | I/II | Unknown | Unknown | SD | ||
| DDX46 | SNV | Missense_Mutation | novel | c.770N>G | p.Ser257Cys | p.S257C | protein_coding | deleterious(0.01) | possibly_damaging(0.753) | TCGA-PN-A8MA-01 | Cervix | cervical & endocervical cancer | Female | <65 | I/II | Chemotherapy | cisplatin | SD | |
| DDX46 | SNV | Missense_Mutation | c.1236N>C | p.Leu412Phe | p.L412F | protein_coding | deleterious(0.02) | possibly_damaging(0.804) | TCGA-Q1-A73Q-01 | Cervix | cervical & endocervical cancer | Female | <65 | I/II | Chemotherapy | cisplatin | SD |
| Page: 1 2 3 4 5 6 7 8 9 10 |
Top |
Related drugs of malignant transformation related genes |
| Identification of chemicals and drugs interact with genes involved in malignant transfromation |
| (DGIdb 4.0) |
| Entrez ID | Symbol | Category | Interaction Types | Drug Claim Name | Drug Name | PMIDs |
| Page: 1 |

Copyright 2023-Present -The University of Texas Health Science Center at Houston |