
|
|||||
|
 | |
| |
| |
| |
| |
| |
|
Gene: DDX3Y |
Gene summary for DDX3Y |
| Gene information | Species | Human | Gene symbol | DDX3Y | Gene ID | 8653 |
| Gene name | DEAD-box helicase 3 Y-linked | |
| Gene Alias | DBY | |
| Cytomap | Yq11.221 | |
| Gene Type | protein-coding | GO ID | GO:0000003 | UniProtAcc | A0A024R9A4 |
Top |
Malignant transformation analysis |
| Identification of the aberrant gene expression in precancerous and cancerous lesions by comparing the gene expression of stem-like cells in diseased tissues with normal stem cells |
| Entrez ID | Symbol | Replicates | Species | Organ | Tissue | Adj P-value | Log2FC | Malignancy |
| 8653 | DDX3Y | LZE4T | Human | Esophagus | ESCC | 1.82e-17 | 7.45e-01 | 0.0811 |
| 8653 | DDX3Y | LZE8T | Human | Esophagus | ESCC | 6.22e-03 | -3.81e-01 | 0.067 |
| 8653 | DDX3Y | LZE24T | Human | Esophagus | ESCC | 1.52e-02 | -3.35e-01 | 0.0596 |
| 8653 | DDX3Y | P2T-E | Human | Esophagus | ESCC | 4.12e-11 | -3.81e-01 | 0.1177 |
| 8653 | DDX3Y | P4T-E | Human | Esophagus | ESCC | 3.94e-06 | -3.81e-01 | 0.1323 |
| 8653 | DDX3Y | P5T-E | Human | Esophagus | ESCC | 1.74e-04 | 7.54e-02 | 0.1327 |
| 8653 | DDX3Y | P8T-E | Human | Esophagus | ESCC | 1.76e-12 | -3.81e-01 | 0.0889 |
| 8653 | DDX3Y | P10T-E | Human | Esophagus | ESCC | 1.81e-07 | 3.74e-01 | 0.116 |
| 8653 | DDX3Y | P12T-E | Human | Esophagus | ESCC | 4.30e-14 | 2.15e-01 | 0.1122 |
| 8653 | DDX3Y | P15T-E | Human | Esophagus | ESCC | 2.54e-07 | -3.81e-01 | 0.1149 |
| 8653 | DDX3Y | P16T-E | Human | Esophagus | ESCC | 3.89e-12 | -3.81e-01 | 0.1153 |
| 8653 | DDX3Y | P20T-E | Human | Esophagus | ESCC | 4.31e-11 | -1.08e-01 | 0.1124 |
| 8653 | DDX3Y | P21T-E | Human | Esophagus | ESCC | 4.95e-07 | -2.55e-01 | 0.1617 |
| 8653 | DDX3Y | P22T-E | Human | Esophagus | ESCC | 7.02e-08 | 2.24e-02 | 0.1236 |
| 8653 | DDX3Y | P23T-E | Human | Esophagus | ESCC | 1.51e-08 | 1.39e-01 | 0.108 |
| 8653 | DDX3Y | P24T-E | Human | Esophagus | ESCC | 1.62e-15 | -2.52e-01 | 0.1287 |
| 8653 | DDX3Y | P26T-E | Human | Esophagus | ESCC | 6.49e-08 | -3.46e-01 | 0.1276 |
| 8653 | DDX3Y | P27T-E | Human | Esophagus | ESCC | 1.01e-06 | -3.50e-01 | 0.1055 |
| 8653 | DDX3Y | P28T-E | Human | Esophagus | ESCC | 9.04e-16 | 1.89e-01 | 0.1149 |
| 8653 | DDX3Y | P31T-E | Human | Esophagus | ESCC | 4.06e-09 | -3.66e-01 | 0.1251 |
| Page: 1 2 3 4 5 |
| Tissue | Expression Dynamics | Abbreviation |
| Esophagus | 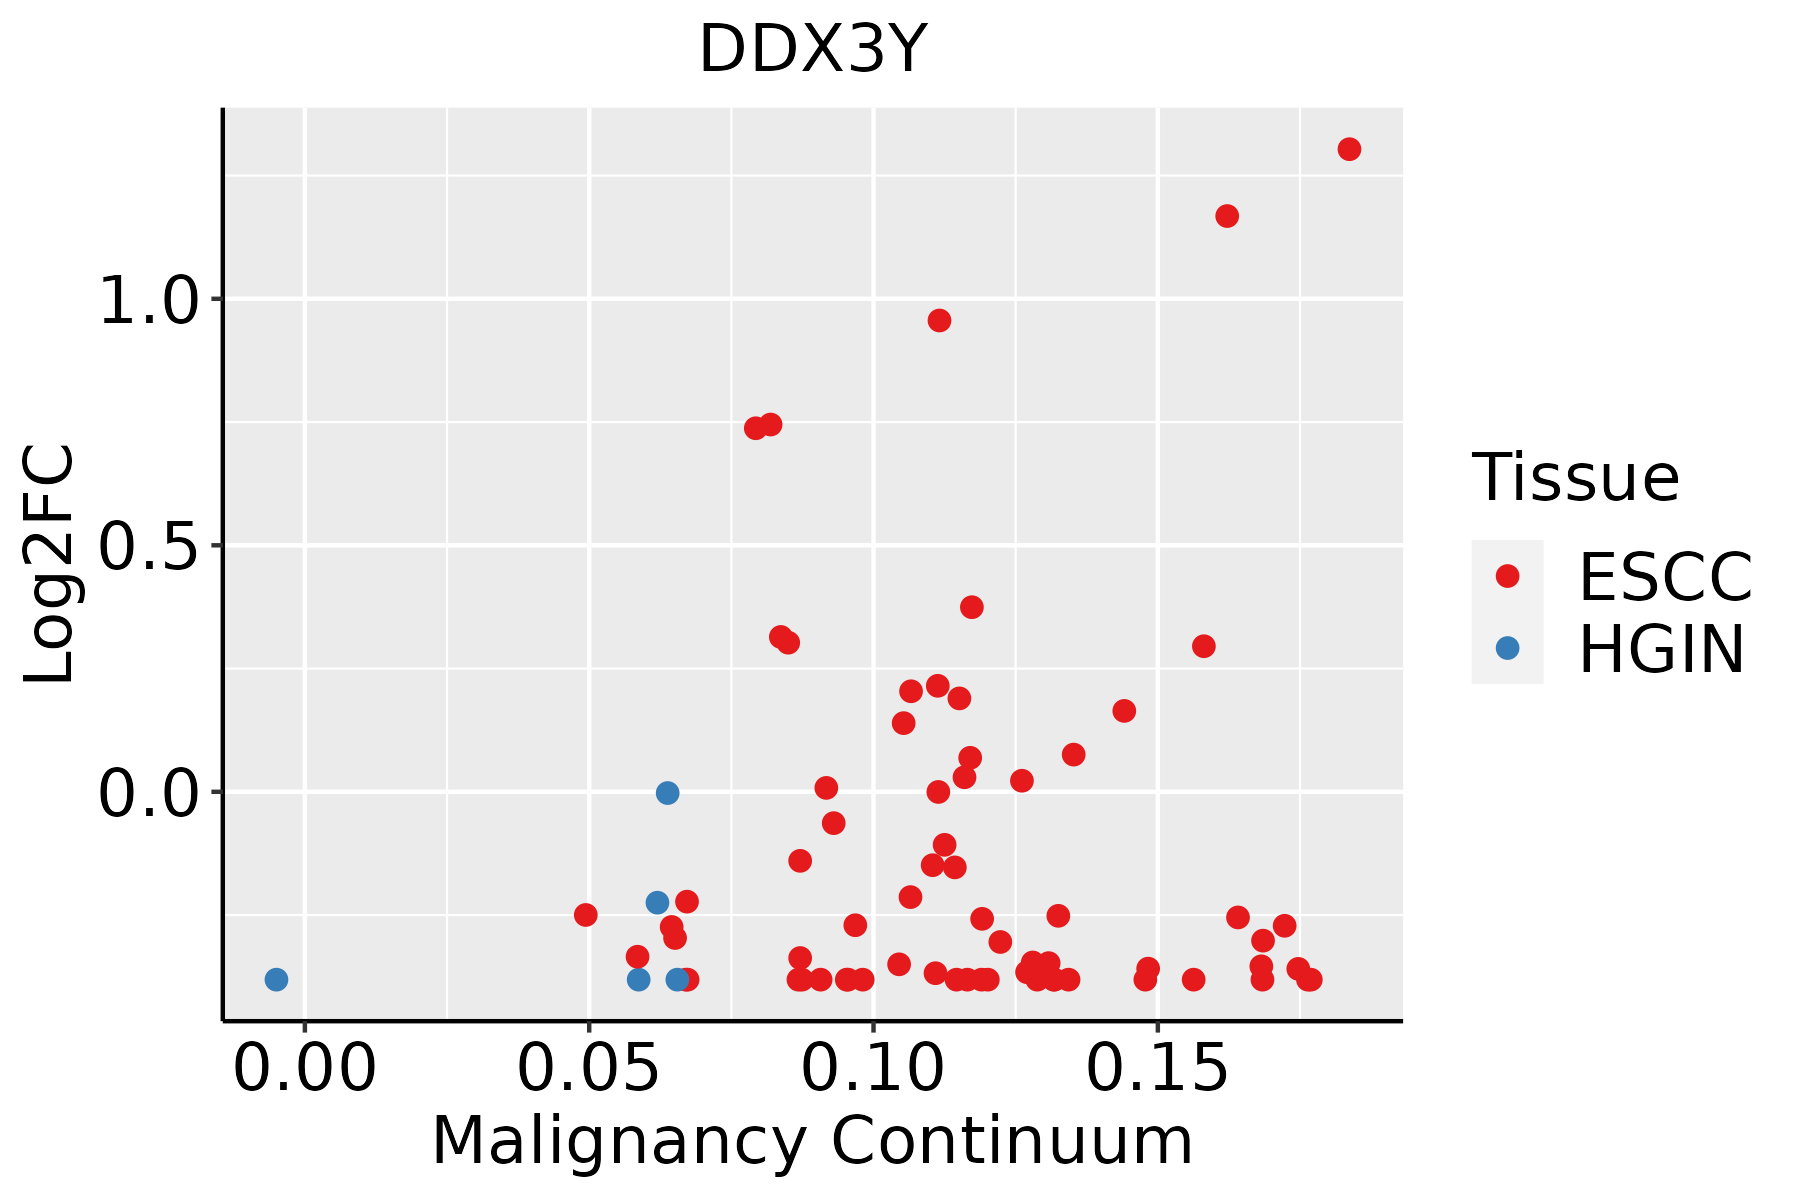 | ESCC: Esophageal squamous cell carcinoma |
| HGIN: High-grade intraepithelial neoplasias | ||
| LGIN: Low-grade intraepithelial neoplasias | ||
| Liver | 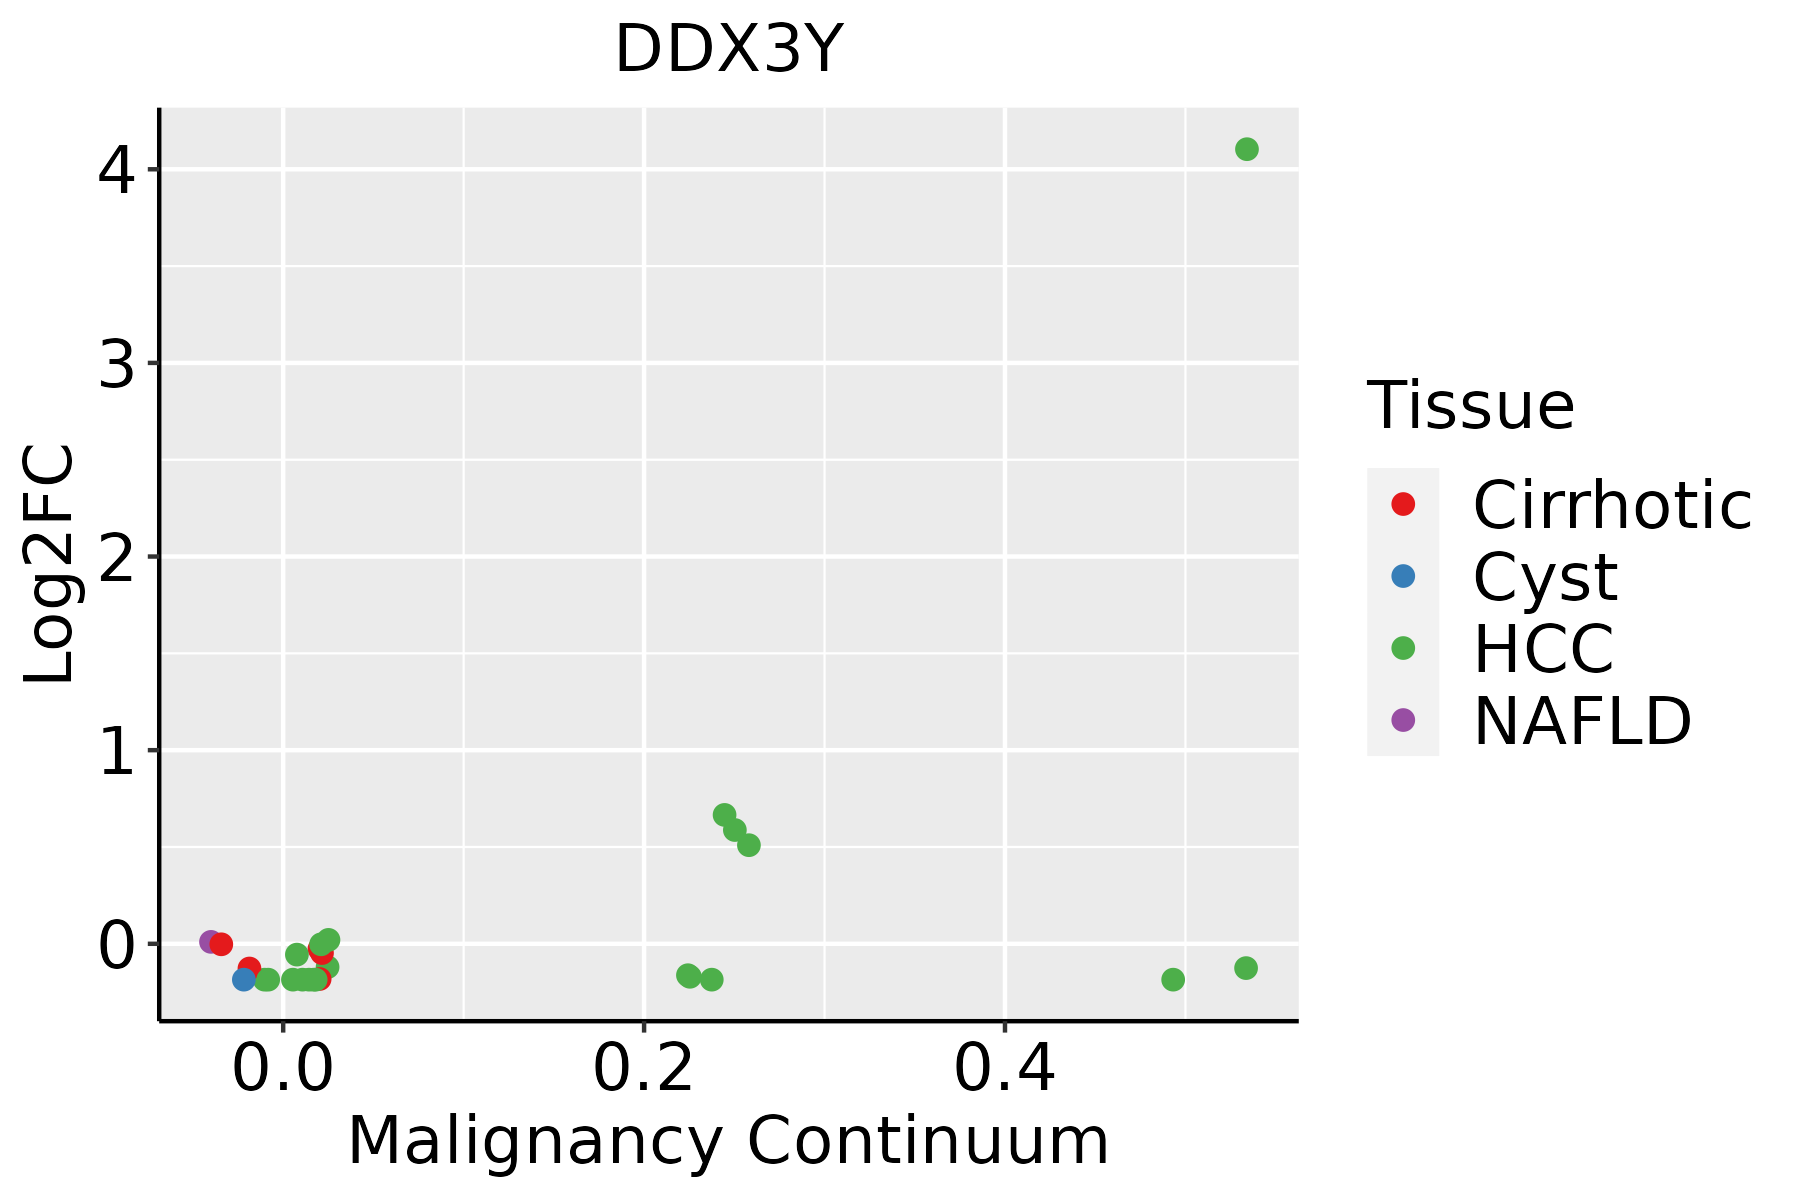 | HCC: Hepatocellular carcinoma |
| NAFLD: Non-alcoholic fatty liver disease | ||
| Oral Cavity | 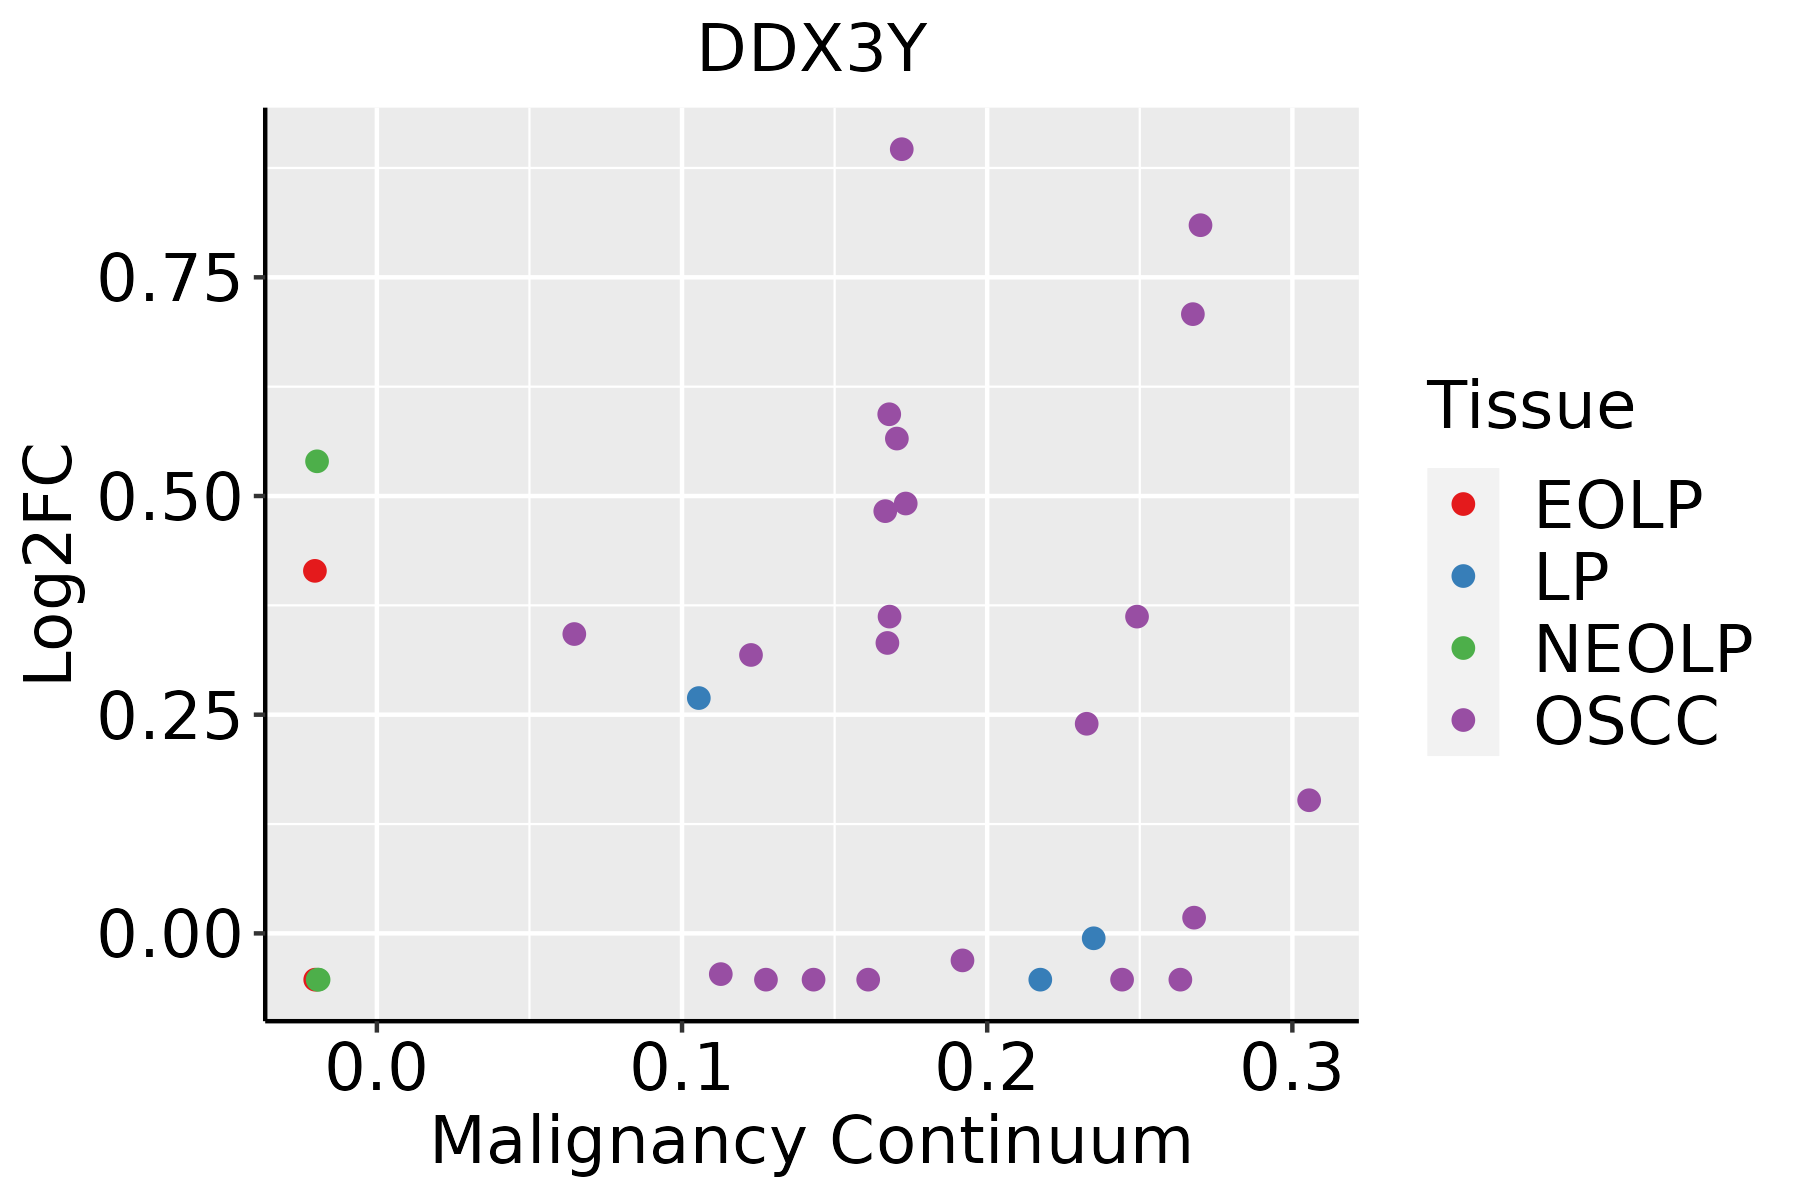 | EOLP: Erosive Oral lichen planus |
| LP: leukoplakia | ||
| NEOLP: Non-erosive oral lichen planus | ||
| OSCC: Oral squamous cell carcinoma | ||
| Prostate |  | BPH: Benign Prostatic Hyperplasia |
| Thyroid | 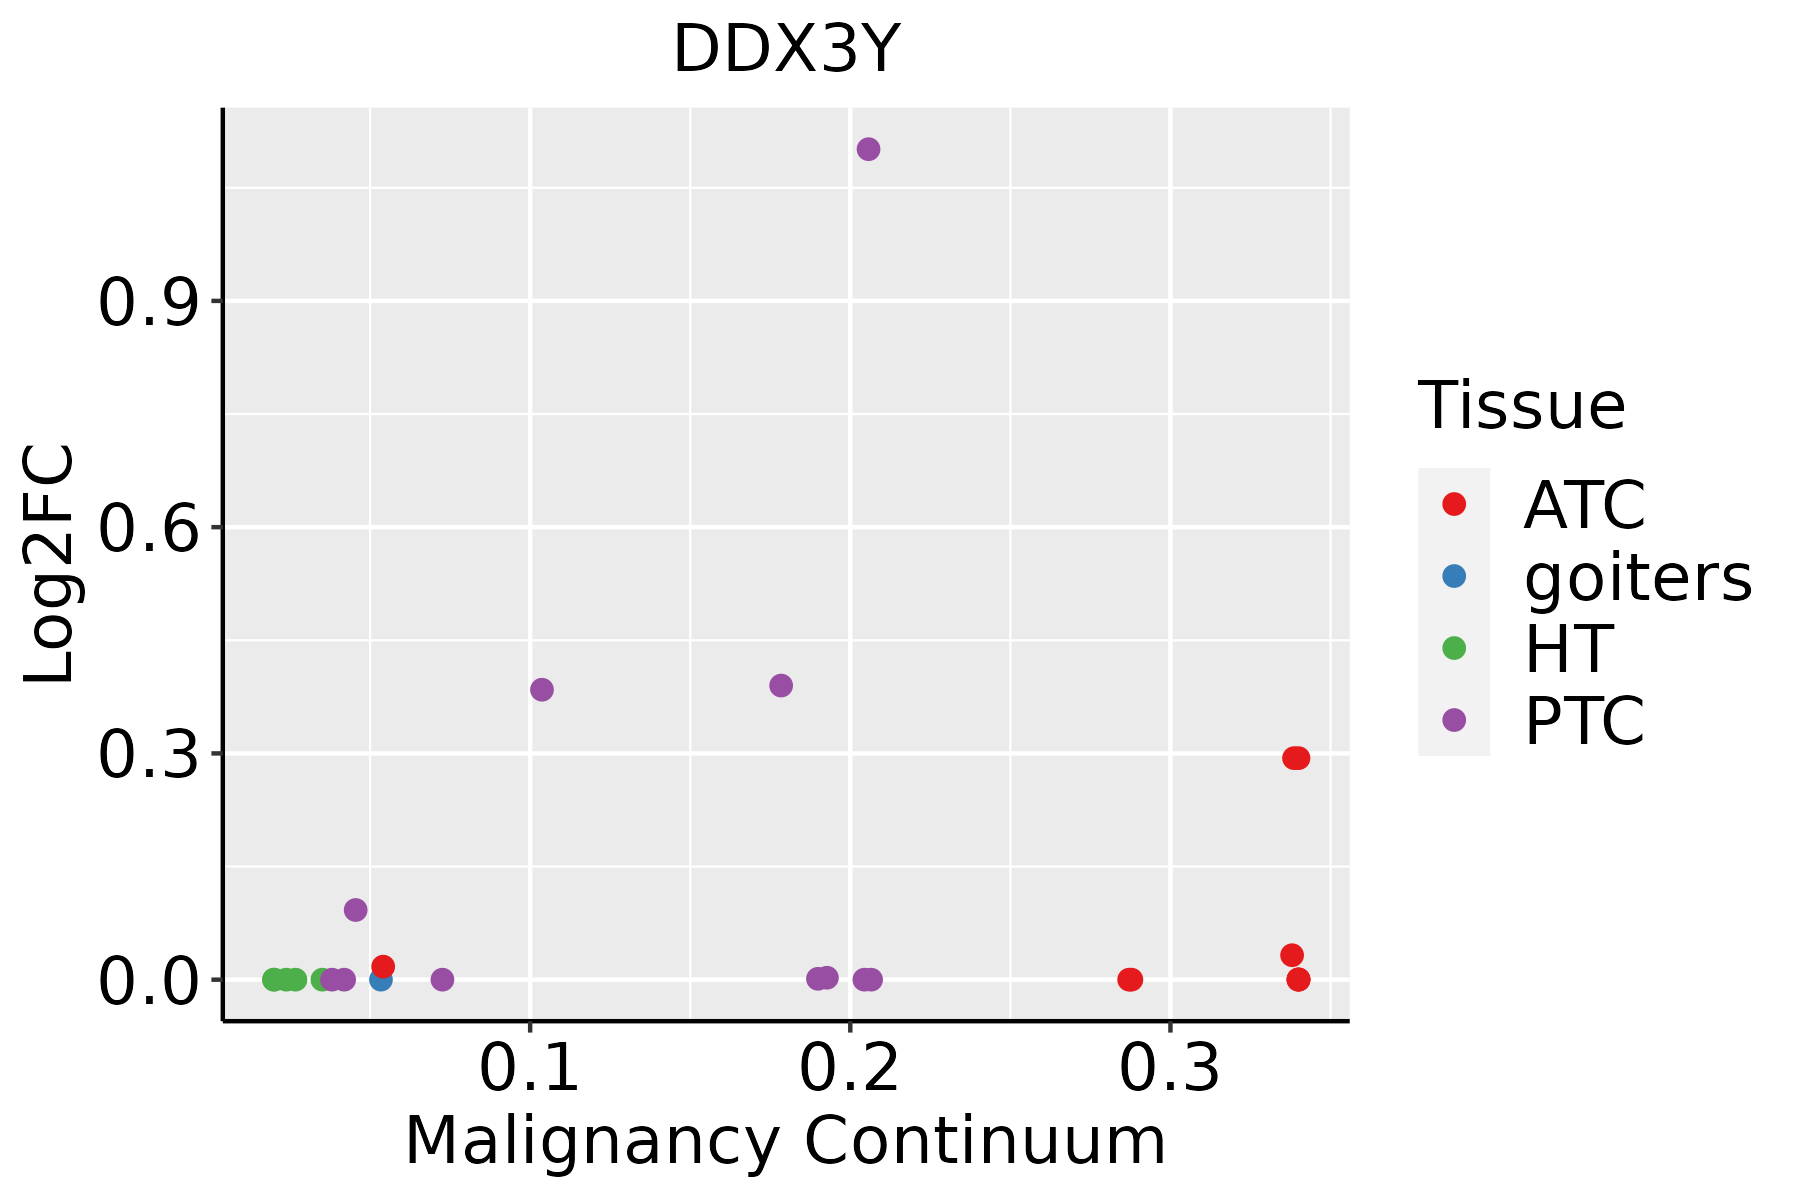 | ATC: Anaplastic thyroid cancer |
| HT: Hashimoto's thyroiditis | ||
| PTC: Papillary thyroid cancer |
| ∗log2FC in expression of this searched gene in stem-like cells from each diseased tissue sample relative to stem-like cells in normal samples in each tissue plotted against the malignancy continuum. Samples are colored based on if they are from different disease stage. |
Top |
Malignant transformation related pathway analysis |
| Find out the enriched GO biological processes and KEGG pathways involved in transition from healthy to precancer to cancer |
| Tissue | Disease Stage | Enriched GO biological Processes |
| Colorectum | AD |  |
| Colorectum | SER |  |
| Colorectum | MSS |  |
| Colorectum | MSI-H |  |
| Colorectum | FAP |  |
| ∗Top 15 enriched GO BP terms are showed in the bar plot of each disease state in each tissue. Each row represents a significant GO biological process which is colored according to the -log10(p.adjust). |
| Page: 1 2 3 4 5 6 7 8 9 |
| GO ID | Tissue | Disease Stage | Description | Gene Ratio | Bg Ratio | pvalue | p.adjust | Count |
| Page: 1 |
| Pathway ID | Tissue | Disease Stage | Description | Gene Ratio | Bg Ratio | pvalue | p.adjust | qvalue | Count |
| Page: 1 |
Top |
Cell-cell communication analysis |
| Identification of potential cell-cell interactions between two cell types and their ligand-receptor pairs for different disease states |
| Ligand | Receptor | LRpair | Pathway | Tissue | Disease Stage |
| Page: 1 |
Top |
Single-cell gene regulatory network inference analysis |
| Find out the significant the regulons (TFs) and the target genes of each regulon across cell types for different disease states |
| TF | Cell Type | Tissue | Disease Stage | Target Gene | RSS | Regulon Activity |
| ∗The dot plots of a searched regulon are shown for all cell subpopulations in each disease state of each tissue based on the regulon specific score inferred using pySCENIC and by calculating the average expression. |
| Page: 1 |
Top |
Somatic mutation of malignant transformation related genes |
| Annotation of somatic variants for genes involved in malignant transformation |
| Hugo Symbol | Variant Class | Variant Classification | dbSNP RS | HGVSc | HGVSp | HGVSp Short | SWISSPROT | BIOTYPE | SIFT | PolyPhen | Tumor Sample Barcode | Tissue | Histology | Sex | Age | Stage | Therapy Types | Drugs | Outcome |
| DDX3Y | SNV | Missense_Mutation | c.1211G>T | p.Gly404Val | p.G404V | O15523 | protein_coding | deleterious(0) | probably_damaging(1) | TCGA-A6-6653-01 | Colorectum | colon adenocarcinoma | Male | >=65 | I/II | Unknown | Unknown | SD | |
| DDX3Y | SNV | Missense_Mutation | novel | c.938G>A | p.Arg313His | p.R313H | O15523 | protein_coding | deleterious(0.05) | benign(0.125) | TCGA-AZ-4315-01 | Colorectum | colon adenocarcinoma | Male | <65 | I/II | Unknown | Unknown | SD |
| DDX3Y | insertion | In_Frame_Ins | rs751609060 | c.180_181insACC | p.Trp60_Ser61insThr | p.W60_S61insT | O15523 | protein_coding | TCGA-A6-6141-01 | Colorectum | colon adenocarcinoma | Male | <65 | I/II | Chemotherapy | 5-fu | SD | ||
| DDX3Y | insertion | Frame_Shift_Ins | novel | c.1958_1959insG | p.Val655GlyfsTer2 | p.V655Gfs*2 | O15523 | protein_coding | TCGA-AA-3495-01 | Colorectum | colon adenocarcinoma | Male | >=65 | I/II | Unknown | Unknown | SD | ||
| DDX3Y | SNV | Missense_Mutation | novel | c.778N>T | p.Arg260Cys | p.R260C | O15523 | protein_coding | deleterious(0.03) | probably_damaging(0.925) | TCGA-4R-AA8I-01 | Liver | liver hepatocellular carcinoma | Male | >=65 | I/II | Unknown | Unknown | PD |
| DDX3Y | SNV | Missense_Mutation | novel | c.1769N>C | p.Arg590Thr | p.R590T | O15523 | protein_coding | deleterious(0.03) | probably_damaging(0.917) | TCGA-DD-AADV-01 | Liver | liver hepatocellular carcinoma | Male | <65 | I/II | Unknown | Unknown | SD |
| DDX3Y | SNV | Missense_Mutation | c.302G>T | p.Ser101Ile | p.S101I | O15523 | protein_coding | tolerated(0.19) | benign(0.01) | TCGA-MI-A75I-01 | Liver | liver hepatocellular carcinoma | Male | <65 | I/II | Unknown | Unknown | PD | |
| DDX3Y | SNV | Missense_Mutation | c.107N>A | p.Gly36Glu | p.G36E | O15523 | protein_coding | tolerated(0.18) | benign(0.276) | TCGA-55-7570-01 | Lung | lung adenocarcinoma | Male | <65 | I/II | Unknown | Unknown | SD | |
| DDX3Y | SNV | Missense_Mutation | c.244N>C | p.Gly82Arg | p.G82R | O15523 | protein_coding | tolerated(0.09) | benign(0) | TCGA-22-4595-01 | Lung | lung squamous cell carcinoma | Male | <65 | III/IV | Chemotherapy | alimta | PD | |
| DDX3Y | SNV | Missense_Mutation | novel | c.1534N>G | p.Ile512Val | p.I512V | O15523 | protein_coding | tolerated(0.22) | possibly_damaging(0.58) | TCGA-58-A46K-01 | Lung | lung squamous cell carcinoma | Male | <65 | III/IV | Chemotherapy | carboplatin | PD |
| Page: 1 2 3 |
Top |
Related drugs of malignant transformation related genes |
| Identification of chemicals and drugs interact with genes involved in malignant transfromation |
| (DGIdb 4.0) |
| Entrez ID | Symbol | Category | Interaction Types | Drug Claim Name | Drug Name | PMIDs |
| Page: 1 |

Copyright 2023-Present -The University of Texas Health Science Center at Houston |