
|
|||||
|
 | |
| |
| |
| |
| |
| |
|
Gene: DDX31 |
Gene summary for DDX31 |
| Gene information | Species | Human | Gene symbol | DDX31 | Gene ID | 64794 |
| Gene name | DEAD-box helicase 31 | |
| Gene Alias | PPP1R25 | |
| Cytomap | 9q34.13 | |
| Gene Type | protein-coding | GO ID | GO:0008150 | UniProtAcc | Q9H8H2 |
Top |
Malignant transformation analysis |
| Identification of the aberrant gene expression in precancerous and cancerous lesions by comparing the gene expression of stem-like cells in diseased tissues with normal stem cells |
| Entrez ID | Symbol | Replicates | Species | Organ | Tissue | Adj P-value | Log2FC | Malignancy |
| 64794 | DDX31 | CCI_2 | Human | Cervix | CC | 2.87e-14 | 7.55e-01 | 0.5249 |
| 64794 | DDX31 | CCI_3 | Human | Cervix | CC | 1.18e-10 | 5.26e-01 | 0.516 |
| 64794 | DDX31 | LZE4T | Human | Esophagus | ESCC | 1.12e-06 | 1.38e-01 | 0.0811 |
| 64794 | DDX31 | LZE24T | Human | Esophagus | ESCC | 3.47e-03 | 5.68e-02 | 0.0596 |
| 64794 | DDX31 | P2T-E | Human | Esophagus | ESCC | 1.51e-13 | 2.32e-01 | 0.1177 |
| 64794 | DDX31 | P4T-E | Human | Esophagus | ESCC | 7.40e-08 | 1.62e-01 | 0.1323 |
| 64794 | DDX31 | P5T-E | Human | Esophagus | ESCC | 2.65e-12 | 2.02e-01 | 0.1327 |
| 64794 | DDX31 | P8T-E | Human | Esophagus | ESCC | 4.62e-10 | 1.85e-01 | 0.0889 |
| 64794 | DDX31 | P9T-E | Human | Esophagus | ESCC | 1.62e-06 | 8.70e-02 | 0.1131 |
| 64794 | DDX31 | P10T-E | Human | Esophagus | ESCC | 2.34e-09 | 1.31e-01 | 0.116 |
| 64794 | DDX31 | P11T-E | Human | Esophagus | ESCC | 2.12e-06 | 1.73e-01 | 0.1426 |
| 64794 | DDX31 | P12T-E | Human | Esophagus | ESCC | 4.35e-07 | 1.06e-01 | 0.1122 |
| 64794 | DDX31 | P15T-E | Human | Esophagus | ESCC | 2.94e-05 | 1.17e-01 | 0.1149 |
| 64794 | DDX31 | P16T-E | Human | Esophagus | ESCC | 1.05e-05 | 1.35e-01 | 0.1153 |
| 64794 | DDX31 | P17T-E | Human | Esophagus | ESCC | 8.70e-04 | 1.39e-01 | 0.1278 |
| 64794 | DDX31 | P20T-E | Human | Esophagus | ESCC | 2.65e-02 | 6.00e-02 | 0.1124 |
| 64794 | DDX31 | P21T-E | Human | Esophagus | ESCC | 1.12e-14 | 3.66e-01 | 0.1617 |
| 64794 | DDX31 | P22T-E | Human | Esophagus | ESCC | 3.60e-06 | 1.39e-01 | 0.1236 |
| 64794 | DDX31 | P23T-E | Human | Esophagus | ESCC | 7.27e-07 | 1.43e-01 | 0.108 |
| 64794 | DDX31 | P24T-E | Human | Esophagus | ESCC | 3.51e-15 | 2.23e-01 | 0.1287 |
| Page: 1 2 3 |
| Tissue | Expression Dynamics | Abbreviation |
| Cervix | 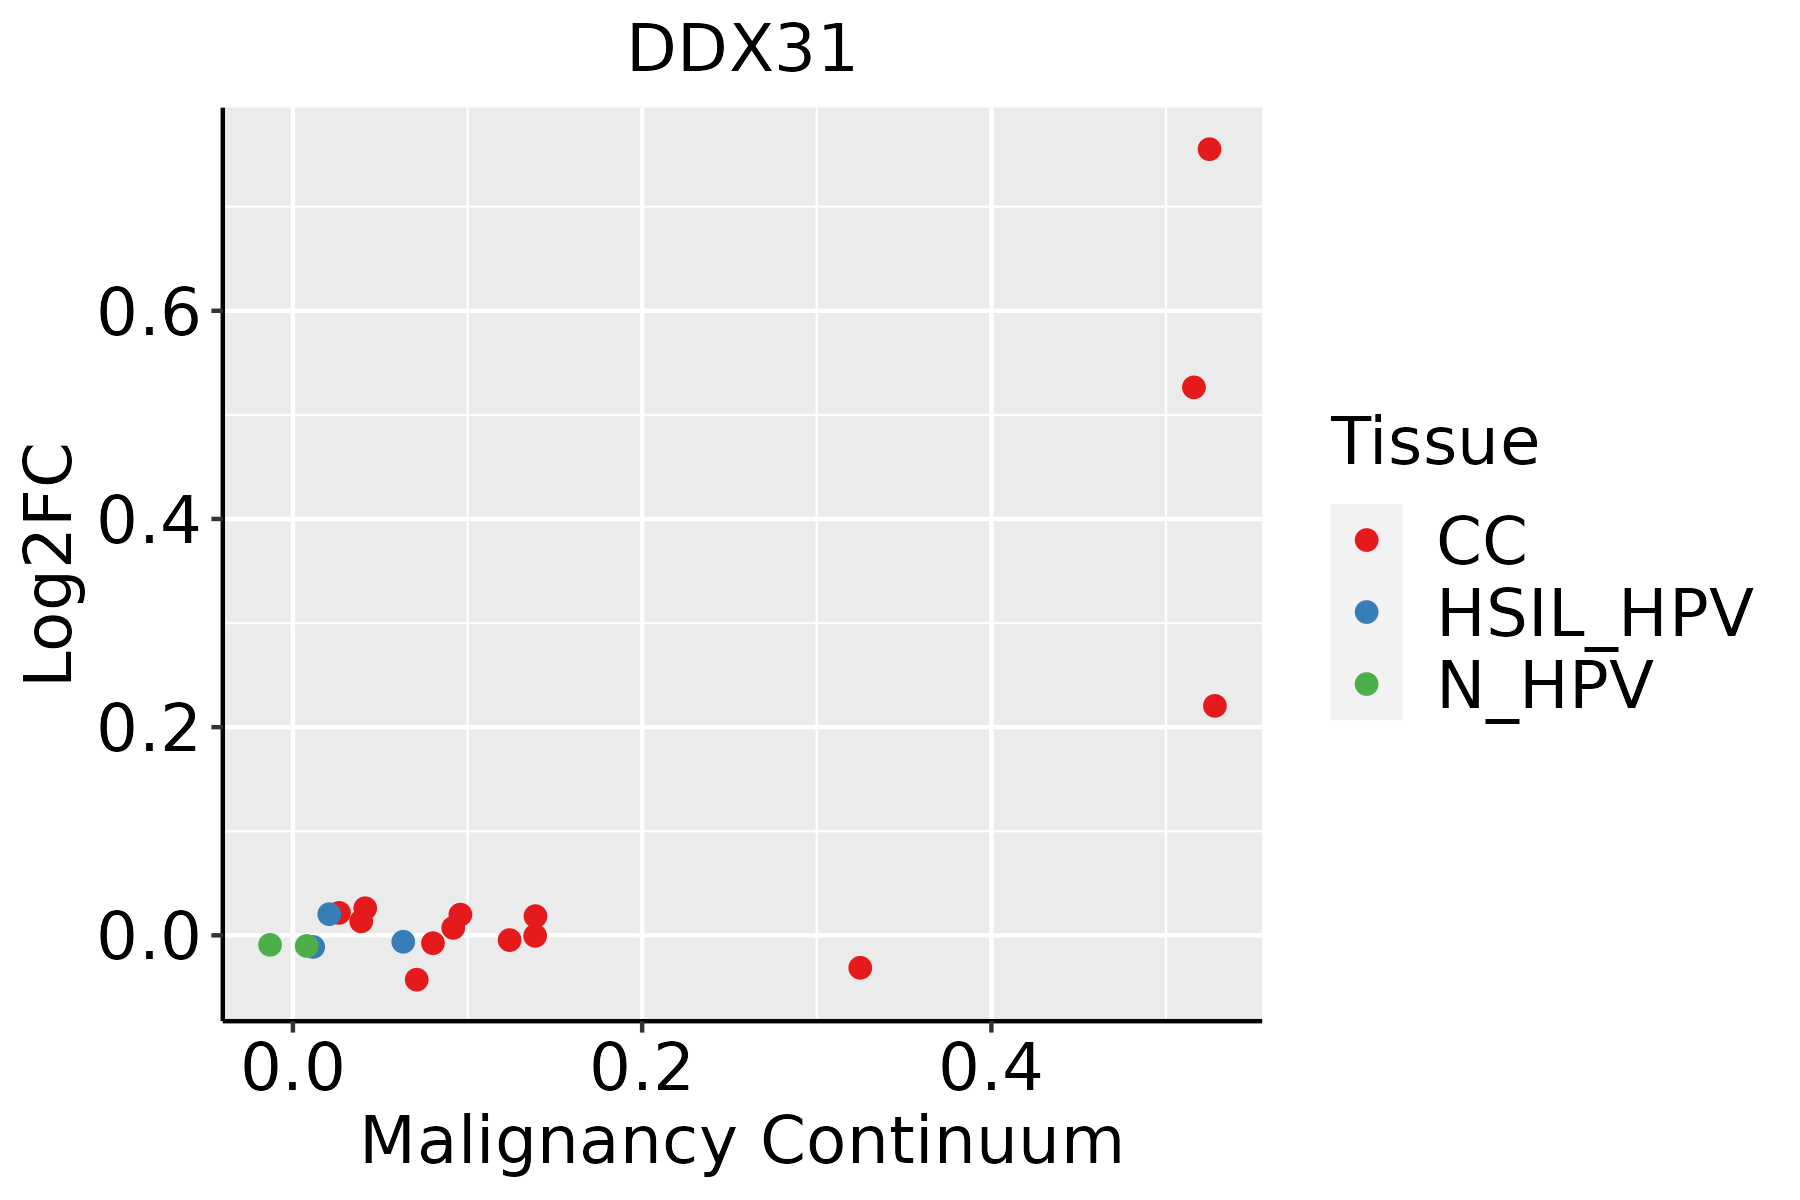 | CC: Cervix cancer |
| HSIL_HPV: HPV-infected high-grade squamous intraepithelial lesions | ||
| N_HPV: HPV-infected normal cervix | ||
| Esophagus | 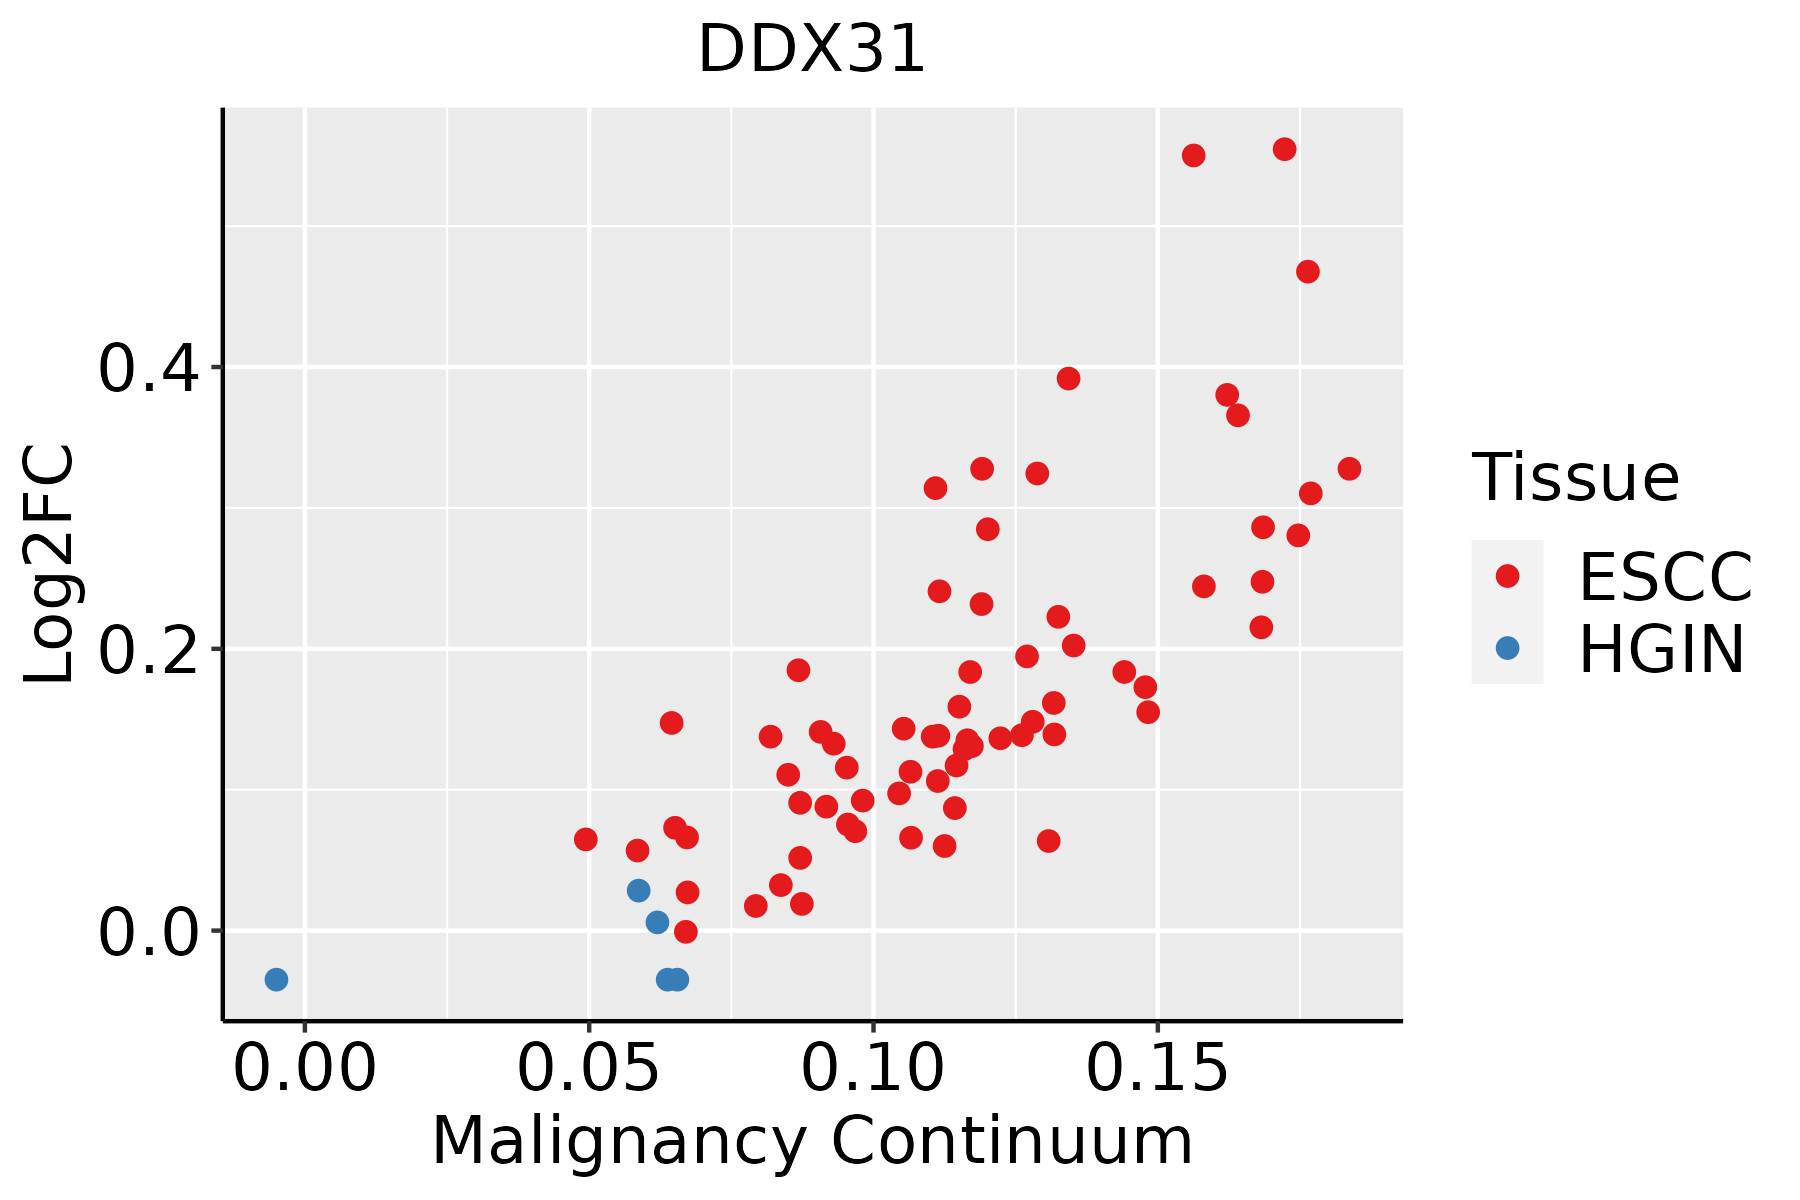 | ESCC: Esophageal squamous cell carcinoma |
| HGIN: High-grade intraepithelial neoplasias | ||
| LGIN: Low-grade intraepithelial neoplasias | ||
| Oral Cavity | 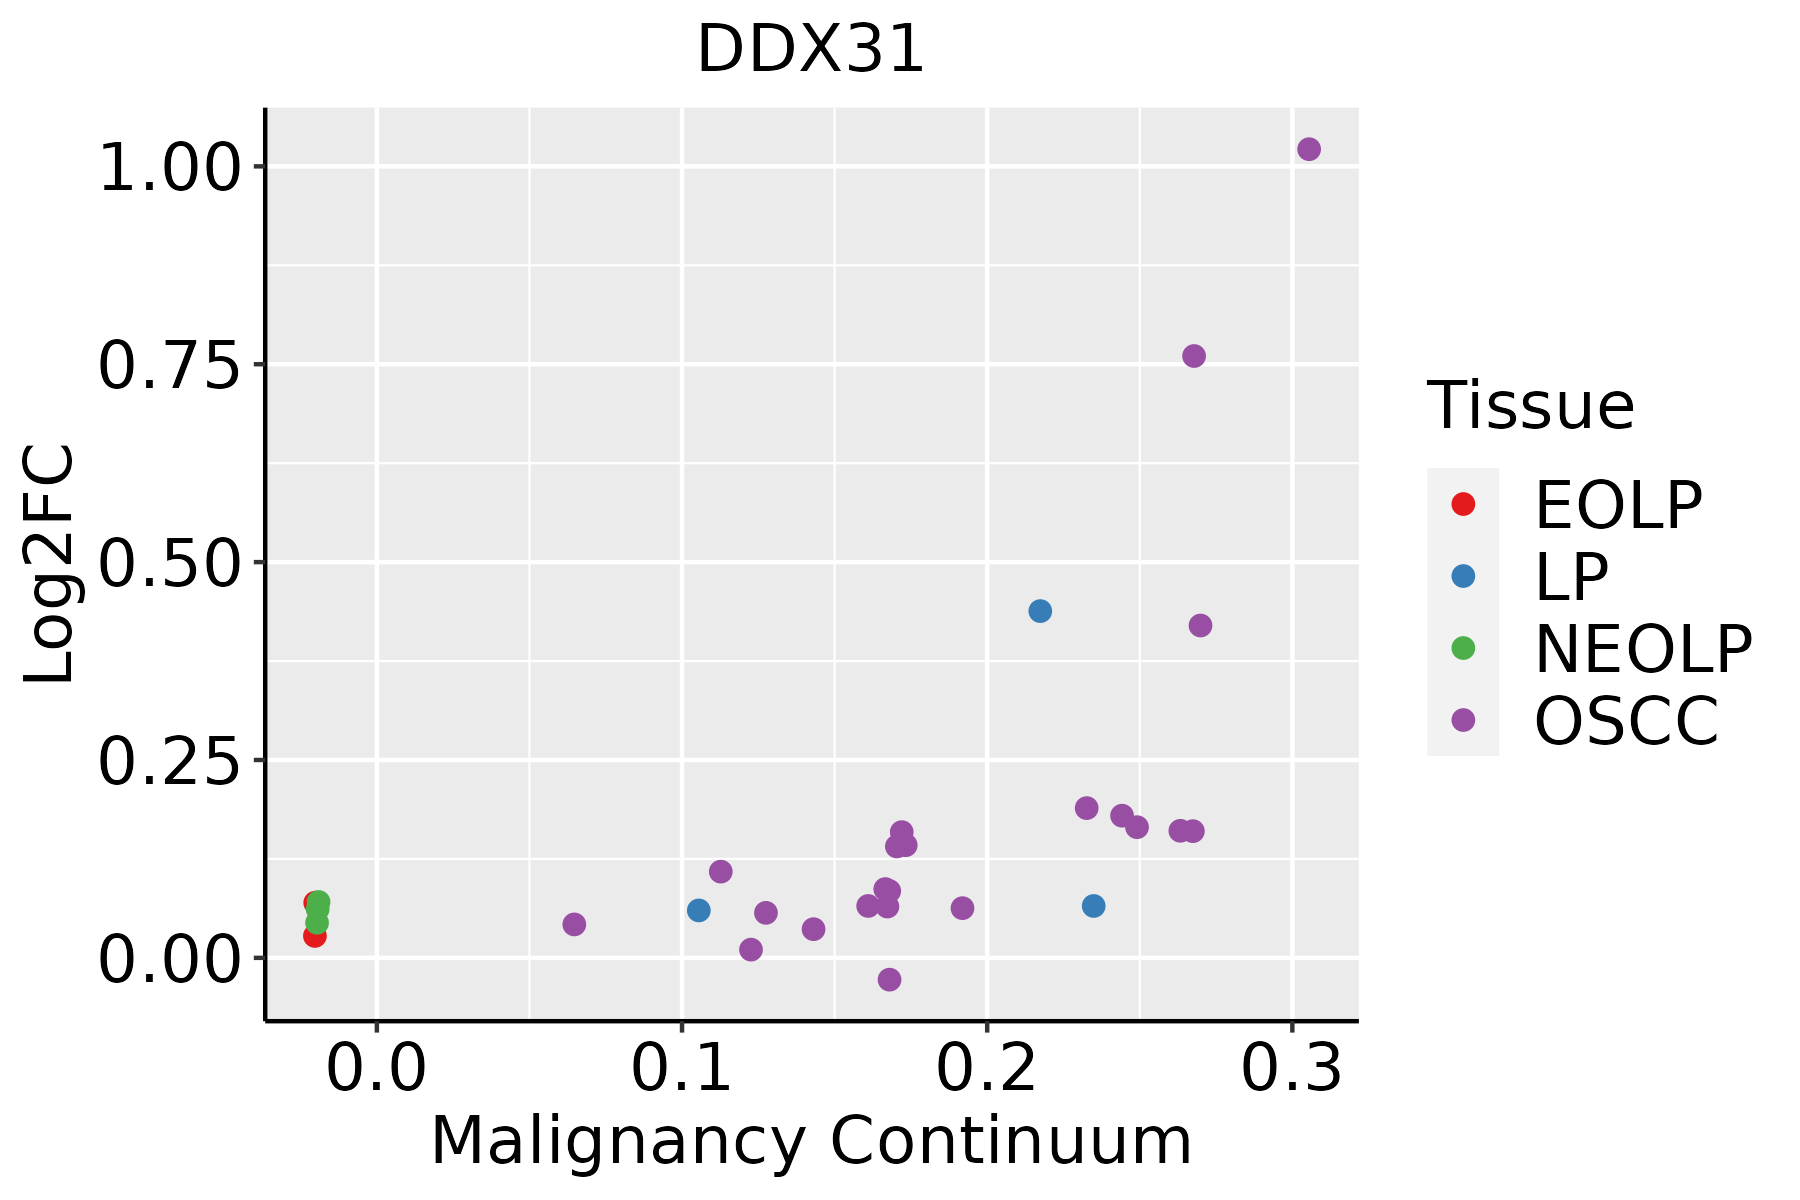 | EOLP: Erosive Oral lichen planus |
| LP: leukoplakia | ||
| NEOLP: Non-erosive oral lichen planus | ||
| OSCC: Oral squamous cell carcinoma |
| ∗log2FC in expression of this searched gene in stem-like cells from each diseased tissue sample relative to stem-like cells in normal samples in each tissue plotted against the malignancy continuum. Samples are colored based on if they are from different disease stage. |
Top |
Malignant transformation related pathway analysis |
| Find out the enriched GO biological processes and KEGG pathways involved in transition from healthy to precancer to cancer |
| Tissue | Disease Stage | Enriched GO biological Processes |
| Colorectum | AD |  |
| Colorectum | SER |  |
| Colorectum | MSS |  |
| Colorectum | MSI-H |  |
| Colorectum | FAP |  |
| ∗Top 15 enriched GO BP terms are showed in the bar plot of each disease state in each tissue. Each row represents a significant GO biological process which is colored according to the -log10(p.adjust). |
| Page: 1 2 3 4 5 6 7 8 9 |
| GO ID | Tissue | Disease Stage | Description | Gene Ratio | Bg Ratio | pvalue | p.adjust | Count |
| GO:002261310 | Cervix | CC | ribonucleoprotein complex biogenesis | 88/2311 | 463/18723 | 2.11e-05 | 3.82e-04 | 88 |
| GO:004225410 | Cervix | CC | ribosome biogenesis | 62/2311 | 299/18723 | 2.48e-05 | 4.27e-04 | 62 |
| GO:0022613111 | Esophagus | ESCC | ribonucleoprotein complex biogenesis | 365/8552 | 463/18723 | 1.74e-49 | 1.11e-45 | 365 |
| GO:0042254111 | Esophagus | ESCC | ribosome biogenesis | 252/8552 | 299/18723 | 3.27e-44 | 1.04e-40 | 252 |
| GO:002261320 | Oral cavity | OSCC | ribonucleoprotein complex biogenesis | 333/7305 | 463/18723 | 8.28e-48 | 5.24e-44 | 333 |
| GO:004225420 | Oral cavity | OSCC | ribosome biogenesis | 230/7305 | 299/18723 | 3.22e-41 | 6.80e-38 | 230 |
| GO:0022613110 | Oral cavity | LP | ribonucleoprotein complex biogenesis | 259/4623 | 463/18723 | 7.20e-48 | 2.25e-44 | 259 |
| GO:0042254110 | Oral cavity | LP | ribosome biogenesis | 173/4623 | 299/18723 | 8.97e-35 | 1.41e-31 | 173 |
| Page: 1 |
| Pathway ID | Tissue | Disease Stage | Description | Gene Ratio | Bg Ratio | pvalue | p.adjust | qvalue | Count |
| Page: 1 |
Top |
Cell-cell communication analysis |
| Identification of potential cell-cell interactions between two cell types and their ligand-receptor pairs for different disease states |
| Ligand | Receptor | LRpair | Pathway | Tissue | Disease Stage |
| Page: 1 |
Top |
Single-cell gene regulatory network inference analysis |
| Find out the significant the regulons (TFs) and the target genes of each regulon across cell types for different disease states |
| TF | Cell Type | Tissue | Disease Stage | Target Gene | RSS | Regulon Activity |
| ∗The dot plots of a searched regulon are shown for all cell subpopulations in each disease state of each tissue based on the regulon specific score inferred using pySCENIC and by calculating the average expression. |
| Page: 1 |
Top |
Somatic mutation of malignant transformation related genes |
| Annotation of somatic variants for genes involved in malignant transformation |
| Hugo Symbol | Variant Class | Variant Classification | dbSNP RS | HGVSc | HGVSp | HGVSp Short | SWISSPROT | BIOTYPE | SIFT | PolyPhen | Tumor Sample Barcode | Tissue | Histology | Sex | Age | Stage | Therapy Types | Drugs | Outcome |
| DDX31 | SNV | Missense_Mutation | novel | c.949N>A | p.Leu317Ile | p.L317I | Q9H8H2 | protein_coding | deleterious(0) | probably_damaging(0.999) | TCGA-A7-A425-01 | Breast | breast invasive carcinoma | Female | >=65 | III/IV | Chemotherapy | adriamycin | PD |
| DDX31 | SNV | Missense_Mutation | rs780168692 | c.1861C>T | p.Arg621Trp | p.R621W | Q9H8H2 | protein_coding | deleterious(0) | probably_damaging(1) | TCGA-A8-A07R-01 | Breast | breast invasive carcinoma | Female | >=65 | III/IV | Ancillary | zoledronic | SD |
| DDX31 | SNV | Missense_Mutation | c.2289N>C | p.Lys763Asn | p.K763N | Q9H8H2 | protein_coding | deleterious(0.03) | benign(0.071) | TCGA-AC-A23H-01 | Breast | breast invasive carcinoma | Female | >=65 | I/II | Unknown | Unknown | PD | |
| DDX31 | SNV | Missense_Mutation | rs778619874 | c.1619N>T | p.Ala540Val | p.A540V | Q9H8H2 | protein_coding | tolerated(0.23) | benign(0.119) | TCGA-AN-A046-01 | Breast | breast invasive carcinoma | Female | >=65 | I/II | Unknown | Unknown | SD |
| DDX31 | SNV | Missense_Mutation | c.595N>C | p.Ile199Leu | p.I199L | Q9H8H2 | protein_coding | tolerated(0.12) | benign(0.007) | TCGA-BH-A0DX-01 | Breast | breast invasive carcinoma | Female | <65 | I/II | Chemotherapy | taxotere | CR | |
| DDX31 | SNV | Missense_Mutation | c.847N>G | p.Leu283Val | p.L283V | Q9H8H2 | protein_coding | deleterious(0.02) | probably_damaging(0.942) | TCGA-D8-A1J8-01 | Breast | breast invasive carcinoma | Female | >=65 | I/II | Hormone Therapy | nolvadex | SD | |
| DDX31 | SNV | Missense_Mutation | c.583N>A | p.Glu195Lys | p.E195K | Q9H8H2 | protein_coding | tolerated(0.18) | benign(0.033) | TCGA-D8-A1JA-01 | Breast | breast invasive carcinoma | Female | <65 | III/IV | Chemotherapy | adriamycin | PD | |
| DDX31 | insertion | Frame_Shift_Ins | novel | c.1210_1211insGAGGTGGGGGTGGGCGCAGTATCTGTTGC | p.Val404GlyfsTer11 | p.V404Gfs*11 | Q9H8H2 | protein_coding | TCGA-A2-A0EV-01 | Breast | breast invasive carcinoma | Female | >=65 | I/II | Unknown | Unknown | SD | ||
| DDX31 | deletion | Frame_Shift_Del | novel | c.940delN | p.Thr314ArgfsTer4 | p.T314Rfs*4 | Q9H8H2 | protein_coding | TCGA-D8-A27V-01 | Breast | breast invasive carcinoma | Female | <65 | I/II | Hormone Therapy | tamoxiphen | SD | ||
| DDX31 | SNV | Missense_Mutation | novel | c.2104C>T | p.His702Tyr | p.H702Y | Q9H8H2 | protein_coding | tolerated(0.84) | probably_damaging(0.959) | TCGA-VS-A9UB-01 | Cervix | cervical & endocervical cancer | Female | <65 | I/II | Chemotherapy | cisplatin | CR |
| Page: 1 2 3 4 5 6 7 |
Top |
Related drugs of malignant transformation related genes |
| Identification of chemicals and drugs interact with genes involved in malignant transfromation |
| (DGIdb 4.0) |
| Entrez ID | Symbol | Category | Interaction Types | Drug Claim Name | Drug Name | PMIDs |
| Page: 1 |

Copyright 2023-Present -The University of Texas Health Science Center at Houston |