
|
|||||
|
 | |
| |
| |
| |
| |
| |
|
Gene: DDX23 |
Gene summary for DDX23 |
| Gene information | Species | Human | Gene symbol | DDX23 | Gene ID | 9416 |
| Gene name | DEAD-box helicase 23 | |
| Gene Alias | PRPF28 | |
| Cytomap | 12q13.12 | |
| Gene Type | protein-coding | GO ID | GO:0000245 | UniProtAcc | A0A024R0Z3 |
Top |
Malignant transformation analysis |
| Identification of the aberrant gene expression in precancerous and cancerous lesions by comparing the gene expression of stem-like cells in diseased tissues with normal stem cells |
| Entrez ID | Symbol | Replicates | Species | Organ | Tissue | Adj P-value | Log2FC | Malignancy |
| 9416 | DDX23 | LZE7T | Human | Esophagus | ESCC | 7.61e-07 | 4.23e-01 | 0.0667 |
| 9416 | DDX23 | LZE8T | Human | Esophagus | ESCC | 7.10e-07 | 2.04e-01 | 0.067 |
| 9416 | DDX23 | LZE20T | Human | Esophagus | ESCC | 6.97e-07 | 1.38e-01 | 0.0662 |
| 9416 | DDX23 | LZE22T | Human | Esophagus | ESCC | 3.34e-02 | 2.76e-01 | 0.068 |
| 9416 | DDX23 | LZE24T | Human | Esophagus | ESCC | 7.86e-15 | 3.43e-01 | 0.0596 |
| 9416 | DDX23 | LZE21T | Human | Esophagus | ESCC | 2.81e-03 | 1.64e-01 | 0.0655 |
| 9416 | DDX23 | LZE6T | Human | Esophagus | ESCC | 2.69e-04 | 1.83e-01 | 0.0845 |
| 9416 | DDX23 | P1T-E | Human | Esophagus | ESCC | 2.30e-09 | 5.71e-01 | 0.0875 |
| 9416 | DDX23 | P2T-E | Human | Esophagus | ESCC | 3.09e-29 | 5.27e-01 | 0.1177 |
| 9416 | DDX23 | P4T-E | Human | Esophagus | ESCC | 1.76e-14 | 2.80e-01 | 0.1323 |
| 9416 | DDX23 | P8T-E | Human | Esophagus | ESCC | 9.82e-22 | 4.24e-01 | 0.0889 |
| 9416 | DDX23 | P9T-E | Human | Esophagus | ESCC | 1.29e-14 | 2.14e-01 | 0.1131 |
| 9416 | DDX23 | P10T-E | Human | Esophagus | ESCC | 4.56e-17 | 4.16e-01 | 0.116 |
| 9416 | DDX23 | P11T-E | Human | Esophagus | ESCC | 1.03e-09 | 4.61e-01 | 0.1426 |
| 9416 | DDX23 | P12T-E | Human | Esophagus | ESCC | 7.66e-16 | 2.71e-01 | 0.1122 |
| 9416 | DDX23 | P15T-E | Human | Esophagus | ESCC | 8.49e-14 | 3.73e-01 | 0.1149 |
| 9416 | DDX23 | P16T-E | Human | Esophagus | ESCC | 1.65e-18 | 3.73e-01 | 0.1153 |
| 9416 | DDX23 | P17T-E | Human | Esophagus | ESCC | 4.88e-07 | 4.47e-01 | 0.1278 |
| 9416 | DDX23 | P19T-E | Human | Esophagus | ESCC | 7.28e-06 | 2.92e-01 | 0.1662 |
| 9416 | DDX23 | P20T-E | Human | Esophagus | ESCC | 9.75e-20 | 3.95e-01 | 0.1124 |
| Page: 1 2 3 4 5 6 |
| Tissue | Expression Dynamics | Abbreviation |
| Esophagus | 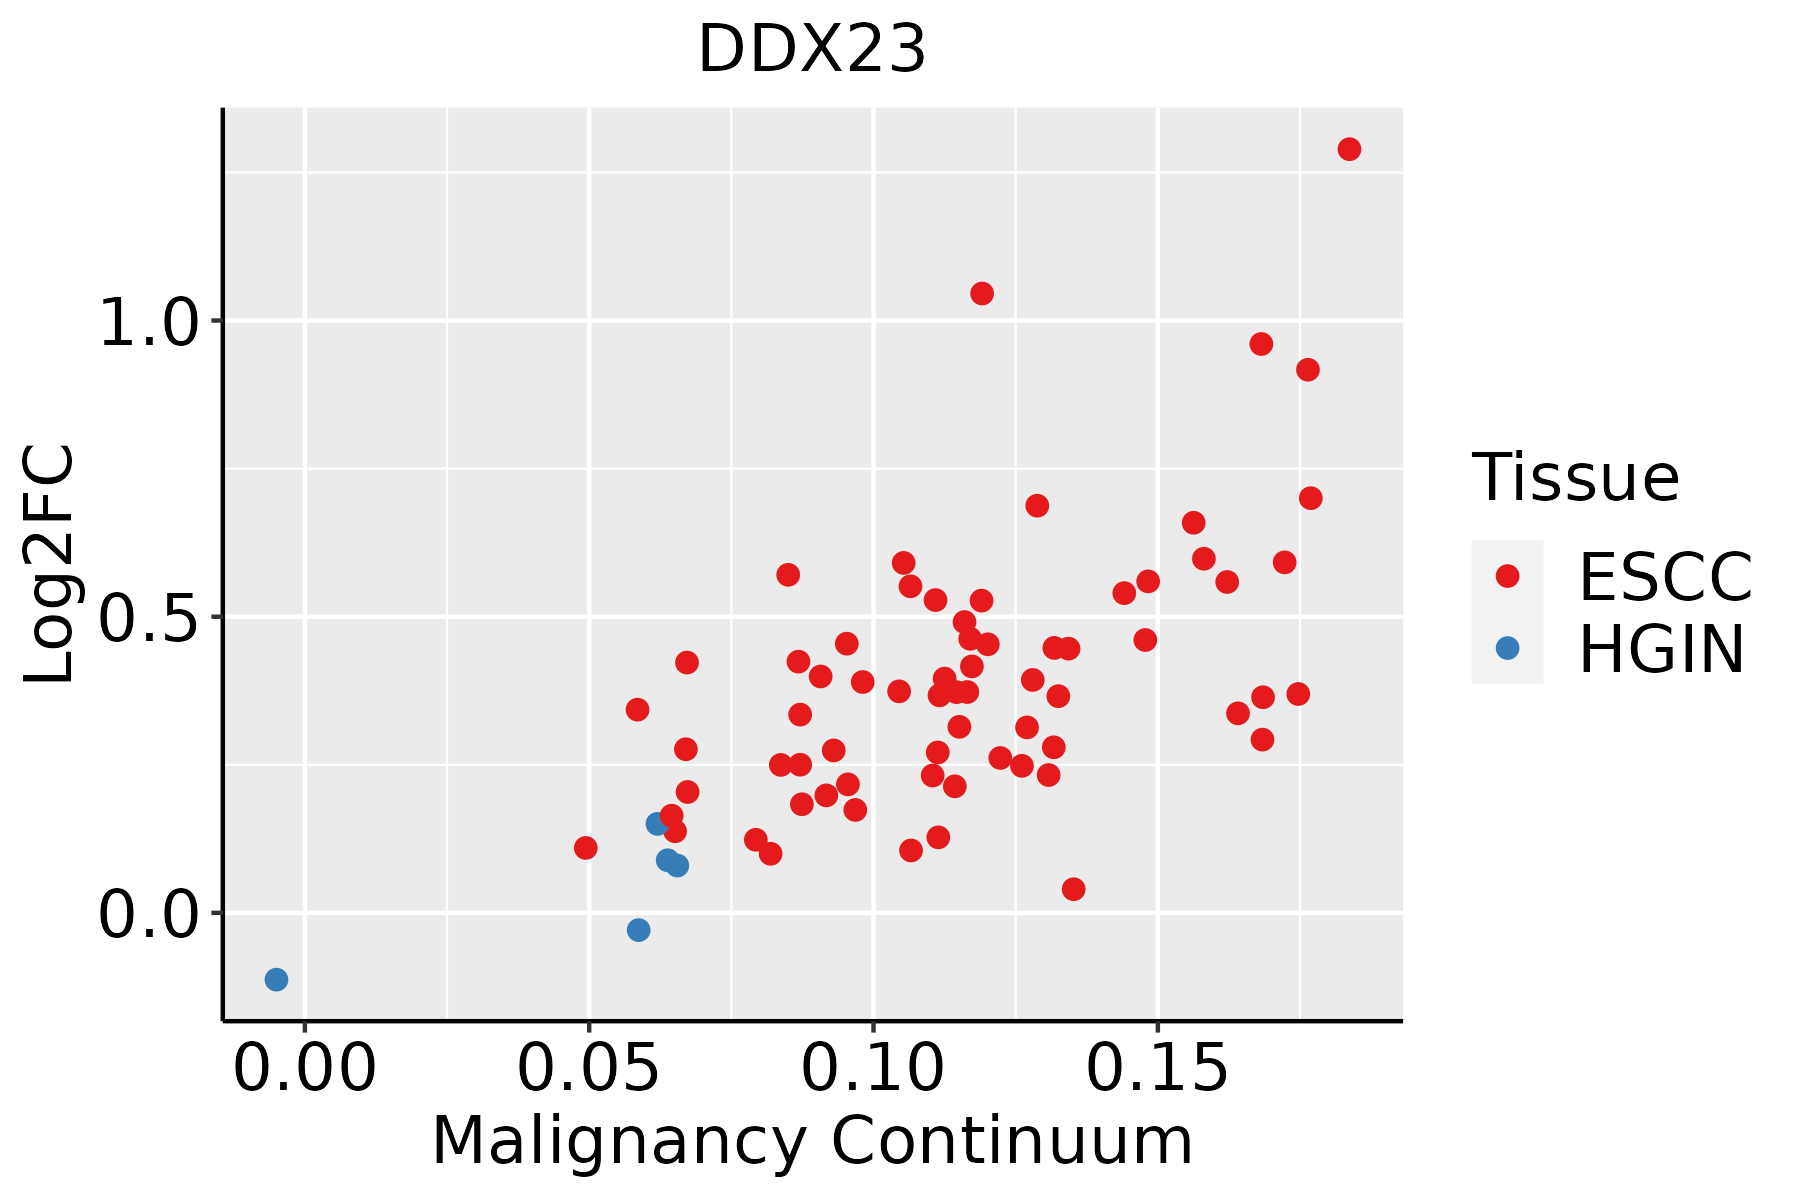 | ESCC: Esophageal squamous cell carcinoma |
| HGIN: High-grade intraepithelial neoplasias | ||
| LGIN: Low-grade intraepithelial neoplasias | ||
| Liver |  | HCC: Hepatocellular carcinoma |
| NAFLD: Non-alcoholic fatty liver disease | ||
| Oral Cavity | 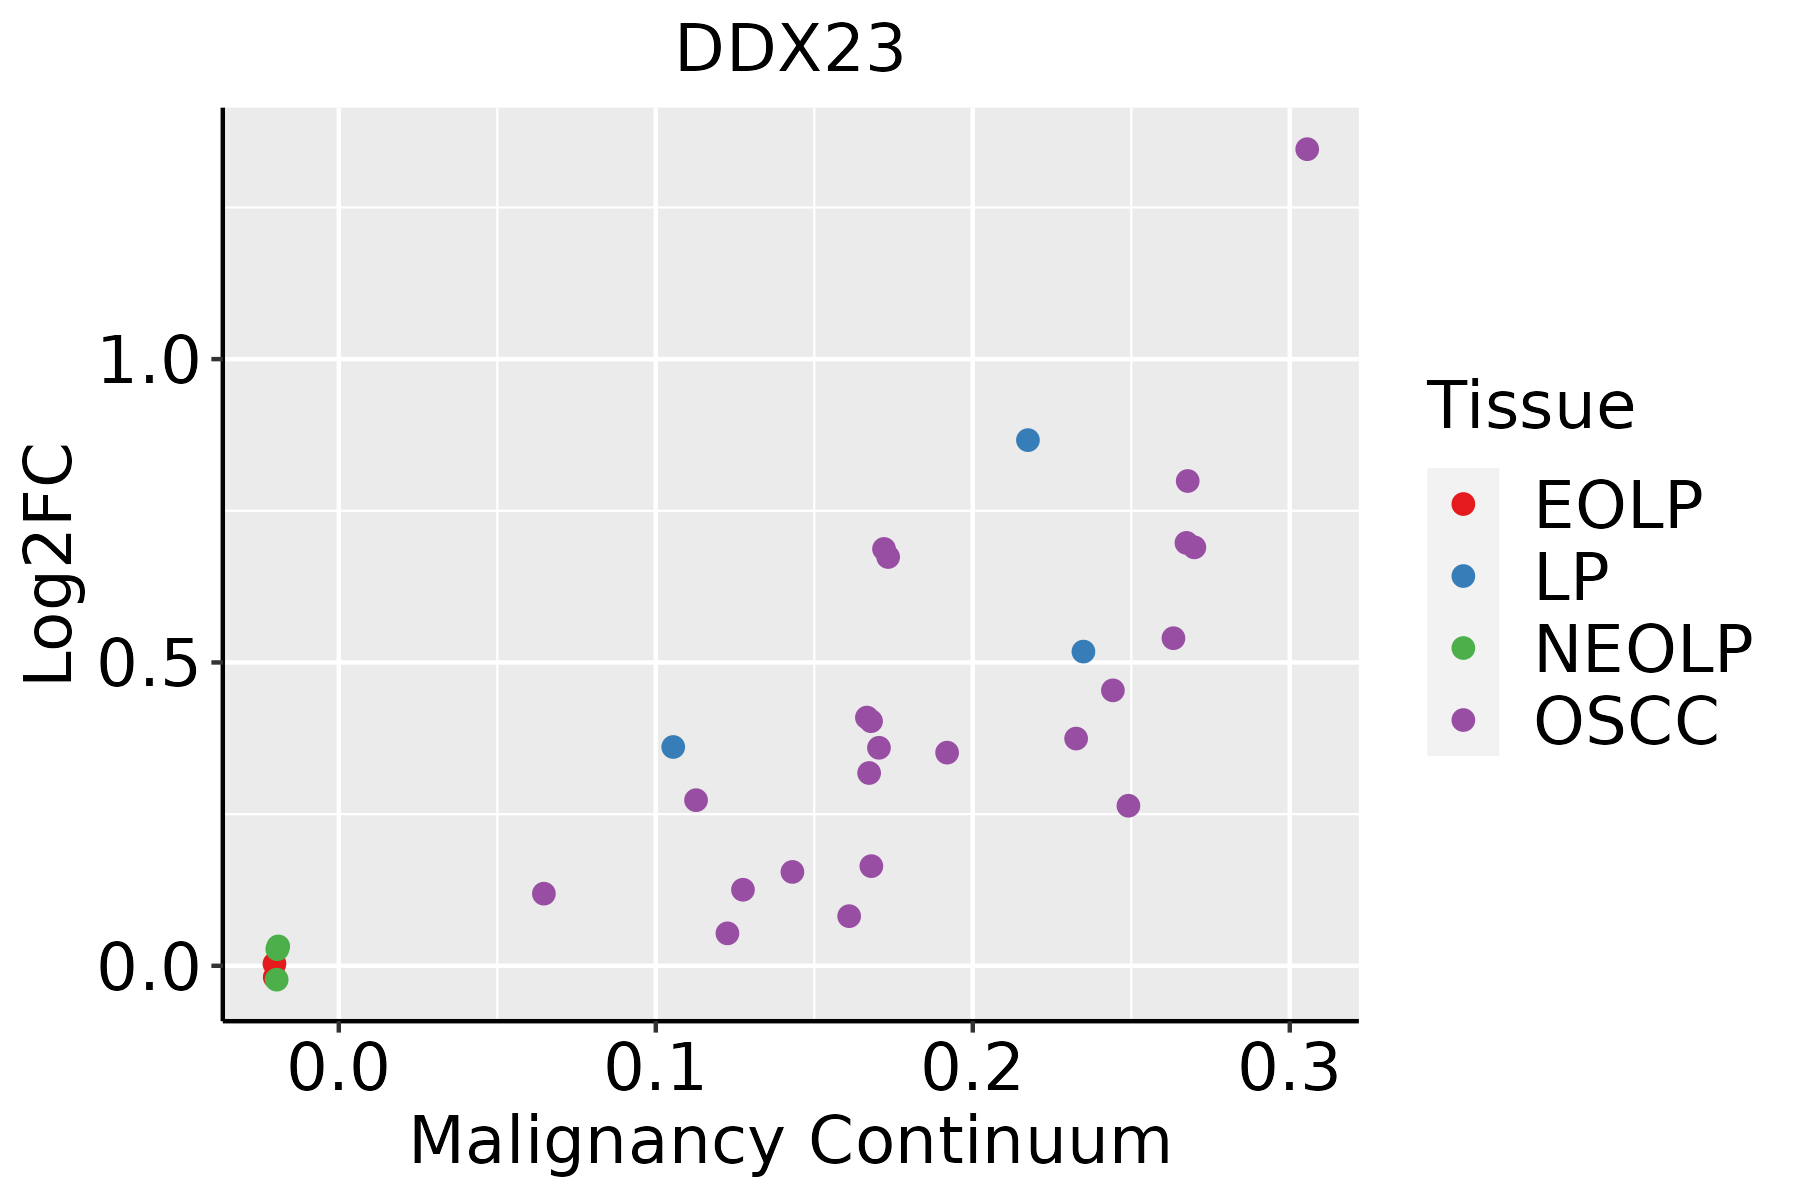 | EOLP: Erosive Oral lichen planus |
| LP: leukoplakia | ||
| NEOLP: Non-erosive oral lichen planus | ||
| OSCC: Oral squamous cell carcinoma | ||
| Skin | 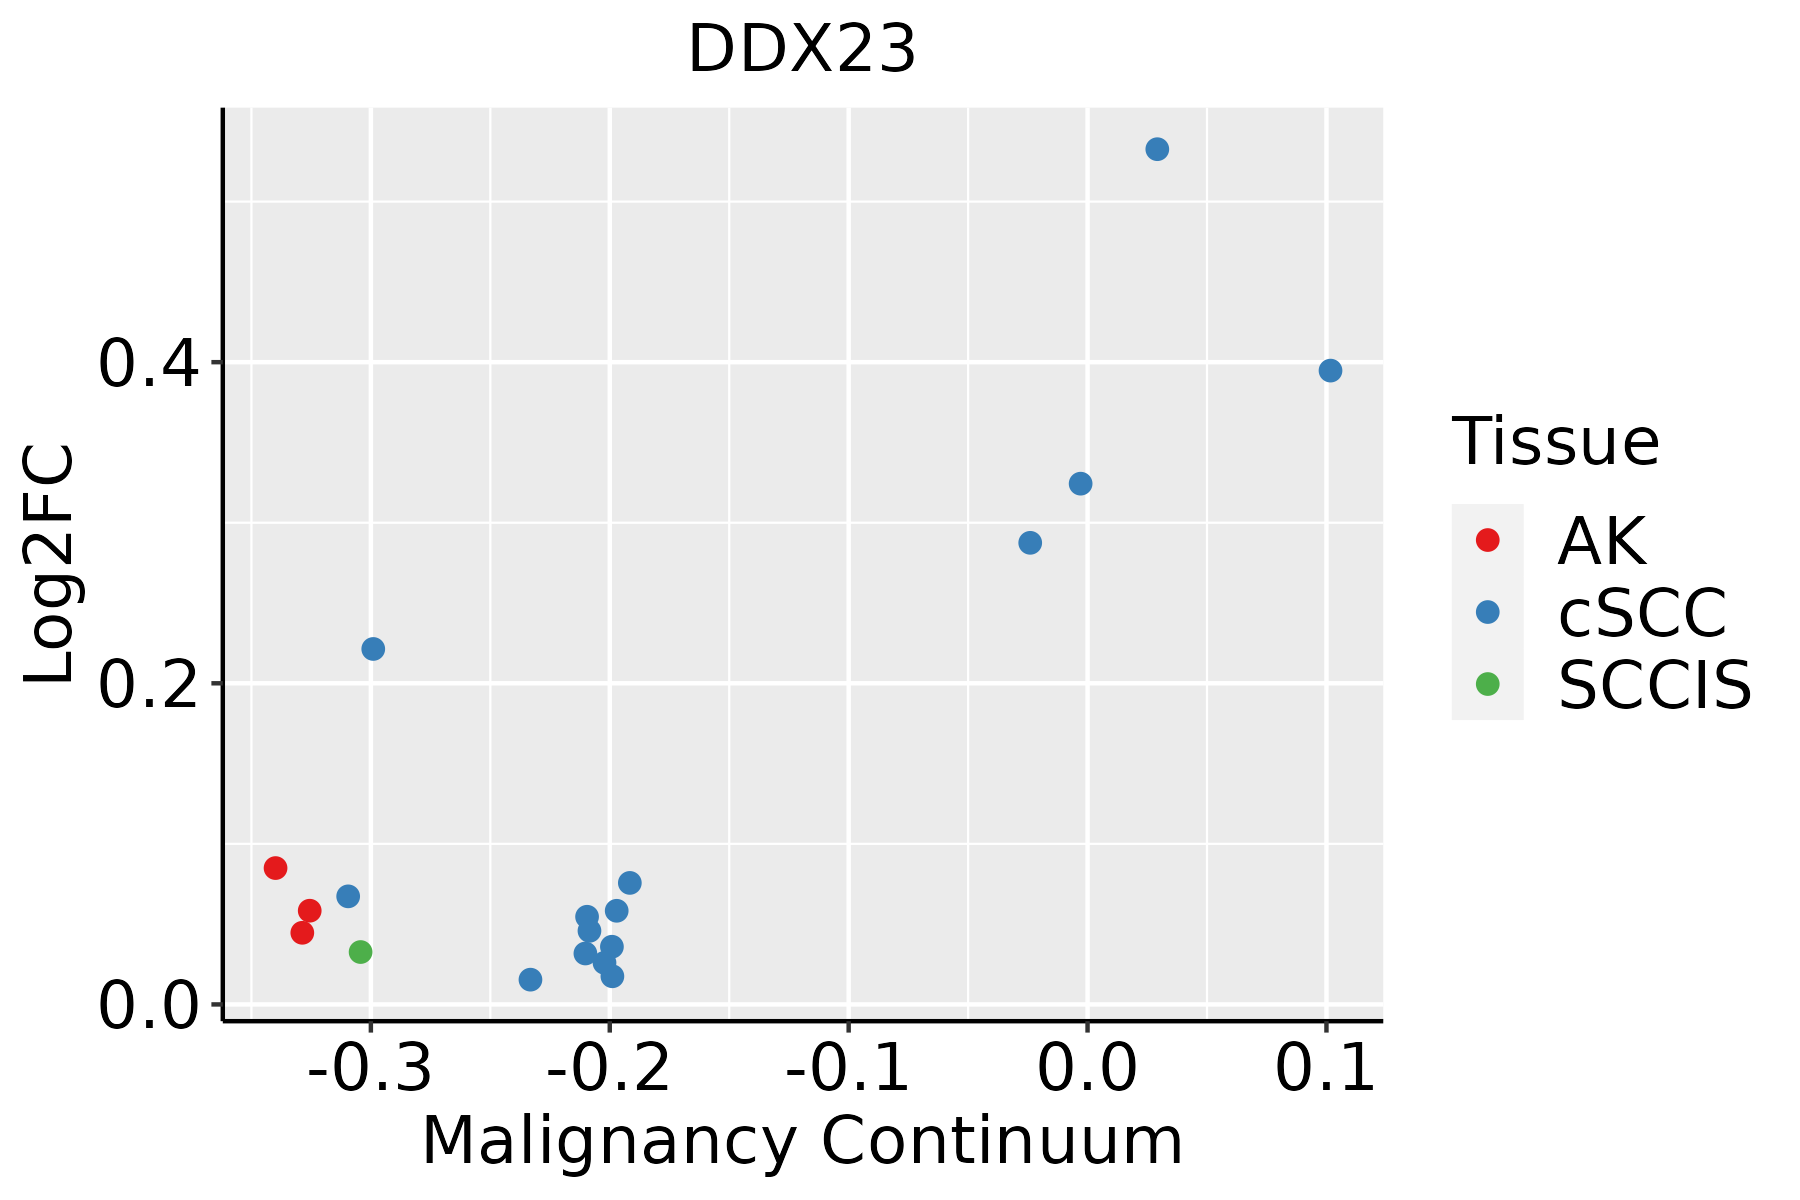 | AK: Actinic keratosis |
| cSCC: Cutaneous squamous cell carcinoma | ||
| SCCIS:squamous cell carcinoma in situ | ||
| Thyroid | 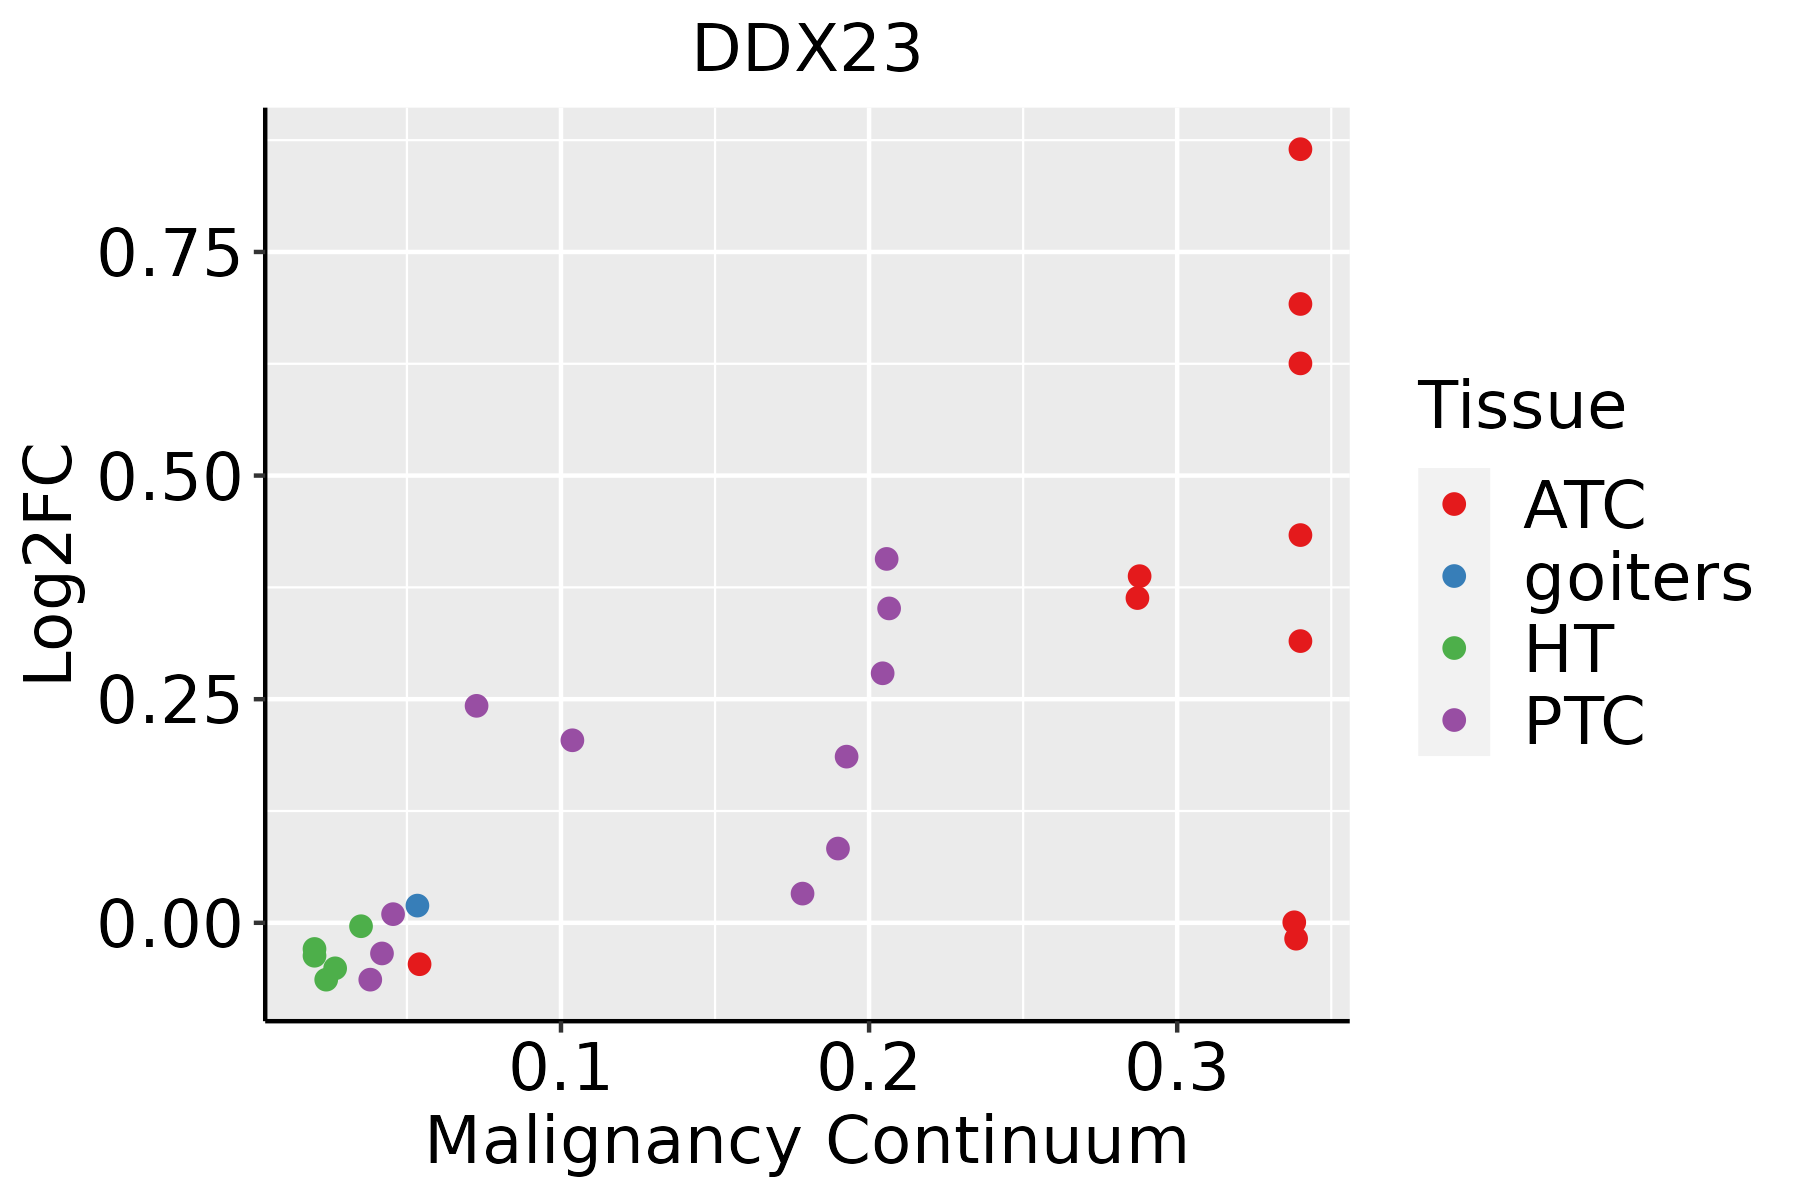 | ATC: Anaplastic thyroid cancer |
| HT: Hashimoto's thyroiditis | ||
| PTC: Papillary thyroid cancer |
| ∗log2FC in expression of this searched gene in stem-like cells from each diseased tissue sample relative to stem-like cells in normal samples in each tissue plotted against the malignancy continuum. Samples are colored based on if they are from different disease stage. |
Top |
Malignant transformation related pathway analysis |
| Find out the enriched GO biological processes and KEGG pathways involved in transition from healthy to precancer to cancer |
| Tissue | Disease Stage | Enriched GO biological Processes |
| Colorectum | AD |  |
| Colorectum | SER |  |
| Colorectum | MSS |  |
| Colorectum | MSI-H |  |
| Colorectum | FAP |  |
| ∗Top 15 enriched GO BP terms are showed in the bar plot of each disease state in each tissue. Each row represents a significant GO biological process which is colored according to the -log10(p.adjust). |
| Page: 1 2 3 4 5 6 7 8 9 |
| GO ID | Tissue | Disease Stage | Description | Gene Ratio | Bg Ratio | pvalue | p.adjust | Count |
| GO:0022613111 | Esophagus | ESCC | ribonucleoprotein complex biogenesis | 365/8552 | 463/18723 | 1.74e-49 | 1.11e-45 | 365 |
| GO:0008380111 | Esophagus | ESCC | RNA splicing | 336/8552 | 434/18723 | 1.74e-42 | 3.67e-39 | 336 |
| GO:0000375111 | Esophagus | ESCC | RNA splicing, via transesterification reactions | 248/8552 | 324/18723 | 3.05e-30 | 1.49e-27 | 248 |
| GO:0000377111 | Esophagus | ESCC | RNA splicing, via transesterification reactions with bulged adenosine as nucleophile | 244/8552 | 320/18723 | 2.52e-29 | 1.07e-26 | 244 |
| GO:0000398111 | Esophagus | ESCC | mRNA splicing, via spliceosome | 244/8552 | 320/18723 | 2.52e-29 | 1.07e-26 | 244 |
| GO:0071826111 | Esophagus | ESCC | ribonucleoprotein complex subunit organization | 166/8552 | 227/18723 | 2.94e-17 | 2.42e-15 | 166 |
| GO:0022618111 | Esophagus | ESCC | ribonucleoprotein complex assembly | 159/8552 | 220/18723 | 8.19e-16 | 5.71e-14 | 159 |
| GO:00062604 | Esophagus | ESCC | DNA replication | 181/8552 | 260/18723 | 3.55e-15 | 2.05e-13 | 181 |
| GO:00062612 | Esophagus | ESCC | DNA-dependent DNA replication | 100/8552 | 151/18723 | 2.61e-07 | 3.94e-06 | 100 |
| GO:000024514 | Esophagus | ESCC | spliceosomal complex assembly | 48/8552 | 79/18723 | 4.93e-03 | 1.89e-02 | 48 |
| GO:002261322 | Liver | HCC | ribonucleoprotein complex biogenesis | 355/7958 | 463/18723 | 7.76e-52 | 4.92e-48 | 355 |
| GO:000838022 | Liver | HCC | RNA splicing | 313/7958 | 434/18723 | 1.36e-36 | 1.73e-33 | 313 |
| GO:000037522 | Liver | HCC | RNA splicing, via transesterification reactions | 228/7958 | 324/18723 | 1.47e-24 | 4.06e-22 | 228 |
| GO:000037722 | Liver | HCC | RNA splicing, via transesterification reactions with bulged adenosine as nucleophile | 224/7958 | 320/18723 | 1.16e-23 | 2.62e-21 | 224 |
| GO:000039822 | Liver | HCC | mRNA splicing, via spliceosome | 224/7958 | 320/18723 | 1.16e-23 | 2.62e-21 | 224 |
| GO:007182622 | Liver | HCC | ribonucleoprotein complex subunit organization | 159/7958 | 227/18723 | 3.14e-17 | 3.06e-15 | 159 |
| GO:002261822 | Liver | HCC | ribonucleoprotein complex assembly | 153/7958 | 220/18723 | 3.44e-16 | 2.91e-14 | 153 |
| GO:00062601 | Liver | HCC | DNA replication | 146/7958 | 260/18723 | 5.68e-06 | 7.02e-05 | 146 |
| GO:000024511 | Liver | HCC | spliceosomal complex assembly | 46/7958 | 79/18723 | 3.45e-03 | 1.56e-02 | 46 |
| GO:0006261 | Liver | HCC | DNA-dependent DNA replication | 80/7958 | 151/18723 | 5.91e-03 | 2.44e-02 | 80 |
| Page: 1 2 3 4 |
| Pathway ID | Tissue | Disease Stage | Description | Gene Ratio | Bg Ratio | pvalue | p.adjust | qvalue | Count |
| hsa0304027 | Esophagus | ESCC | Spliceosome | 128/4205 | 217/8465 | 3.31e-03 | 8.79e-03 | 4.50e-03 | 128 |
| hsa0304037 | Esophagus | ESCC | Spliceosome | 128/4205 | 217/8465 | 3.31e-03 | 8.79e-03 | 4.50e-03 | 128 |
| hsa0304022 | Liver | HCC | Spliceosome | 122/4020 | 217/8465 | 5.55e-03 | 1.60e-02 | 8.91e-03 | 122 |
| hsa0304032 | Liver | HCC | Spliceosome | 122/4020 | 217/8465 | 5.55e-03 | 1.60e-02 | 8.91e-03 | 122 |
| hsa0304016 | Oral cavity | OSCC | Spliceosome | 123/3704 | 217/8465 | 7.21e-05 | 2.74e-04 | 1.40e-04 | 123 |
| hsa0304017 | Oral cavity | OSCC | Spliceosome | 123/3704 | 217/8465 | 7.21e-05 | 2.74e-04 | 1.40e-04 | 123 |
| hsa0304026 | Oral cavity | LP | Spliceosome | 106/2418 | 217/8465 | 1.30e-10 | 2.40e-09 | 1.55e-09 | 106 |
| hsa0304036 | Oral cavity | LP | Spliceosome | 106/2418 | 217/8465 | 1.30e-10 | 2.40e-09 | 1.55e-09 | 106 |
| Page: 1 |
Top |
Cell-cell communication analysis |
| Identification of potential cell-cell interactions between two cell types and their ligand-receptor pairs for different disease states |
| Ligand | Receptor | LRpair | Pathway | Tissue | Disease Stage |
| Page: 1 |
Top |
Single-cell gene regulatory network inference analysis |
| Find out the significant the regulons (TFs) and the target genes of each regulon across cell types for different disease states |
| TF | Cell Type | Tissue | Disease Stage | Target Gene | RSS | Regulon Activity |
| ∗The dot plots of a searched regulon are shown for all cell subpopulations in each disease state of each tissue based on the regulon specific score inferred using pySCENIC and by calculating the average expression. |
| Page: 1 |
Top |
Somatic mutation of malignant transformation related genes |
| Annotation of somatic variants for genes involved in malignant transformation |
| Hugo Symbol | Variant Class | Variant Classification | dbSNP RS | HGVSc | HGVSp | HGVSp Short | SWISSPROT | BIOTYPE | SIFT | PolyPhen | Tumor Sample Barcode | Tissue | Histology | Sex | Age | Stage | Therapy Types | Drugs | Outcome |
| DDX23 | SNV | Missense_Mutation | c.430C>G | p.Leu144Val | p.L144V | Q9BUQ8 | protein_coding | tolerated(0.28) | possibly_damaging(0.899) | TCGA-AC-A2FG-01 | Breast | breast invasive carcinoma | Female | >=65 | I/II | Hormone Therapy | arimidex | CR | |
| DDX23 | SNV | Missense_Mutation | c.2380N>A | p.Glu794Lys | p.E794K | Q9BUQ8 | protein_coding | deleterious(0.02) | benign(0.096) | TCGA-AN-A046-01 | Breast | breast invasive carcinoma | Female | >=65 | I/II | Unknown | Unknown | SD | |
| DDX23 | SNV | Missense_Mutation | novel | c.113N>G | p.Ser38Cys | p.S38C | Q9BUQ8 | protein_coding | deleterious_low_confidence(0.03) | benign(0.423) | TCGA-BH-A0B6-01 | Breast | breast invasive carcinoma | Female | <65 | I/II | Unknown | Unknown | SD |
| DDX23 | SNV | Missense_Mutation | novel | c.1777N>C | p.Glu593Gln | p.E593Q | Q9BUQ8 | protein_coding | tolerated(0.34) | benign(0.065) | TCGA-D8-A73U-01 | Breast | breast invasive carcinoma | Female | >=65 | I/II | Hormone Therapy | tamoxiphen | SD |
| DDX23 | SNV | Missense_Mutation | rs780056094 | c.1492C>T | p.Arg498Cys | p.R498C | Q9BUQ8 | protein_coding | deleterious(0) | probably_damaging(0.988) | TCGA-E2-A15C-01 | Breast | breast invasive carcinoma | Female | <65 | I/II | Hormone Therapy | arimidex | SD |
| DDX23 | SNV | Missense_Mutation | c.1546N>G | p.Arg516Gly | p.R516G | Q9BUQ8 | protein_coding | deleterious(0) | probably_damaging(0.971) | TCGA-E9-A243-01 | Breast | breast invasive carcinoma | Female | <65 | I/II | Chemotherapy | 5-fluorouracil | PD | |
| DDX23 | insertion | Frame_Shift_Ins | novel | c.1291_1292insCAGCACTCTTCCTGTGGGCTGAGGGCATCTCCAAAGCTGA | p.Ile431ThrfsTer19 | p.I431Tfs*19 | Q9BUQ8 | protein_coding | TCGA-AN-A04A-01 | Breast | breast invasive carcinoma | Female | <65 | III/IV | Unknown | Unknown | SD | ||
| DDX23 | SNV | Missense_Mutation | c.1073N>T | p.Ser358Phe | p.S358F | Q9BUQ8 | protein_coding | deleterious(0) | possibly_damaging(0.825) | TCGA-DS-A0VK-01 | Cervix | cervical & endocervical cancer | Female | <65 | I/II | Chemotherapy | carboplatin | PD | |
| DDX23 | SNV | Missense_Mutation | c.2318N>T | p.Ser773Phe | p.S773F | Q9BUQ8 | protein_coding | deleterious(0) | possibly_damaging(0.736) | TCGA-DS-A1OB-01 | Cervix | cervical & endocervical cancer | Female | <65 | I/II | Chemotherapy | carboplatin | PD | |
| DDX23 | SNV | Missense_Mutation | c.1378G>A | p.Asp460Asn | p.D460N | Q9BUQ8 | protein_coding | tolerated(0.21) | benign(0.415) | TCGA-EK-A2H0-01 | Cervix | cervical & endocervical cancer | Female | <65 | I/II | Chemotherapy | cisplatin | CR |
| Page: 1 2 3 4 5 6 7 8 9 10 |
Top |
Related drugs of malignant transformation related genes |
| Identification of chemicals and drugs interact with genes involved in malignant transfromation |
| (DGIdb 4.0) |
| Entrez ID | Symbol | Category | Interaction Types | Drug Claim Name | Drug Name | PMIDs |
| Page: 1 |

Copyright 2023-Present -The University of Texas Health Science Center at Houston |