
|
|||||
|
 | |
| |
| |
| |
| |
| |
|
Gene: DDX20 |
Gene summary for DDX20 |
| Gene information | Species | Human | Gene symbol | DDX20 | Gene ID | 11218 |
| Gene name | DEAD-box helicase 20 | |
| Gene Alias | DP103 | |
| Cytomap | 1p13.2 | |
| Gene Type | protein-coding | GO ID | GO:0000003 | UniProtAcc | Q9H4N4 |
Top |
Malignant transformation analysis |
| Identification of the aberrant gene expression in precancerous and cancerous lesions by comparing the gene expression of stem-like cells in diseased tissues with normal stem cells |
| Entrez ID | Symbol | Replicates | Species | Organ | Tissue | Adj P-value | Log2FC | Malignancy |
| 11218 | DDX20 | P4_cSCC | Human | Skin | cSCC | 2.14e-12 | 2.65e-01 | -0.00290000000000005 |
| 11218 | DDX20 | P10_cSCC | Human | Skin | cSCC | 8.95e-10 | 3.09e-01 | 0.1017 |
| Page: 1 |
| Tissue | Expression Dynamics | Abbreviation |
| Skin | 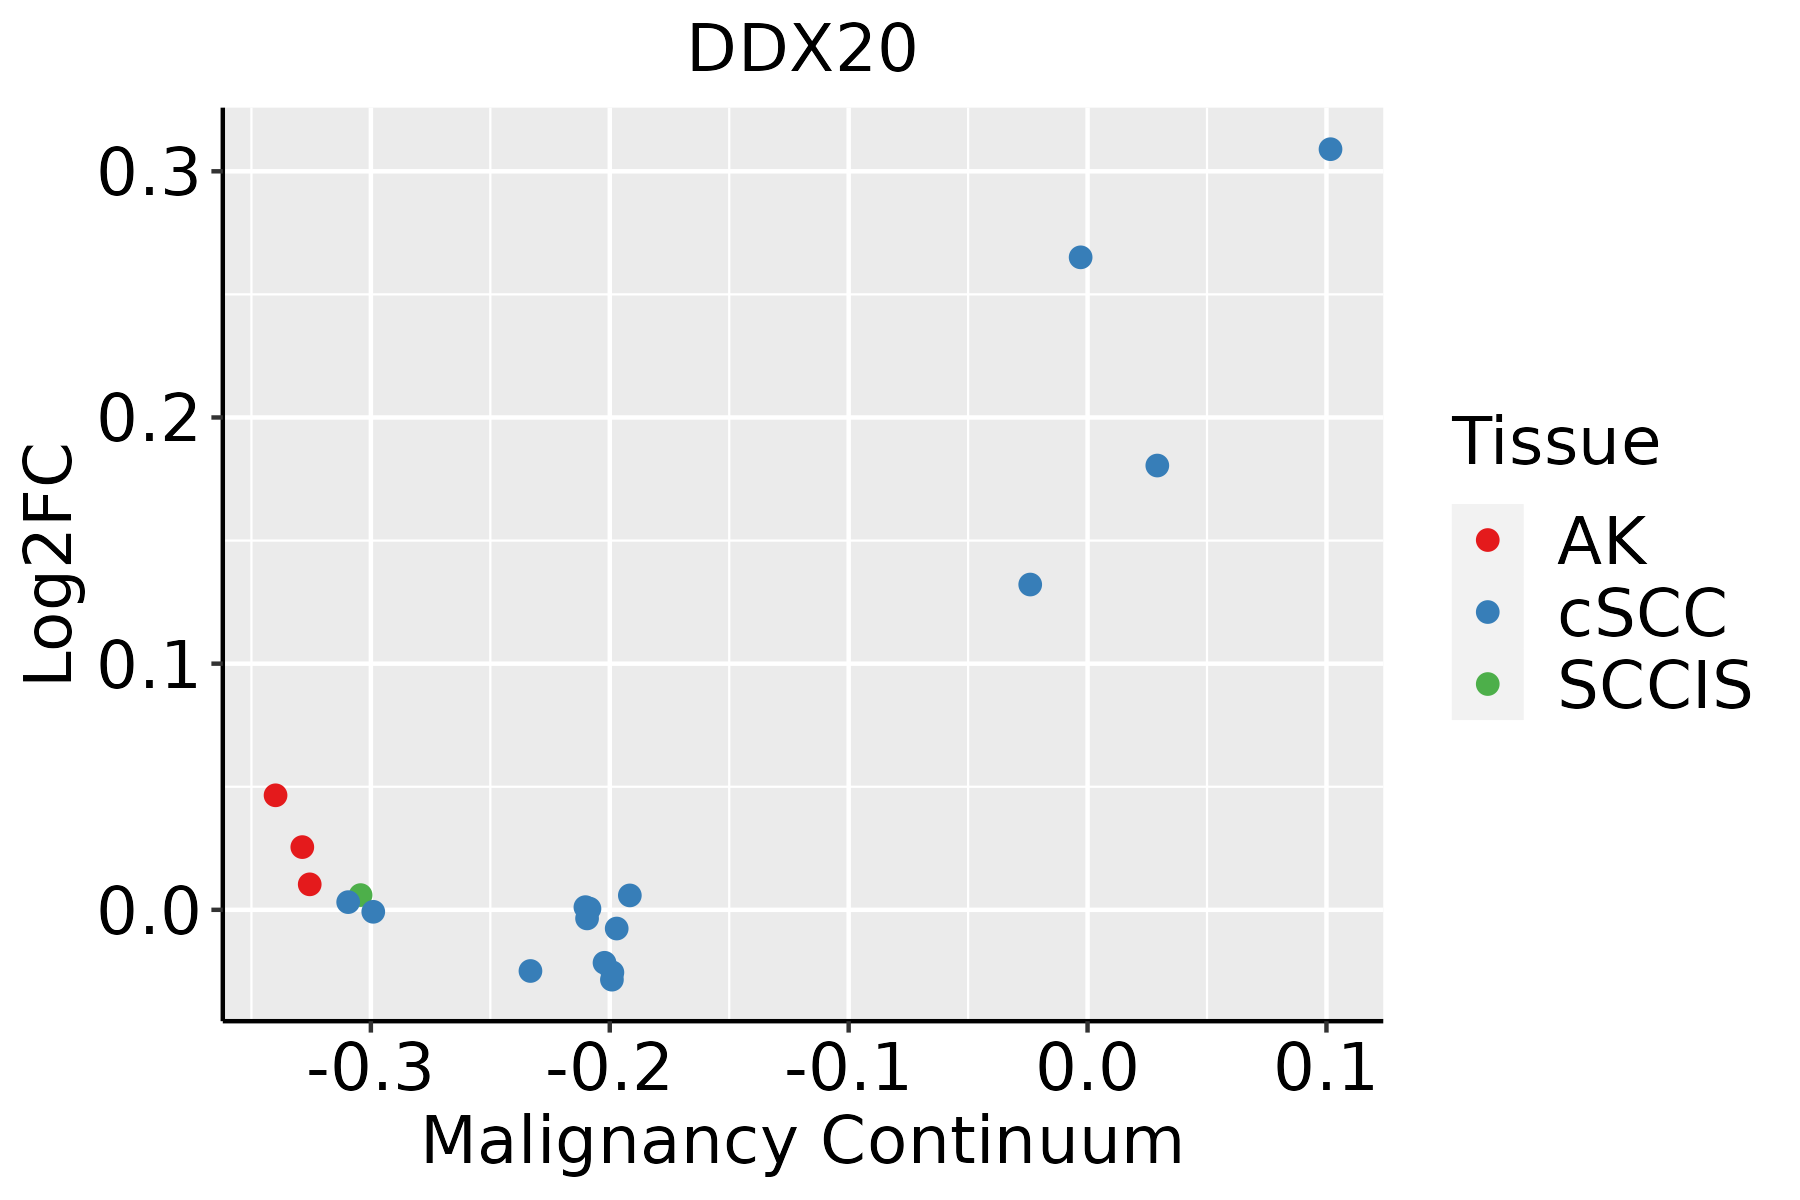 | AK: Actinic keratosis |
| cSCC: Cutaneous squamous cell carcinoma | ||
| SCCIS:squamous cell carcinoma in situ |
| ∗log2FC in expression of this searched gene in stem-like cells from each diseased tissue sample relative to stem-like cells in normal samples in each tissue plotted against the malignancy continuum. Samples are colored based on if they are from different disease stage. |
Top |
Malignant transformation related pathway analysis |
| Find out the enriched GO biological processes and KEGG pathways involved in transition from healthy to precancer to cancer |
| Tissue | Disease Stage | Enriched GO biological Processes |
| Colorectum | AD |  |
| Colorectum | SER |  |
| Colorectum | MSS |  |
| Colorectum | MSI-H |  |
| Colorectum | FAP |  |
| ∗Top 15 enriched GO BP terms are showed in the bar plot of each disease state in each tissue. Each row represents a significant GO biological process which is colored according to the -log10(p.adjust). |
| Page: 1 2 3 4 5 6 7 8 9 |
| GO ID | Tissue | Disease Stage | Description | Gene Ratio | Bg Ratio | pvalue | p.adjust | Count |
| GO:002261329 | Skin | cSCC | ribonucleoprotein complex biogenesis | 302/4864 | 463/18723 | 5.13e-72 | 3.22e-68 | 302 |
| GO:0008380112 | Skin | cSCC | RNA splicing | 263/4864 | 434/18723 | 2.45e-53 | 5.13e-50 | 263 |
| GO:0000375112 | Skin | cSCC | RNA splicing, via transesterification reactions | 201/4864 | 324/18723 | 4.07e-43 | 5.10e-40 | 201 |
| GO:0000377112 | Skin | cSCC | RNA splicing, via transesterification reactions with bulged adenosine as nucleophile | 197/4864 | 320/18723 | 1.45e-41 | 1.14e-38 | 197 |
| GO:0000398112 | Skin | cSCC | mRNA splicing, via spliceosome | 197/4864 | 320/18723 | 1.45e-41 | 1.14e-38 | 197 |
| GO:007182629 | Skin | cSCC | ribonucleoprotein complex subunit organization | 140/4864 | 227/18723 | 5.54e-30 | 3.16e-27 | 140 |
| GO:002261829 | Skin | cSCC | ribonucleoprotein complex assembly | 136/4864 | 220/18723 | 2.60e-29 | 1.25e-26 | 136 |
| GO:00003876 | Skin | cSCC | spliceosomal snRNP assembly | 26/4864 | 50/18723 | 7.51e-05 | 7.21e-04 | 26 |
| Page: 1 |
| Pathway ID | Tissue | Disease Stage | Description | Gene Ratio | Bg Ratio | pvalue | p.adjust | qvalue | Count |
| Page: 1 |
Top |
Cell-cell communication analysis |
| Identification of potential cell-cell interactions between two cell types and their ligand-receptor pairs for different disease states |
| Ligand | Receptor | LRpair | Pathway | Tissue | Disease Stage |
| Page: 1 |
Top |
Single-cell gene regulatory network inference analysis |
| Find out the significant the regulons (TFs) and the target genes of each regulon across cell types for different disease states |
| TF | Cell Type | Tissue | Disease Stage | Target Gene | RSS | Regulon Activity |
| ∗The dot plots of a searched regulon are shown for all cell subpopulations in each disease state of each tissue based on the regulon specific score inferred using pySCENIC and by calculating the average expression. |
| Page: 1 |
Top |
Somatic mutation of malignant transformation related genes |
| Annotation of somatic variants for genes involved in malignant transformation |
| Hugo Symbol | Variant Class | Variant Classification | dbSNP RS | HGVSc | HGVSp | HGVSp Short | SWISSPROT | BIOTYPE | SIFT | PolyPhen | Tumor Sample Barcode | Tissue | Histology | Sex | Age | Stage | Therapy Types | Drugs | Outcome |
| DDX20 | SNV | Missense_Mutation | rs746185964 | c.2015C>T | p.Ser672Leu | p.S672L | Q9UHI6 | protein_coding | deleterious(0.04) | benign(0.001) | TCGA-A2-A0D4-01 | Breast | breast invasive carcinoma | Female | <65 | I/II | Chemotherapy | adriamycin | SD |
| DDX20 | SNV | Missense_Mutation | rs763722623 | c.1112N>A | p.Arg371His | p.R371H | Q9UHI6 | protein_coding | deleterious(0) | probably_damaging(1) | TCGA-A8-A06X-01 | Breast | breast invasive carcinoma | Female | >=65 | I/II | Unknown | Unknown | SD |
| DDX20 | SNV | Missense_Mutation | c.1142N>C | p.Val381Ala | p.V381A | Q9UHI6 | protein_coding | deleterious(0) | probably_damaging(0.998) | TCGA-BH-A0HA-01 | Breast | breast invasive carcinoma | Female | <65 | I/II | Unknown | Unknown | SD | |
| DDX20 | SNV | Missense_Mutation | c.2398C>G | p.Gln800Glu | p.Q800E | Q9UHI6 | protein_coding | tolerated(0.21) | benign(0.057) | TCGA-C8-A26Y-01 | Breast | breast invasive carcinoma | Female | >=65 | I/II | Unknown | Unknown | SD | |
| DDX20 | SNV | Missense_Mutation | c.762N>C | p.Leu254Phe | p.L254F | Q9UHI6 | protein_coding | deleterious(0) | probably_damaging(0.998) | TCGA-D8-A1JA-01 | Breast | breast invasive carcinoma | Female | <65 | III/IV | Chemotherapy | adriamycin | PD | |
| DDX20 | SNV | Missense_Mutation | novel | c.540G>T | p.Lys180Asn | p.K180N | Q9UHI6 | protein_coding | tolerated(0.08) | benign(0.418) | TCGA-OL-A6VQ-01 | Breast | breast invasive carcinoma | Female | <65 | I/II | Unknown | Unknown | SD |
| DDX20 | SNV | Missense_Mutation | novel | c.2008N>T | p.Asn670Tyr | p.N670Y | Q9UHI6 | protein_coding | deleterious_low_confidence(0) | possibly_damaging(0.564) | TCGA-S3-AA10-01 | Breast | breast invasive carcinoma | Female | >=65 | I/II | Chemotherapy | cytoxan | CR |
| DDX20 | SNV | Missense_Mutation | novel | c.2402G>T | p.Arg801Ile | p.R801I | Q9UHI6 | protein_coding | deleterious_low_confidence(0) | possibly_damaging(0.854) | TCGA-2W-A8YY-01 | Cervix | cervical & endocervical cancer | Female | <65 | I/II | Chemotherapy | cisplatin | CR |
| DDX20 | SNV | Missense_Mutation | c.640N>C | p.Asp214His | p.D214H | Q9UHI6 | protein_coding | deleterious(0) | probably_damaging(1) | TCGA-IR-A3LA-01 | Cervix | cervical & endocervical cancer | Female | <65 | I/II | Chemotherapy | cisplatin | CR | |
| DDX20 | insertion | Nonsense_Mutation | novel | c.1752_1753insTAGCCATA | p.Gln585Ter | p.Q585* | Q9UHI6 | protein_coding | TCGA-JW-A69B-01 | Cervix | cervical & endocervical cancer | Female | <65 | I/II | Unknown | Unknown | SD |
| Page: 1 2 3 4 5 6 7 8 |
Top |
Related drugs of malignant transformation related genes |
| Identification of chemicals and drugs interact with genes involved in malignant transfromation |
| (DGIdb 4.0) |
| Entrez ID | Symbol | Category | Interaction Types | Drug Claim Name | Drug Name | PMIDs |
| Page: 1 |

Copyright 2023-Present -The University of Texas Health Science Center at Houston |