
|
|||||
|
 | |
| |
| |
| |
| |
| |
|
Gene: DDX18 |
Gene summary for DDX18 |
| Gene information | Species | Human | Gene symbol | DDX18 | Gene ID | 8886 |
| Gene name | DEAD-box helicase 18 | |
| Gene Alias | Has1 | |
| Cytomap | 2q14.1 | |
| Gene Type | protein-coding | GO ID | GO:0000463 | UniProtAcc | A0A024RAH8 |
Top |
Malignant transformation analysis |
| Identification of the aberrant gene expression in precancerous and cancerous lesions by comparing the gene expression of stem-like cells in diseased tissues with normal stem cells |
| Entrez ID | Symbol | Replicates | Species | Organ | Tissue | Adj P-value | Log2FC | Malignancy |
| 8886 | DDX18 | CA_HPV_1 | Human | Cervix | CC | 2.13e-06 | -1.45e-01 | 0.0264 |
| 8886 | DDX18 | CCI_1 | Human | Cervix | CC | 1.17e-03 | -5.13e-01 | 0.528 |
| 8886 | DDX18 | CCI_3 | Human | Cervix | CC | 3.89e-03 | -4.47e-01 | 0.516 |
| 8886 | DDX18 | CCII_1 | Human | Cervix | CC | 2.55e-14 | -5.89e-01 | 0.3249 |
| 8886 | DDX18 | L1 | Human | Cervix | CC | 6.43e-07 | -3.51e-01 | 0.0802 |
| 8886 | DDX18 | T3 | Human | Cervix | CC | 3.88e-04 | -1.79e-01 | 0.1389 |
| 8886 | DDX18 | HTA11_99999965104_69814 | Human | Colorectum | MSS | 6.80e-06 | 6.46e-01 | 0.281 |
| 8886 | DDX18 | HTA11_99999971662_82457 | Human | Colorectum | MSS | 5.33e-04 | 5.30e-01 | 0.3859 |
| 8886 | DDX18 | A001-C-207 | Human | Colorectum | FAP | 3.15e-02 | -1.93e-01 | 0.1278 |
| 8886 | DDX18 | A015-C-203 | Human | Colorectum | FAP | 6.68e-14 | -1.53e-01 | -0.1294 |
| 8886 | DDX18 | A002-C-201 | Human | Colorectum | FAP | 1.74e-06 | -8.41e-02 | 0.0324 |
| 8886 | DDX18 | A001-C-119 | Human | Colorectum | FAP | 1.67e-02 | -2.03e-01 | -0.1557 |
| 8886 | DDX18 | A001-C-108 | Human | Colorectum | FAP | 6.03e-08 | -3.16e-02 | -0.0272 |
| 8886 | DDX18 | A002-C-205 | Human | Colorectum | FAP | 4.77e-11 | -4.32e-02 | -0.1236 |
| 8886 | DDX18 | A015-C-006 | Human | Colorectum | FAP | 2.64e-07 | 2.88e-02 | -0.0994 |
| 8886 | DDX18 | A015-C-106 | Human | Colorectum | FAP | 1.64e-04 | -2.44e-02 | -0.0511 |
| 8886 | DDX18 | A002-C-114 | Human | Colorectum | FAP | 2.84e-10 | -1.35e-01 | -0.1561 |
| 8886 | DDX18 | A015-C-104 | Human | Colorectum | FAP | 8.00e-14 | -7.18e-02 | -0.1899 |
| 8886 | DDX18 | A001-C-014 | Human | Colorectum | FAP | 3.77e-06 | 9.94e-02 | 0.0135 |
| 8886 | DDX18 | A002-C-016 | Human | Colorectum | FAP | 1.55e-09 | -6.50e-02 | 0.0521 |
| Page: 1 2 3 4 5 6 7 8 9 10 |
| Tissue | Expression Dynamics | Abbreviation |
| Cervix |  | CC: Cervix cancer |
| HSIL_HPV: HPV-infected high-grade squamous intraepithelial lesions | ||
| N_HPV: HPV-infected normal cervix | ||
| Colorectum (GSE201348) |  | FAP: Familial adenomatous polyposis |
| CRC: Colorectal cancer | ||
| Colorectum (HTA11) |  | AD: Adenomas |
| SER: Sessile serrated lesions | ||
| MSI-H: Microsatellite-high colorectal cancer | ||
| MSS: Microsatellite stable colorectal cancer | ||
| Endometrium | 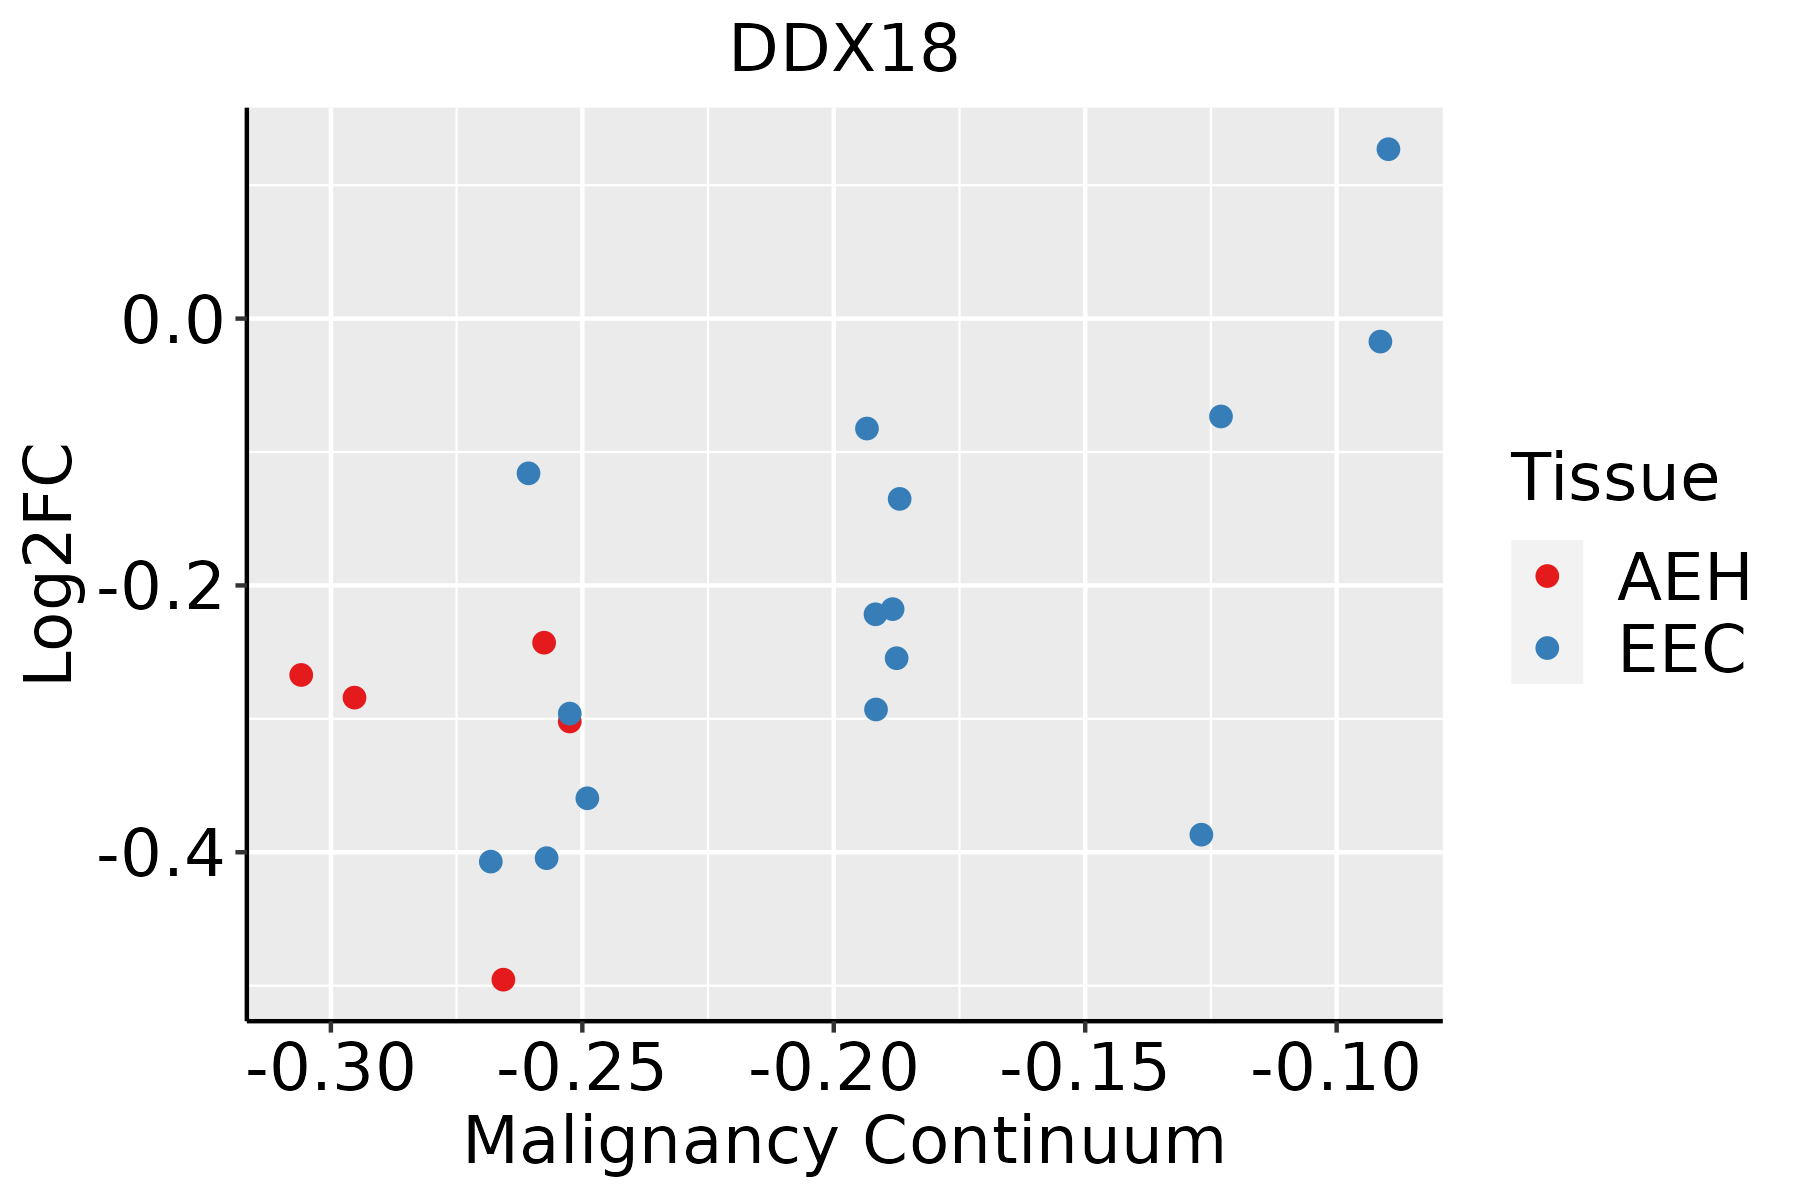 | AEH: Atypical endometrial hyperplasia |
| EEC: Endometrioid Cancer | ||
| Esophagus | 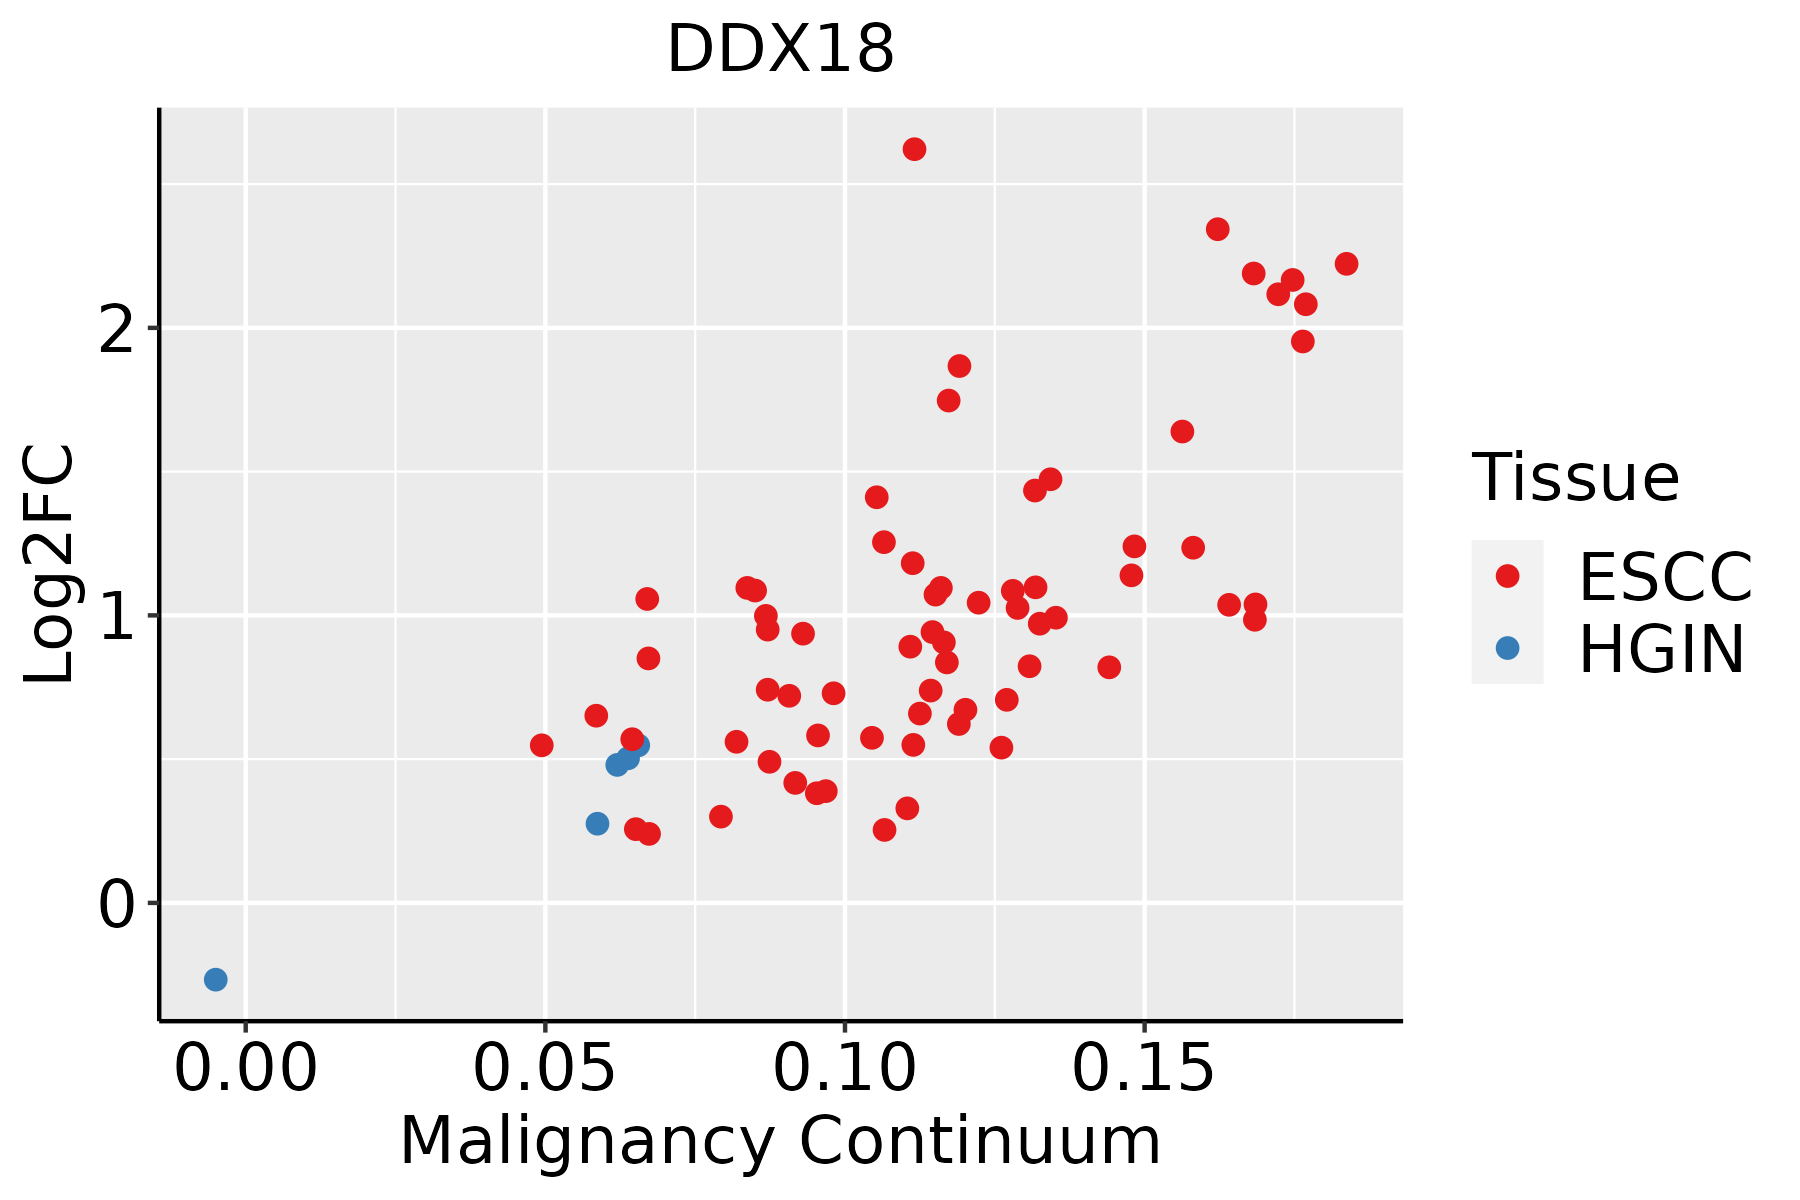 | ESCC: Esophageal squamous cell carcinoma |
| HGIN: High-grade intraepithelial neoplasias | ||
| LGIN: Low-grade intraepithelial neoplasias | ||
| Liver | 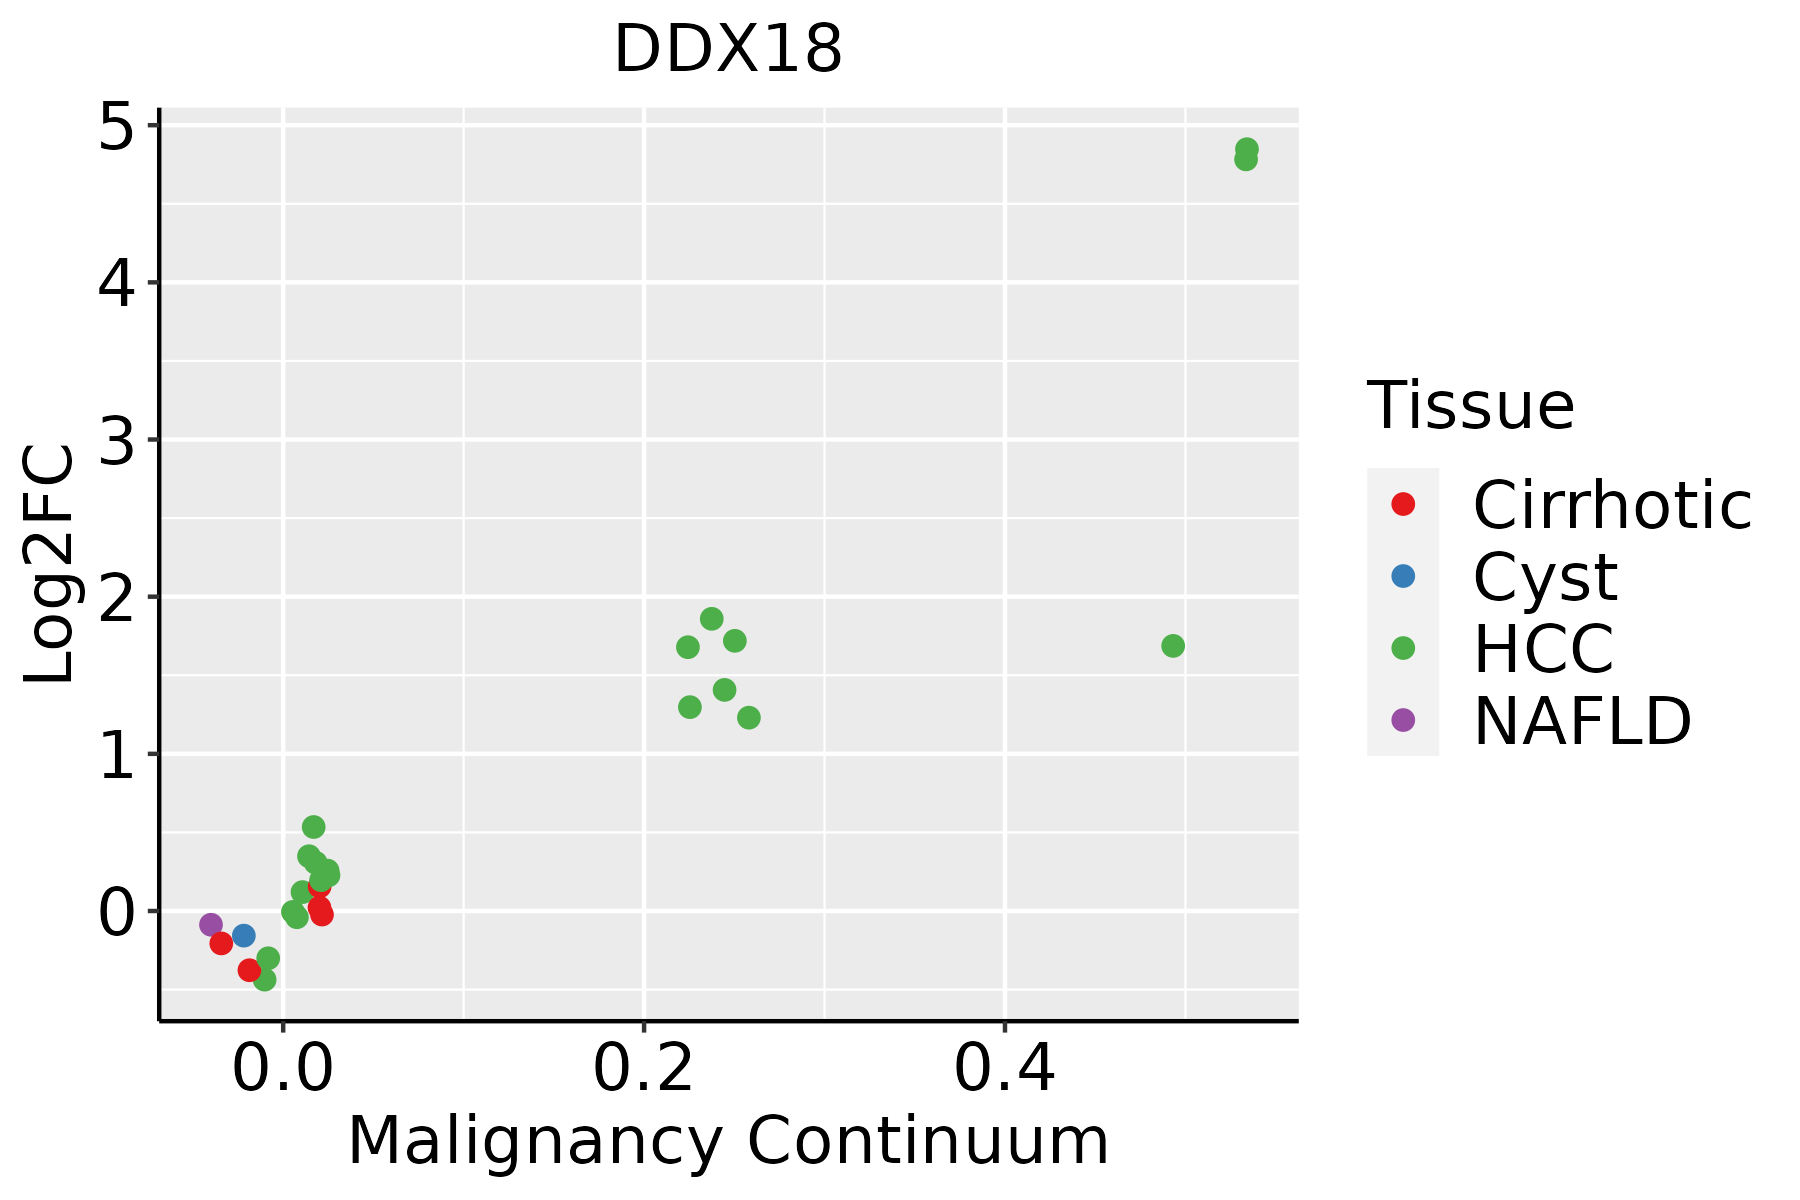 | HCC: Hepatocellular carcinoma |
| NAFLD: Non-alcoholic fatty liver disease | ||
| Oral Cavity | 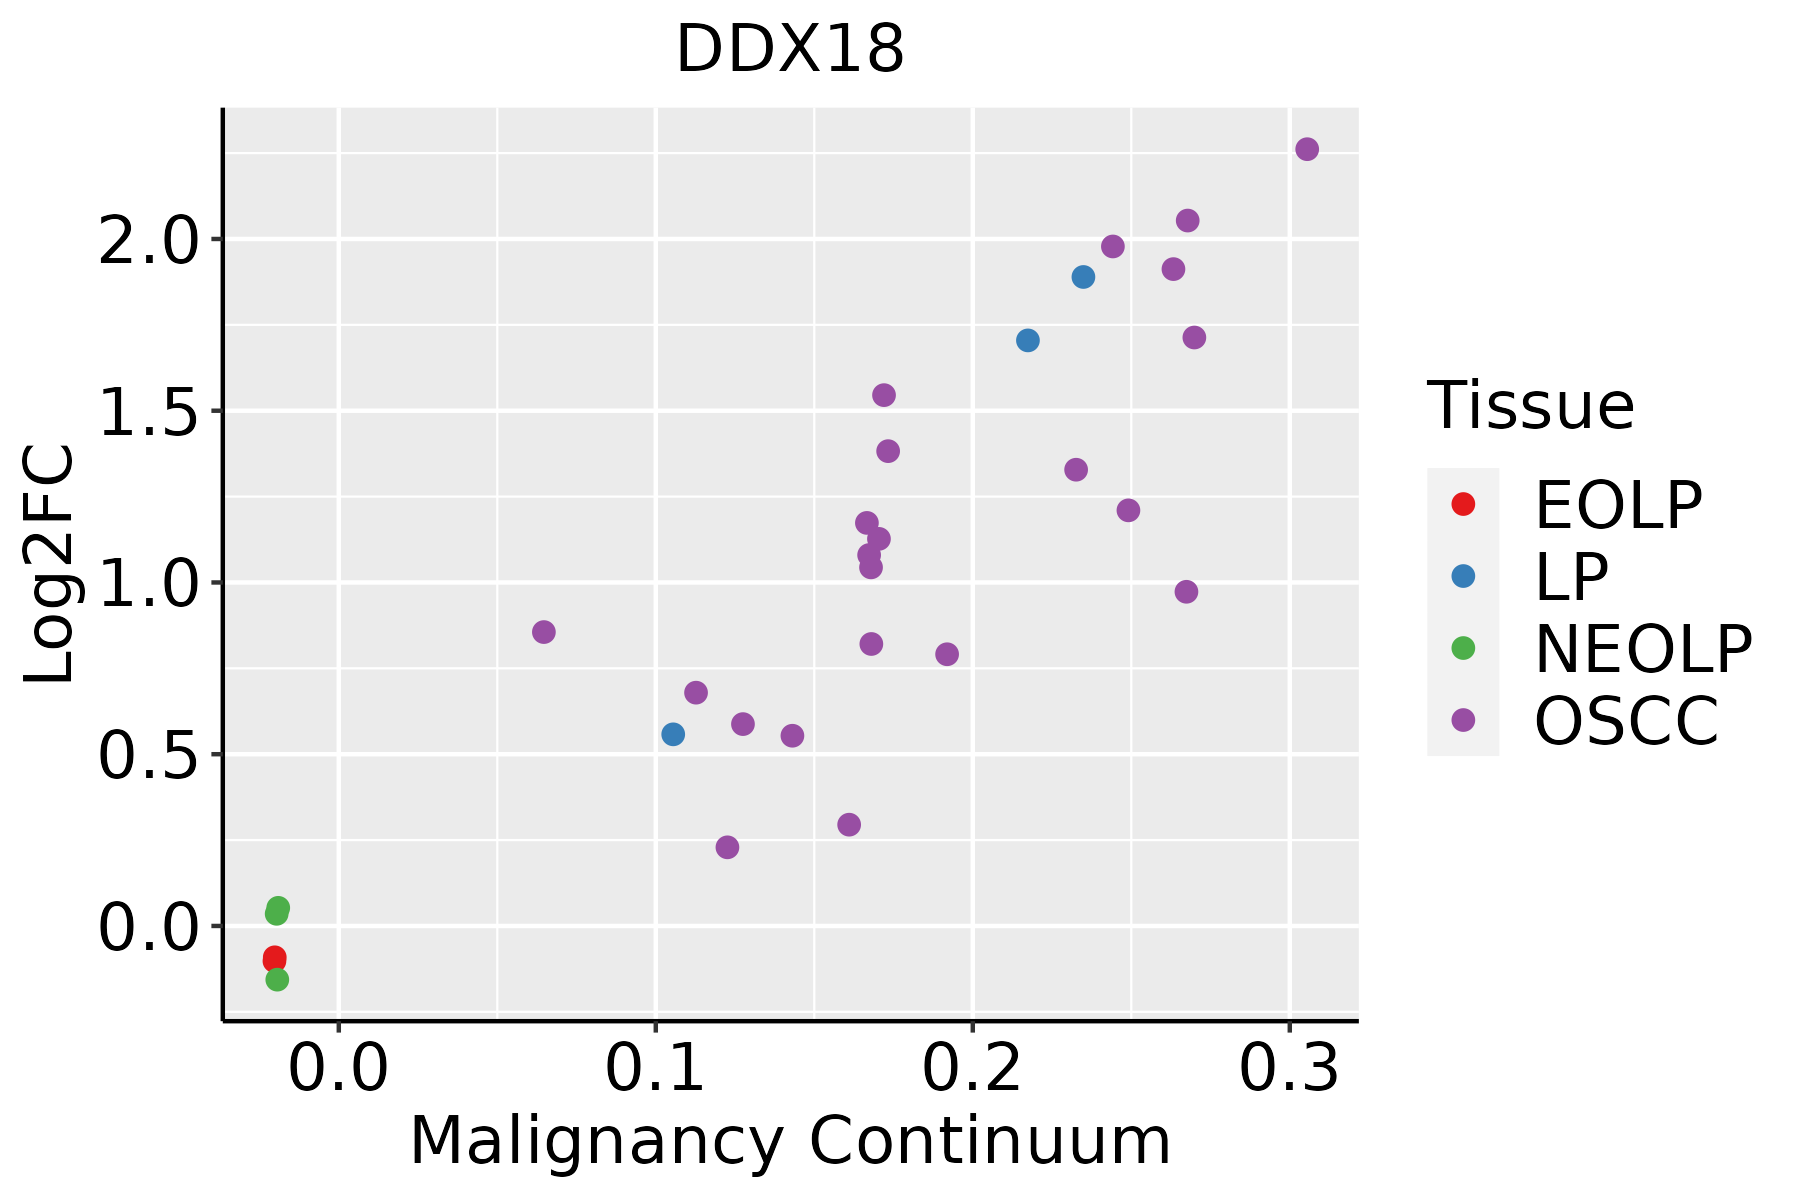 | EOLP: Erosive Oral lichen planus |
| LP: leukoplakia | ||
| NEOLP: Non-erosive oral lichen planus | ||
| OSCC: Oral squamous cell carcinoma | ||
| Prostate | 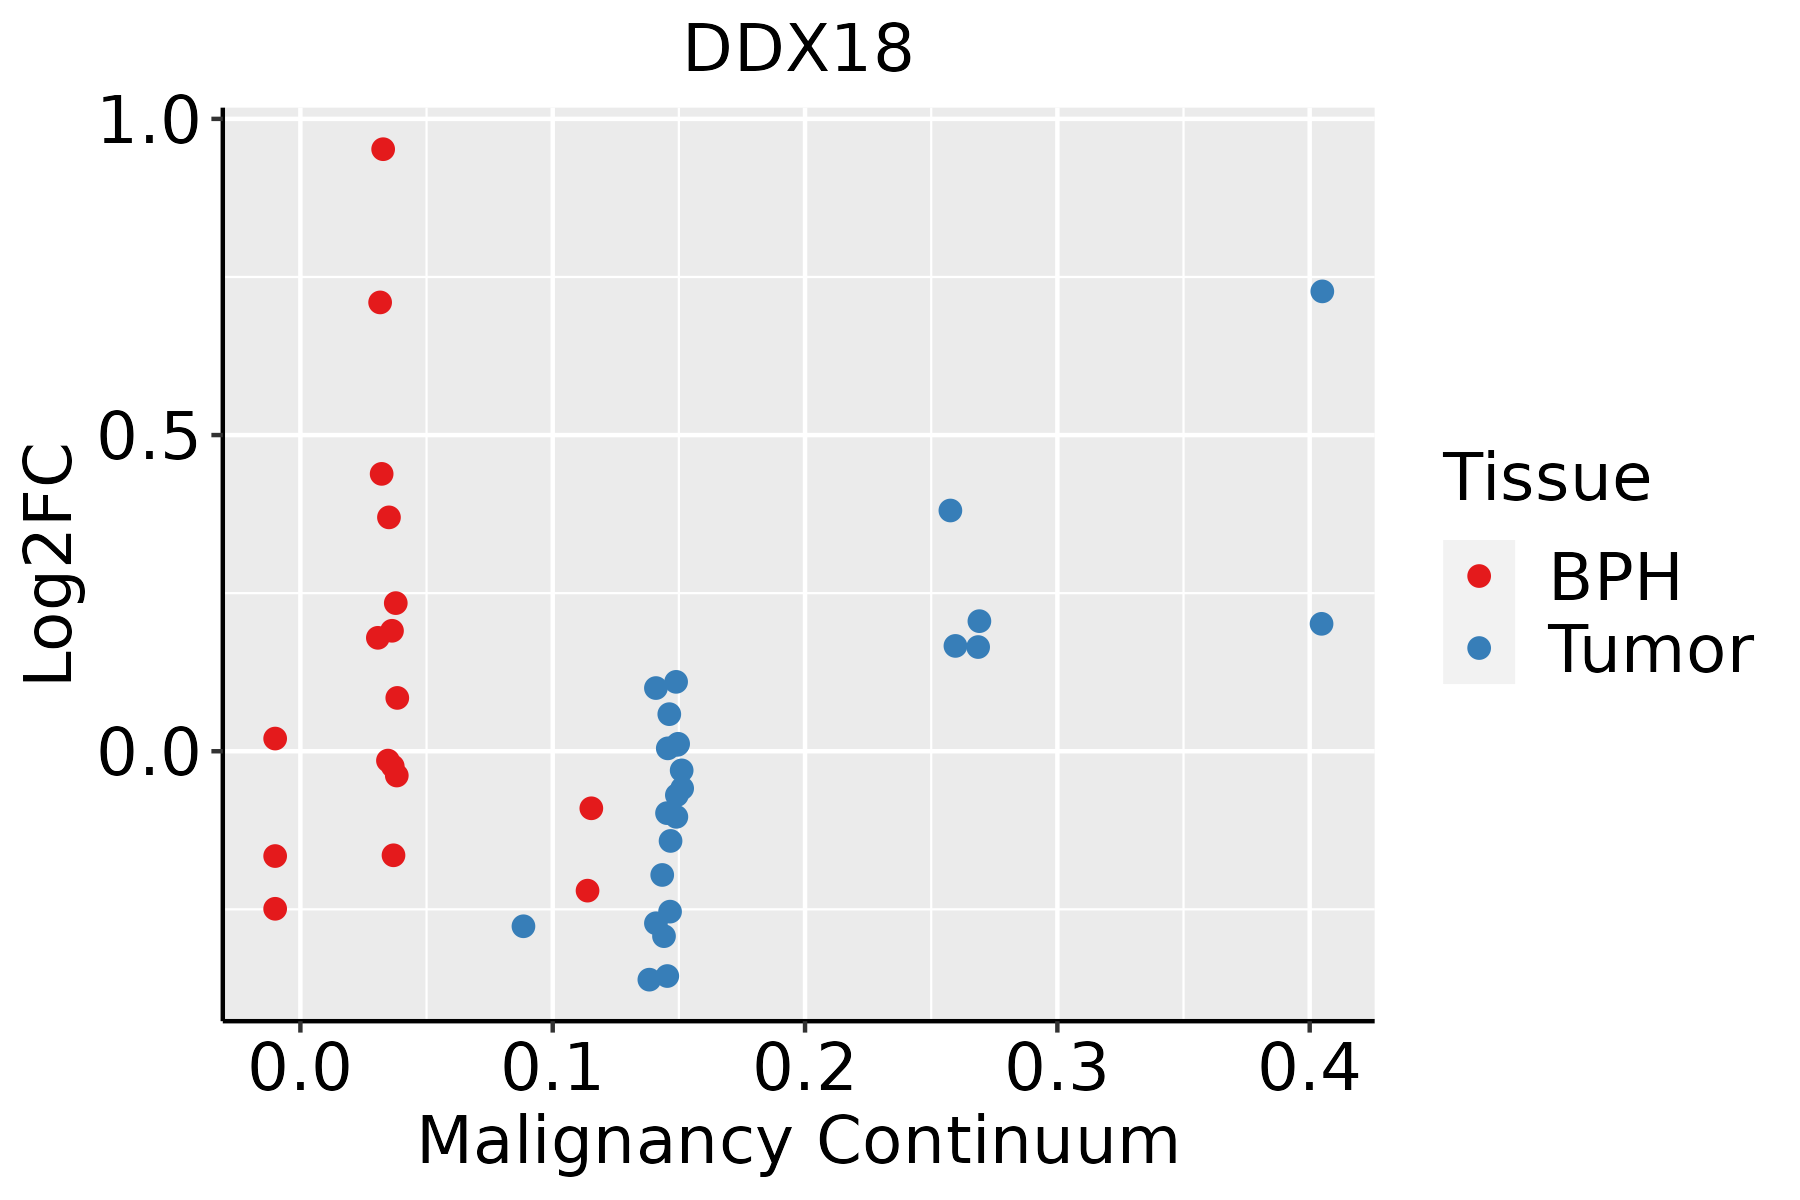 | BPH: Benign Prostatic Hyperplasia |
| Skin |  | AK: Actinic keratosis |
| cSCC: Cutaneous squamous cell carcinoma | ||
| SCCIS:squamous cell carcinoma in situ | ||
| Thyroid | 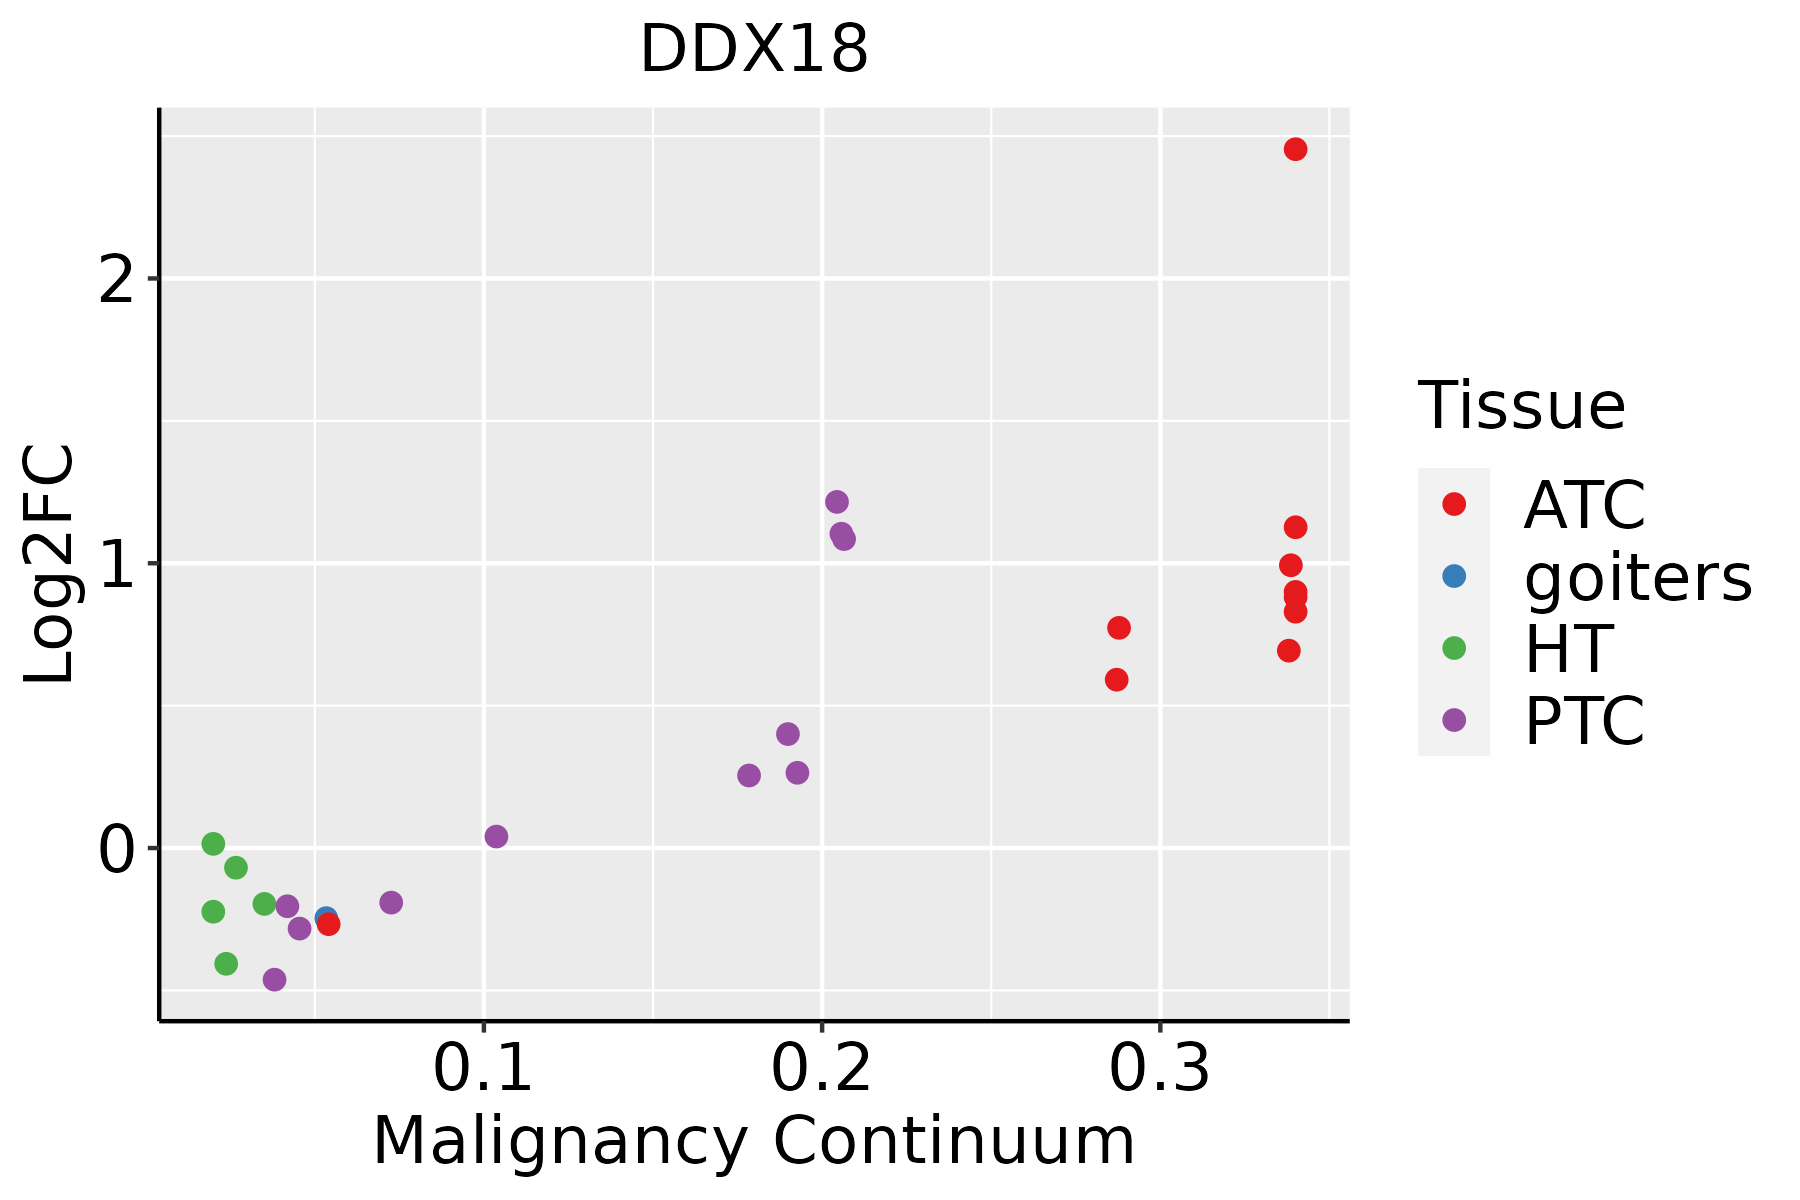 | ATC: Anaplastic thyroid cancer |
| HT: Hashimoto's thyroiditis | ||
| PTC: Papillary thyroid cancer |
| ∗log2FC in expression of this searched gene in stem-like cells from each diseased tissue sample relative to stem-like cells in normal samples in each tissue plotted against the malignancy continuum. Samples are colored based on if they are from different disease stage. |
Top |
Malignant transformation related pathway analysis |
| Find out the enriched GO biological processes and KEGG pathways involved in transition from healthy to precancer to cancer |
| Tissue | Disease Stage | Enriched GO biological Processes |
| Colorectum | AD |  |
| Colorectum | SER |  |
| Colorectum | MSS |  |
| Colorectum | MSI-H |  |
| Colorectum | FAP |  |
| ∗Top 15 enriched GO BP terms are showed in the bar plot of each disease state in each tissue. Each row represents a significant GO biological process which is colored according to the -log10(p.adjust). |
| Page: 1 2 3 4 5 6 7 8 9 |
| GO ID | Tissue | Disease Stage | Description | Gene Ratio | Bg Ratio | pvalue | p.adjust | Count |
| GO:004227310 | Cervix | CC | ribosomal large subunit biogenesis | 26/2311 | 72/18723 | 1.87e-07 | 8.48e-06 | 26 |
| GO:002261310 | Cervix | CC | ribonucleoprotein complex biogenesis | 88/2311 | 463/18723 | 2.11e-05 | 3.82e-04 | 88 |
| GO:004225410 | Cervix | CC | ribosome biogenesis | 62/2311 | 299/18723 | 2.48e-05 | 4.27e-04 | 62 |
| GO:00323556 | Cervix | CC | response to estradiol | 34/2311 | 141/18723 | 8.19e-05 | 1.11e-03 | 34 |
| GO:00160727 | Cervix | CC | rRNA metabolic process | 42/2311 | 236/18723 | 9.12e-03 | 4.60e-02 | 42 |
| GO:00226132 | Colorectum | MSS | ribonucleoprotein complex biogenesis | 144/3467 | 463/18723 | 2.76e-11 | 3.67e-09 | 144 |
| GO:00422732 | Colorectum | MSS | ribosomal large subunit biogenesis | 28/3467 | 72/18723 | 4.16e-05 | 7.83e-04 | 28 |
| GO:00422542 | Colorectum | MSS | ribosome biogenesis | 79/3467 | 299/18723 | 4.32e-04 | 5.23e-03 | 79 |
| GO:0000470 | Colorectum | MSS | maturation of LSU-rRNA | 12/3467 | 28/18723 | 2.53e-03 | 2.02e-02 | 12 |
| GO:0006364 | Colorectum | MSS | rRNA processing | 58/3467 | 225/18723 | 4.17e-03 | 3.03e-02 | 58 |
| GO:0016072 | Colorectum | MSS | rRNA metabolic process | 60/3467 | 236/18723 | 5.01e-03 | 3.46e-02 | 60 |
| GO:00226134 | Colorectum | FAP | ribonucleoprotein complex biogenesis | 91/2622 | 463/18723 | 4.28e-04 | 5.12e-03 | 91 |
| GO:00226135 | Colorectum | CRC | ribonucleoprotein complex biogenesis | 76/2078 | 463/18723 | 3.04e-04 | 4.78e-03 | 76 |
| GO:0032355 | Colorectum | CRC | response to estradiol | 27/2078 | 141/18723 | 3.24e-03 | 2.81e-02 | 27 |
| GO:002261316 | Endometrium | AEH | ribonucleoprotein complex biogenesis | 107/2100 | 463/18723 | 1.43e-13 | 4.08e-11 | 107 |
| GO:004227316 | Endometrium | AEH | ribosomal large subunit biogenesis | 30/2100 | 72/18723 | 3.69e-11 | 5.03e-09 | 30 |
| GO:004225416 | Endometrium | AEH | ribosome biogenesis | 67/2100 | 299/18723 | 1.95e-08 | 1.18e-06 | 67 |
| GO:00323557 | Endometrium | AEH | response to estradiol | 34/2100 | 141/18723 | 1.13e-05 | 2.53e-04 | 34 |
| GO:00063648 | Endometrium | AEH | rRNA processing | 47/2100 | 225/18723 | 1.78e-05 | 3.65e-04 | 47 |
| GO:00004704 | Endometrium | AEH | maturation of LSU-rRNA | 12/2100 | 28/18723 | 2.08e-05 | 4.13e-04 | 12 |
| Page: 1 2 3 4 5 6 7 |
| Pathway ID | Tissue | Disease Stage | Description | Gene Ratio | Bg Ratio | pvalue | p.adjust | qvalue | Count |
| Page: 1 |
Top |
Cell-cell communication analysis |
| Identification of potential cell-cell interactions between two cell types and their ligand-receptor pairs for different disease states |
| Ligand | Receptor | LRpair | Pathway | Tissue | Disease Stage |
| Page: 1 |
Top |
Single-cell gene regulatory network inference analysis |
| Find out the significant the regulons (TFs) and the target genes of each regulon across cell types for different disease states |
| TF | Cell Type | Tissue | Disease Stage | Target Gene | RSS | Regulon Activity |
| ∗The dot plots of a searched regulon are shown for all cell subpopulations in each disease state of each tissue based on the regulon specific score inferred using pySCENIC and by calculating the average expression. |
| Page: 1 |
Top |
Somatic mutation of malignant transformation related genes |
| Annotation of somatic variants for genes involved in malignant transformation |
| Hugo Symbol | Variant Class | Variant Classification | dbSNP RS | HGVSc | HGVSp | HGVSp Short | SWISSPROT | BIOTYPE | SIFT | PolyPhen | Tumor Sample Barcode | Tissue | Histology | Sex | Age | Stage | Therapy Types | Drugs | Outcome |
| DDX18 | SNV | Missense_Mutation | novel | c.135N>C | p.Glu45Asp | p.E45D | Q9NVP1 | protein_coding | tolerated_low_confidence(0.29) | benign(0) | TCGA-AN-A046-01 | Breast | breast invasive carcinoma | Female | >=65 | I/II | Unknown | Unknown | SD |
| DDX18 | SNV | Missense_Mutation | c.1106N>A | p.Arg369Gln | p.R369Q | Q9NVP1 | protein_coding | tolerated(0.51) | benign(0.01) | TCGA-D8-A1XM-01 | Breast | breast invasive carcinoma | Female | <65 | I/II | Unknown | Unknown | SD | |
| DDX18 | SNV | Missense_Mutation | c.1117G>C | p.Asp373His | p.D373H | Q9NVP1 | protein_coding | deleterious(0) | benign(0.264) | TCGA-E2-A1LH-01 | Breast | breast invasive carcinoma | Female | <65 | I/II | Chemotherapy | adriamycin | SD | |
| DDX18 | SNV | Missense_Mutation | c.382N>A | p.Ala128Thr | p.A128T | Q9NVP1 | protein_coding | tolerated(0.21) | benign(0) | TCGA-GM-A2DI-01 | Breast | breast invasive carcinoma | Female | <65 | I/II | Chemotherapy | taxotere | CR | |
| DDX18 | SNV | Missense_Mutation | rs374687356 | c.1616G>A | p.Arg539His | p.R539H | Q9NVP1 | protein_coding | tolerated(0.06) | benign(0.015) | TCGA-LL-A6FQ-01 | Breast | breast invasive carcinoma | Female | >=65 | III/IV | Unknown | Unknown | SD |
| DDX18 | SNV | Missense_Mutation | c.1117G>T | p.Asp373Tyr | p.D373Y | Q9NVP1 | protein_coding | deleterious(0) | benign(0.115) | TCGA-2W-A8YY-01 | Cervix | cervical & endocervical cancer | Female | <65 | I/II | Chemotherapy | cisplatin | CR | |
| DDX18 | SNV | Missense_Mutation | c.1460G>A | p.Arg487Lys | p.R487K | Q9NVP1 | protein_coding | deleterious(0) | probably_damaging(0.999) | TCGA-DS-A1OB-01 | Cervix | cervical & endocervical cancer | Female | <65 | I/II | Chemotherapy | carboplatin | PD | |
| DDX18 | SNV | Missense_Mutation | c.1696N>C | p.Glu566Gln | p.E566Q | Q9NVP1 | protein_coding | deleterious(0.01) | benign(0.098) | TCGA-UC-A7PF-01 | Cervix | cervical & endocervical cancer | Female | <65 | I/II | Unknown | Unknown | SD | |
| DDX18 | SNV | Missense_Mutation | c.1012N>C | p.Ile338Leu | p.I338L | Q9NVP1 | protein_coding | deleterious(0.02) | benign(0.019) | TCGA-A6-6653-01 | Colorectum | colon adenocarcinoma | Male | >=65 | I/II | Unknown | Unknown | SD | |
| DDX18 | SNV | Missense_Mutation | c.769N>T | p.Leu257Phe | p.L257F | Q9NVP1 | protein_coding | deleterious(0) | probably_damaging(0.951) | TCGA-AA-3489-01 | Colorectum | colon adenocarcinoma | Male | >=65 | I/II | Unknown | Unknown | PD |
| Page: 1 2 3 4 5 6 7 8 9 |
Top |
Related drugs of malignant transformation related genes |
| Identification of chemicals and drugs interact with genes involved in malignant transfromation |
| (DGIdb 4.0) |
| Entrez ID | Symbol | Category | Interaction Types | Drug Claim Name | Drug Name | PMIDs |
| Page: 1 |

Copyright 2023-Present -The University of Texas Health Science Center at Houston |