
|
|||||
|
 | |
| |
| |
| |
| |
| |
|
Gene: DDX11 |
Gene summary for DDX11 |
| Gene information | Species | Human | Gene symbol | DDX11 | Gene ID | 1663 |
| Gene name | DEAD/H-box helicase 11 | |
| Gene Alias | CHL1 | |
| Cytomap | 12p11.21 | |
| Gene Type | protein-coding | GO ID | GO:0000819 | UniProtAcc | Q96FC9 |
Top |
Malignant transformation analysis |
| Identification of the aberrant gene expression in precancerous and cancerous lesions by comparing the gene expression of stem-like cells in diseased tissues with normal stem cells |
| Entrez ID | Symbol | Replicates | Species | Organ | Tissue | Adj P-value | Log2FC | Malignancy |
| 1663 | DDX11 | LZE7T | Human | Esophagus | ESCC | 5.63e-09 | 2.61e-01 | 0.0667 |
| 1663 | DDX11 | LZE21D1 | Human | Esophagus | HGIN | 2.16e-02 | 1.88e-01 | 0.0632 |
| 1663 | DDX11 | LZE24T | Human | Esophagus | ESCC | 7.03e-03 | 9.56e-02 | 0.0596 |
| 1663 | DDX11 | LZE21T | Human | Esophagus | ESCC | 1.22e-02 | 2.14e-01 | 0.0655 |
| 1663 | DDX11 | P1T-E | Human | Esophagus | ESCC | 2.46e-04 | 1.83e-01 | 0.0875 |
| 1663 | DDX11 | P2T-E | Human | Esophagus | ESCC | 7.28e-12 | 3.55e-01 | 0.1177 |
| 1663 | DDX11 | P4T-E | Human | Esophagus | ESCC | 8.55e-06 | 1.37e-01 | 0.1323 |
| 1663 | DDX11 | P5T-E | Human | Esophagus | ESCC | 3.07e-11 | 2.12e-01 | 0.1327 |
| 1663 | DDX11 | P8T-E | Human | Esophagus | ESCC | 1.25e-13 | 2.54e-01 | 0.0889 |
| 1663 | DDX11 | P9T-E | Human | Esophagus | ESCC | 9.68e-03 | 5.43e-02 | 0.1131 |
| 1663 | DDX11 | P10T-E | Human | Esophagus | ESCC | 1.00e-14 | 4.15e-01 | 0.116 |
| 1663 | DDX11 | P12T-E | Human | Esophagus | ESCC | 6.79e-09 | 2.18e-01 | 0.1122 |
| 1663 | DDX11 | P16T-E | Human | Esophagus | ESCC | 7.18e-17 | 4.37e-01 | 0.1153 |
| 1663 | DDX11 | P20T-E | Human | Esophagus | ESCC | 3.25e-10 | 2.51e-01 | 0.1124 |
| 1663 | DDX11 | P21T-E | Human | Esophagus | ESCC | 2.33e-02 | 6.10e-02 | 0.1617 |
| 1663 | DDX11 | P22T-E | Human | Esophagus | ESCC | 5.52e-12 | 2.66e-01 | 0.1236 |
| 1663 | DDX11 | P23T-E | Human | Esophagus | ESCC | 4.70e-05 | 1.01e-01 | 0.108 |
| 1663 | DDX11 | P24T-E | Human | Esophagus | ESCC | 1.73e-05 | 1.36e-01 | 0.1287 |
| 1663 | DDX11 | P26T-E | Human | Esophagus | ESCC | 1.41e-04 | 4.88e-02 | 0.1276 |
| 1663 | DDX11 | P27T-E | Human | Esophagus | ESCC | 3.11e-09 | 2.29e-01 | 0.1055 |
| Page: 1 2 3 4 |
| Tissue | Expression Dynamics | Abbreviation |
| Esophagus | 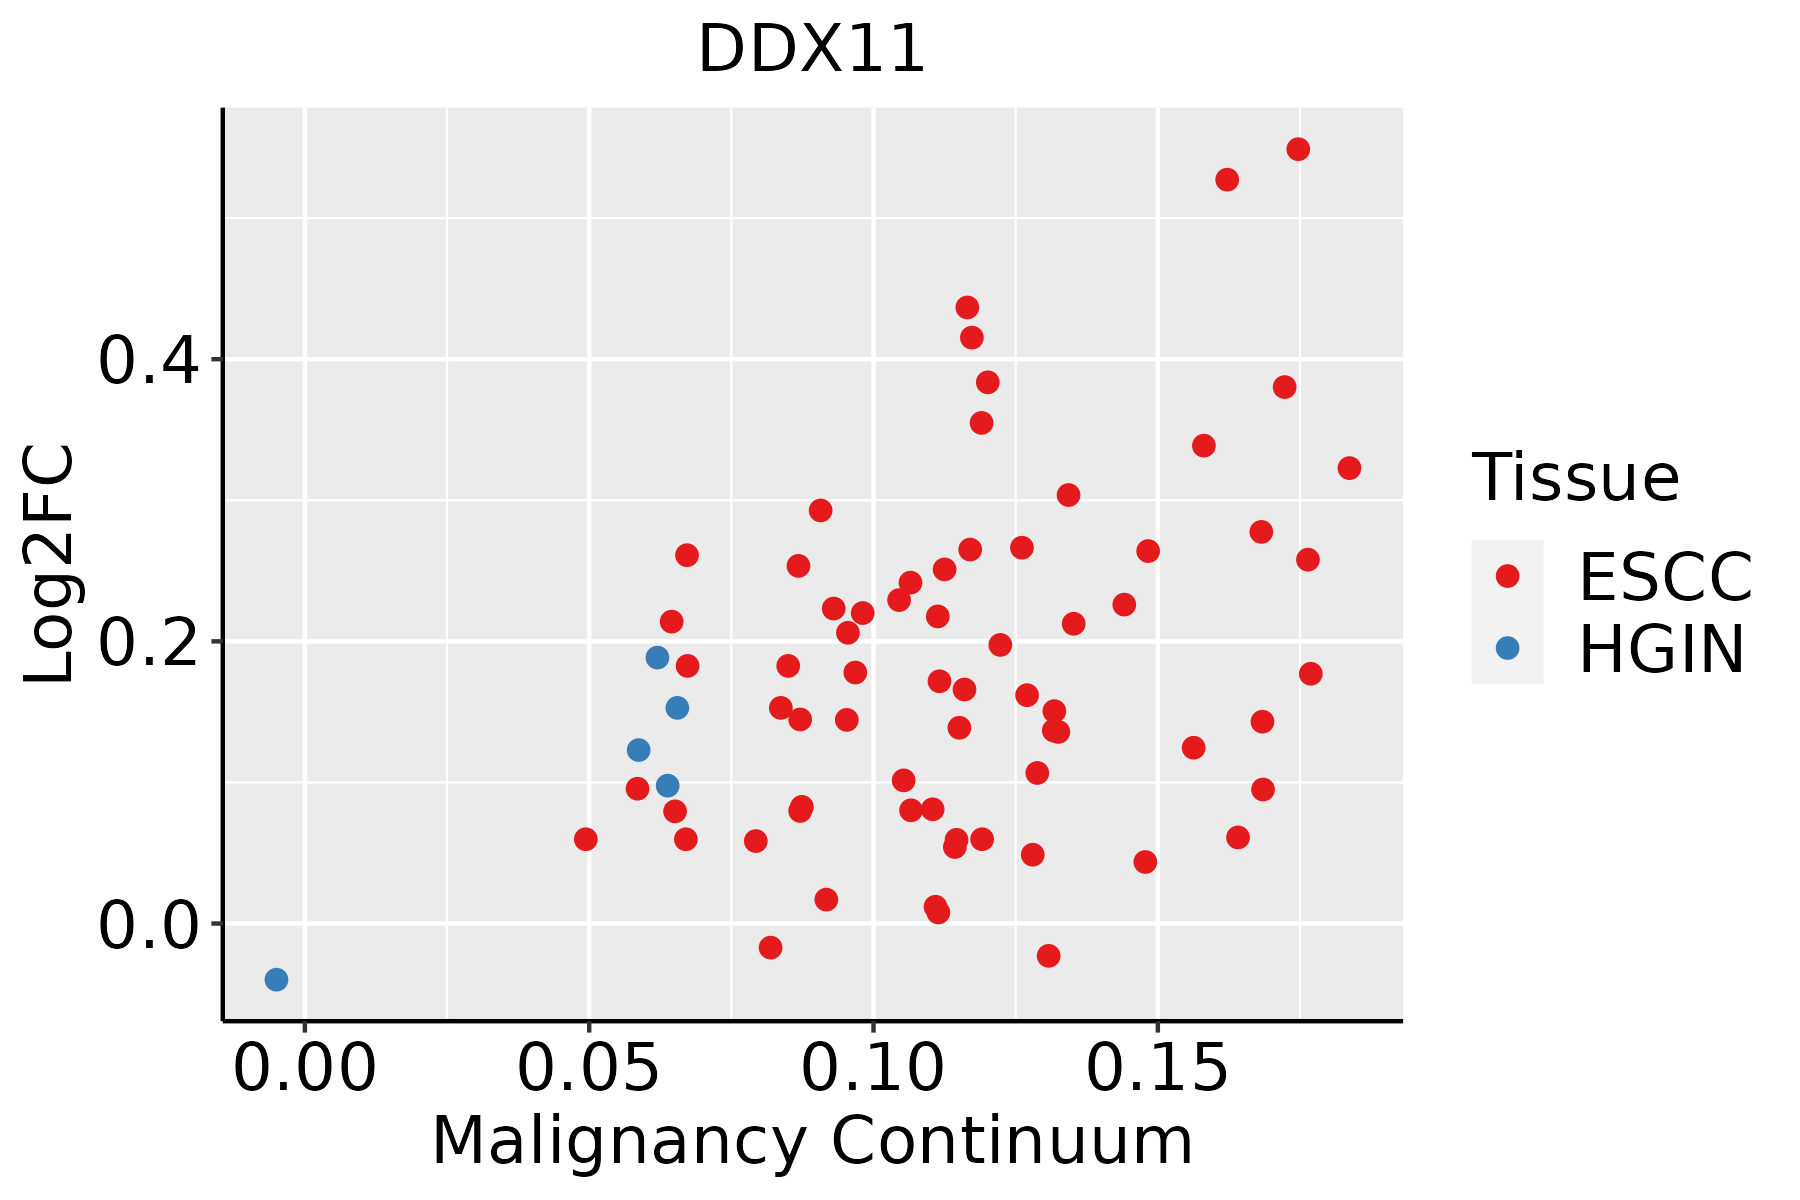 | ESCC: Esophageal squamous cell carcinoma |
| HGIN: High-grade intraepithelial neoplasias | ||
| LGIN: Low-grade intraepithelial neoplasias | ||
| Liver | 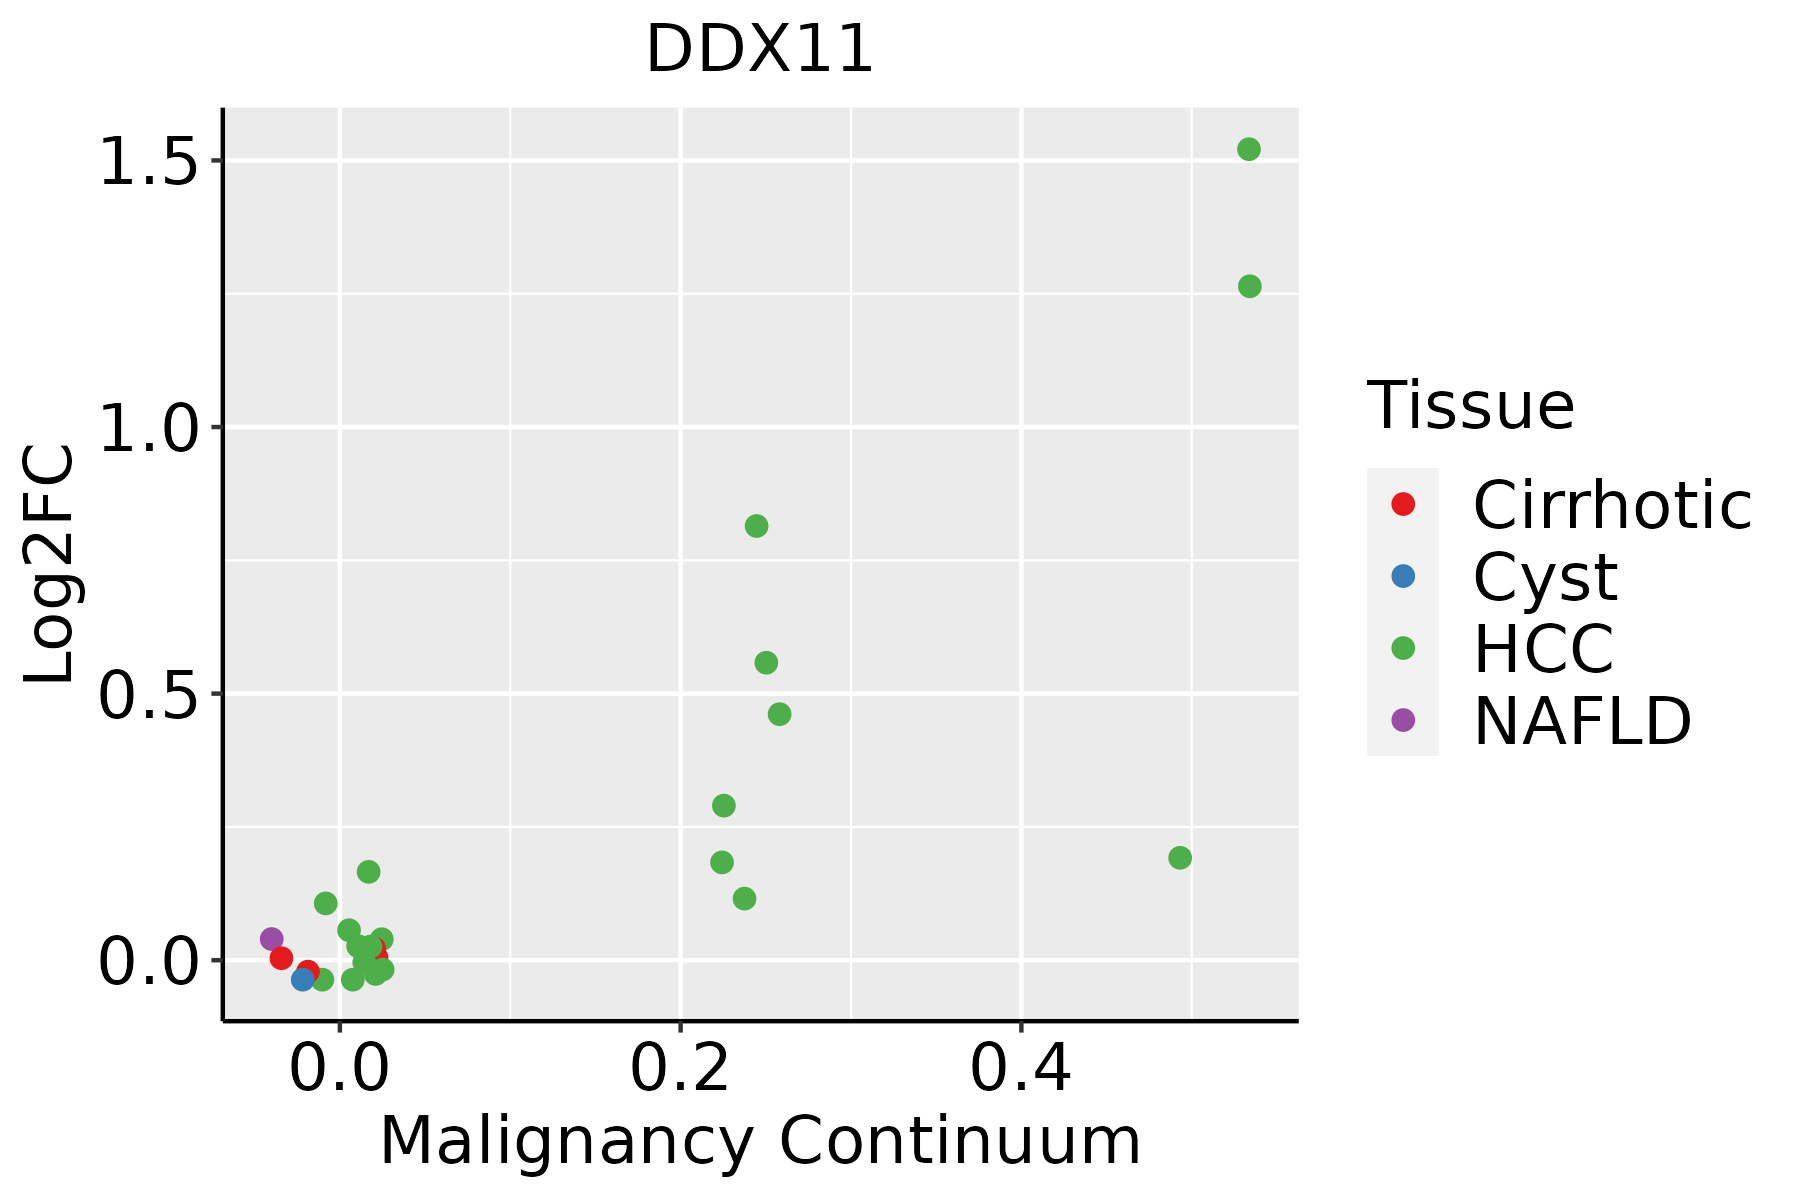 | HCC: Hepatocellular carcinoma |
| NAFLD: Non-alcoholic fatty liver disease | ||
| Oral Cavity | 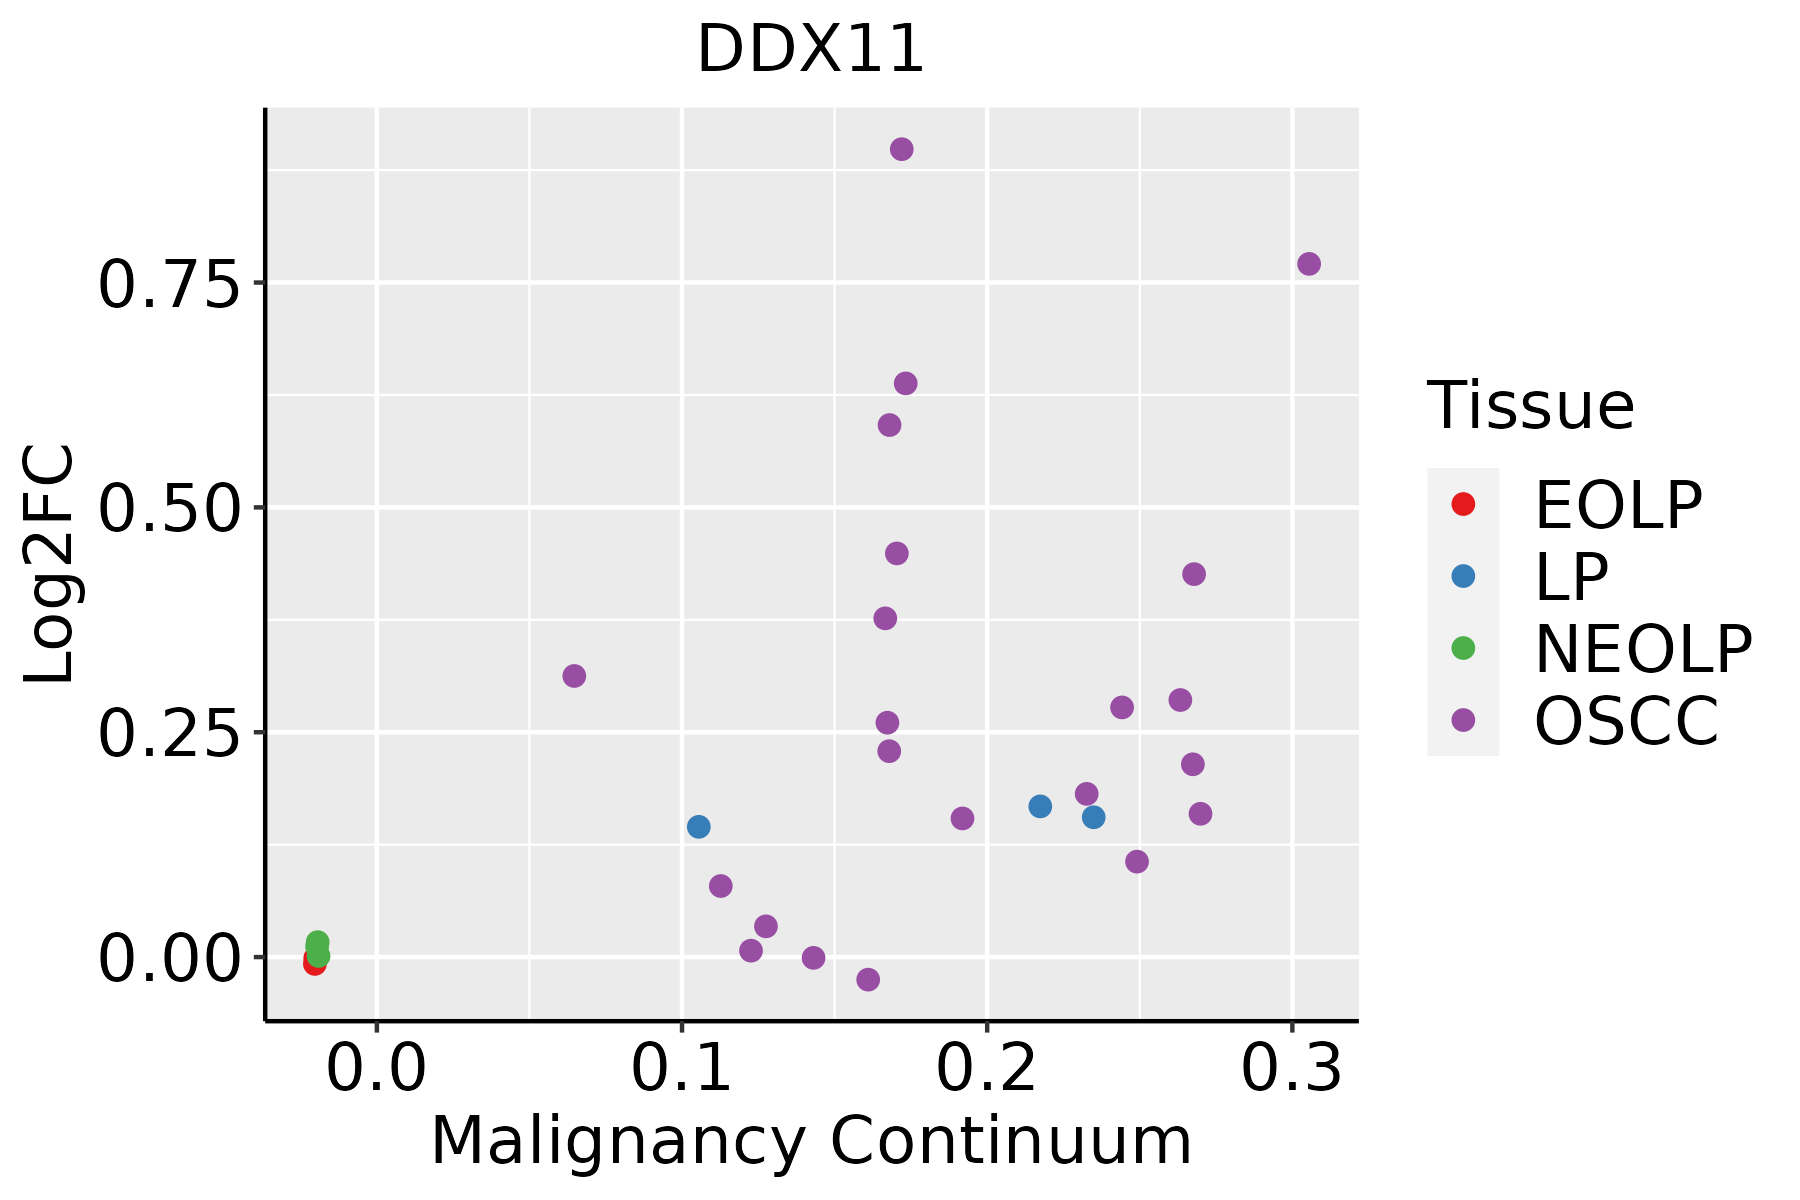 | EOLP: Erosive Oral lichen planus |
| LP: leukoplakia | ||
| NEOLP: Non-erosive oral lichen planus | ||
| OSCC: Oral squamous cell carcinoma |
| ∗log2FC in expression of this searched gene in stem-like cells from each diseased tissue sample relative to stem-like cells in normal samples in each tissue plotted against the malignancy continuum. Samples are colored based on if they are from different disease stage. |
Top |
Malignant transformation related pathway analysis |
| Find out the enriched GO biological processes and KEGG pathways involved in transition from healthy to precancer to cancer |
| Tissue | Disease Stage | Enriched GO biological Processes |
| Colorectum | AD |  |
| Colorectum | SER |  |
| Colorectum | MSS |  |
| Colorectum | MSI-H |  |
| Colorectum | FAP |  |
| ∗Top 15 enriched GO BP terms are showed in the bar plot of each disease state in each tissue. Each row represents a significant GO biological process which is colored according to the -log10(p.adjust). |
| Page: 1 2 3 4 5 6 7 8 9 |
| GO ID | Tissue | Disease Stage | Description | Gene Ratio | Bg Ratio | pvalue | p.adjust | Count |
| GO:200125218 | Esophagus | HGIN | positive regulation of chromosome organization | 30/2587 | 82/18723 | 2.00e-07 | 9.68e-06 | 30 |
| GO:00330449 | Esophagus | HGIN | regulation of chromosome organization | 51/2587 | 187/18723 | 8.91e-07 | 3.61e-05 | 51 |
| GO:000632516 | Esophagus | HGIN | chromatin organization | 92/2587 | 409/18723 | 1.05e-06 | 4.16e-05 | 92 |
| GO:005105214 | Esophagus | HGIN | regulation of DNA metabolic process | 79/2587 | 359/18723 | 1.38e-05 | 3.85e-04 | 79 |
| GO:005109825 | Esophagus | HGIN | regulation of binding | 78/2587 | 363/18723 | 3.73e-05 | 9.30e-04 | 78 |
| GO:200102019 | Esophagus | HGIN | regulation of response to DNA damage stimulus | 52/2587 | 219/18723 | 5.00e-05 | 1.19e-03 | 52 |
| GO:005109925 | Esophagus | HGIN | positive regulation of binding | 42/2587 | 173/18723 | 1.51e-04 | 2.97e-03 | 42 |
| GO:005105416 | Esophagus | HGIN | positive regulation of DNA metabolic process | 47/2587 | 201/18723 | 1.65e-04 | 3.21e-03 | 47 |
| GO:00069975 | Esophagus | HGIN | nucleus organization | 34/2587 | 133/18723 | 2.20e-04 | 4.00e-03 | 34 |
| GO:00070593 | Esophagus | HGIN | chromosome segregation | 71/2587 | 346/18723 | 3.47e-04 | 5.62e-03 | 71 |
| GO:00323926 | Esophagus | HGIN | DNA geometric change | 25/2587 | 90/18723 | 3.77e-04 | 5.85e-03 | 25 |
| GO:00325084 | Esophagus | HGIN | DNA duplex unwinding | 22/2587 | 84/18723 | 1.91e-03 | 2.03e-02 | 22 |
| GO:190165318 | Esophagus | HGIN | cellular response to peptide | 68/2587 | 359/18723 | 3.88e-03 | 3.54e-02 | 68 |
| GO:003209110 | Esophagus | HGIN | negative regulation of protein binding | 23/2587 | 94/18723 | 3.92e-03 | 3.54e-02 | 23 |
| GO:005110020 | Esophagus | HGIN | negative regulation of binding | 35/2587 | 162/18723 | 4.32e-03 | 3.84e-02 | 35 |
| GO:00008194 | Esophagus | ESCC | sister chromatid segregation | 157/8552 | 202/18723 | 8.41e-21 | 1.33e-18 | 157 |
| GO:0051098111 | Esophagus | ESCC | regulation of binding | 251/8552 | 363/18723 | 6.73e-20 | 8.46e-18 | 251 |
| GO:003304416 | Esophagus | ESCC | regulation of chromosome organization | 145/8552 | 187/18723 | 3.80e-19 | 4.31e-17 | 145 |
| GO:000705911 | Esophagus | ESCC | chromosome segregation | 238/8552 | 346/18723 | 1.72e-18 | 1.82e-16 | 238 |
| GO:00062604 | Esophagus | ESCC | DNA replication | 181/8552 | 260/18723 | 3.55e-15 | 2.05e-13 | 181 |
| Page: 1 2 3 4 5 6 7 |
| Pathway ID | Tissue | Disease Stage | Description | Gene Ratio | Bg Ratio | pvalue | p.adjust | qvalue | Count |
| hsa041109 | Esophagus | HGIN | Cell cycle | 38/1383 | 157/8465 | 6.70e-03 | 4.37e-02 | 3.47e-02 | 38 |
| hsa0411016 | Esophagus | HGIN | Cell cycle | 38/1383 | 157/8465 | 6.70e-03 | 4.37e-02 | 3.47e-02 | 38 |
| hsa0411023 | Esophagus | ESCC | Cell cycle | 126/4205 | 157/8465 | 1.34e-15 | 5.60e-14 | 2.87e-14 | 126 |
| hsa0411033 | Esophagus | ESCC | Cell cycle | 126/4205 | 157/8465 | 1.34e-15 | 5.60e-14 | 2.87e-14 | 126 |
| hsa041102 | Liver | HCC | Cell cycle | 106/4020 | 157/8465 | 2.54e-07 | 3.04e-06 | 1.69e-06 | 106 |
| hsa041103 | Liver | HCC | Cell cycle | 106/4020 | 157/8465 | 2.54e-07 | 3.04e-06 | 1.69e-06 | 106 |
| hsa041108 | Oral cavity | OSCC | Cell cycle | 118/3704 | 157/8465 | 7.15e-16 | 2.66e-14 | 1.35e-14 | 118 |
| hsa0411015 | Oral cavity | OSCC | Cell cycle | 118/3704 | 157/8465 | 7.15e-16 | 2.66e-14 | 1.35e-14 | 118 |
| Page: 1 |
Top |
Cell-cell communication analysis |
| Identification of potential cell-cell interactions between two cell types and their ligand-receptor pairs for different disease states |
| Ligand | Receptor | LRpair | Pathway | Tissue | Disease Stage |
| Page: 1 |
Top |
Single-cell gene regulatory network inference analysis |
| Find out the significant the regulons (TFs) and the target genes of each regulon across cell types for different disease states |
| TF | Cell Type | Tissue | Disease Stage | Target Gene | RSS | Regulon Activity |
| ∗The dot plots of a searched regulon are shown for all cell subpopulations in each disease state of each tissue based on the regulon specific score inferred using pySCENIC and by calculating the average expression. |
| Page: 1 |
Top |
Somatic mutation of malignant transformation related genes |
| Annotation of somatic variants for genes involved in malignant transformation |
| Hugo Symbol | Variant Class | Variant Classification | dbSNP RS | HGVSc | HGVSp | HGVSp Short | SWISSPROT | BIOTYPE | SIFT | PolyPhen | Tumor Sample Barcode | Tissue | Histology | Sex | Age | Stage | Therapy Types | Drugs | Outcome |
| DDX11 | SNV | Missense_Mutation | novel | c.1420N>C | p.Glu474Gln | p.E474Q | Q96FC9 | protein_coding | tolerated(0.18) | possibly_damaging(0.893) | TCGA-A2-A4RW-01 | Breast | breast invasive carcinoma | Female | <65 | III/IV | Unknown | Unknown | SD |
| DDX11 | SNV | Missense_Mutation | c.2121N>A | p.Phe707Leu | p.F707L | Q96FC9 | protein_coding | tolerated(0.11) | benign(0.093) | TCGA-AC-A23H-01 | Breast | breast invasive carcinoma | Female | >=65 | I/II | Unknown | Unknown | PD | |
| DDX11 | SNV | Missense_Mutation | novel | c.367N>C | p.Glu123Gln | p.E123Q | Q96FC9 | protein_coding | tolerated(0.1) | probably_damaging(0.997) | TCGA-AC-A3W6-01 | Breast | breast invasive carcinoma | Female | >=65 | III/IV | Unknown | Unknown | SD |
| DDX11 | SNV | Missense_Mutation | c.2834G>A | p.Arg945Lys | p.R945K | Q96FC9 | protein_coding | tolerated_low_confidence(1) | benign(0) | TCGA-BH-A0AZ-01 | Breast | breast invasive carcinoma | Female | <65 | III/IV | Chemotherapy | doxorubicin | CR | |
| DDX11 | SNV | Missense_Mutation | c.1490N>A | p.Arg497Gln | p.R497Q | Q96FC9 | protein_coding | tolerated(0.14) | benign(0.036) | TCGA-BH-A0HP-01 | Breast | breast invasive carcinoma | Female | >=65 | III/IV | Chemotherapy | doxorubicin | SD | |
| DDX11 | SNV | Missense_Mutation | novel | c.488A>G | p.Glu163Gly | p.E163G | Q96FC9 | protein_coding | tolerated(0.07) | possibly_damaging(0.895) | TCGA-C8-A12X-01 | Breast | breast invasive carcinoma | Female | <65 | I/II | Unknown | Unknown | SD |
| DDX11 | SNV | Missense_Mutation | novel | c.1712N>A | p.Ala571Glu | p.A571E | Q96FC9 | protein_coding | tolerated(1) | benign(0.006) | TCGA-LL-A5YO-01 | Breast | breast invasive carcinoma | Female | <65 | I/II | Chemotherapy | taxotere | CR |
| DDX11 | insertion | In_Frame_Ins | novel | c.57_58insCTG | p.Pro19_Tyr20insLeu | p.P19_Y20insL | Q96FC9 | protein_coding | TCGA-A2-A0CP-01 | Breast | breast invasive carcinoma | Female | <65 | I/II | Chemotherapy | cytoxan | SD | ||
| DDX11 | insertion | Frame_Shift_Ins | novel | c.59_60insTCCTTATAGTG | p.Ser21ProfsTer36 | p.S21Pfs*36 | Q96FC9 | protein_coding | TCGA-A2-A0CP-01 | Breast | breast invasive carcinoma | Female | <65 | I/II | Chemotherapy | cytoxan | SD | ||
| DDX11 | insertion | Nonsense_Mutation | novel | c.2085_2086insGAATGAATCCATACTGGTATTTCTTTCTTTCTTT | p.Cys696GlufsTer2 | p.C696Efs*2 | Q96FC9 | protein_coding | TCGA-A8-A09M-01 | Breast | breast invasive carcinoma | Female | >=65 | III/IV | Chemotherapy | paclitaxel | CR |
| Page: 1 2 3 4 5 6 7 8 9 |
Top |
Related drugs of malignant transformation related genes |
| Identification of chemicals and drugs interact with genes involved in malignant transfromation |
| (DGIdb 4.0) |
| Entrez ID | Symbol | Category | Interaction Types | Drug Claim Name | Drug Name | PMIDs |
| Page: 1 |

Copyright 2023-Present -The University of Texas Health Science Center at Houston |