
|
|||||
|
 | |
| |
| |
| |
| |
| |
|
Gene: DDX1 |
Gene summary for DDX1 |
| Gene information | Species | Human | Gene symbol | DDX1 | Gene ID | 1653 |
| Gene name | DEAD-box helicase 1 | |
| Gene Alias | DBP-RB | |
| Cytomap | 2p24.3 | |
| Gene Type | protein-coding | GO ID | GO:0000245 | UniProtAcc | A3RJH1 |
Top |
Malignant transformation analysis |
| Identification of the aberrant gene expression in precancerous and cancerous lesions by comparing the gene expression of stem-like cells in diseased tissues with normal stem cells |
| Entrez ID | Symbol | Replicates | Species | Organ | Tissue | Adj P-value | Log2FC | Malignancy |
| 1653 | DDX1 | LZE2T | Human | Esophagus | ESCC | 1.99e-02 | 4.31e-01 | 0.082 |
| 1653 | DDX1 | LZE4T | Human | Esophagus | ESCC | 1.19e-10 | 4.16e-01 | 0.0811 |
| 1653 | DDX1 | LZE7T | Human | Esophagus | ESCC | 3.17e-05 | 3.15e-01 | 0.0667 |
| 1653 | DDX1 | LZE8T | Human | Esophagus | ESCC | 8.09e-03 | 7.79e-02 | 0.067 |
| 1653 | DDX1 | LZE20T | Human | Esophagus | ESCC | 1.02e-04 | 4.22e-02 | 0.0662 |
| 1653 | DDX1 | LZE22T | Human | Esophagus | ESCC | 7.06e-03 | 3.14e-01 | 0.068 |
| 1653 | DDX1 | LZE24T | Human | Esophagus | ESCC | 1.96e-08 | 2.56e-01 | 0.0596 |
| 1653 | DDX1 | P1T-E | Human | Esophagus | ESCC | 7.30e-06 | 3.18e-01 | 0.0875 |
| 1653 | DDX1 | P2T-E | Human | Esophagus | ESCC | 3.19e-30 | 6.22e-01 | 0.1177 |
| 1653 | DDX1 | P4T-E | Human | Esophagus | ESCC | 1.57e-22 | 6.00e-01 | 0.1323 |
| 1653 | DDX1 | P5T-E | Human | Esophagus | ESCC | 5.32e-13 | 2.61e-01 | 0.1327 |
| 1653 | DDX1 | P8T-E | Human | Esophagus | ESCC | 2.45e-21 | 3.62e-01 | 0.0889 |
| 1653 | DDX1 | P9T-E | Human | Esophagus | ESCC | 3.80e-15 | 3.76e-01 | 0.1131 |
| 1653 | DDX1 | P10T-E | Human | Esophagus | ESCC | 2.64e-36 | 5.99e-01 | 0.116 |
| 1653 | DDX1 | P11T-E | Human | Esophagus | ESCC | 1.50e-13 | 5.19e-01 | 0.1426 |
| 1653 | DDX1 | P12T-E | Human | Esophagus | ESCC | 1.70e-33 | 6.09e-01 | 0.1122 |
| 1653 | DDX1 | P15T-E | Human | Esophagus | ESCC | 1.73e-13 | 1.94e-01 | 0.1149 |
| 1653 | DDX1 | P16T-E | Human | Esophagus | ESCC | 1.53e-13 | 2.62e-01 | 0.1153 |
| 1653 | DDX1 | P17T-E | Human | Esophagus | ESCC | 3.51e-06 | 2.66e-01 | 0.1278 |
| 1653 | DDX1 | P19T-E | Human | Esophagus | ESCC | 7.37e-04 | 4.47e-01 | 0.1662 |
| Page: 1 2 3 4 5 6 7 |
| Tissue | Expression Dynamics | Abbreviation |
| Esophagus | 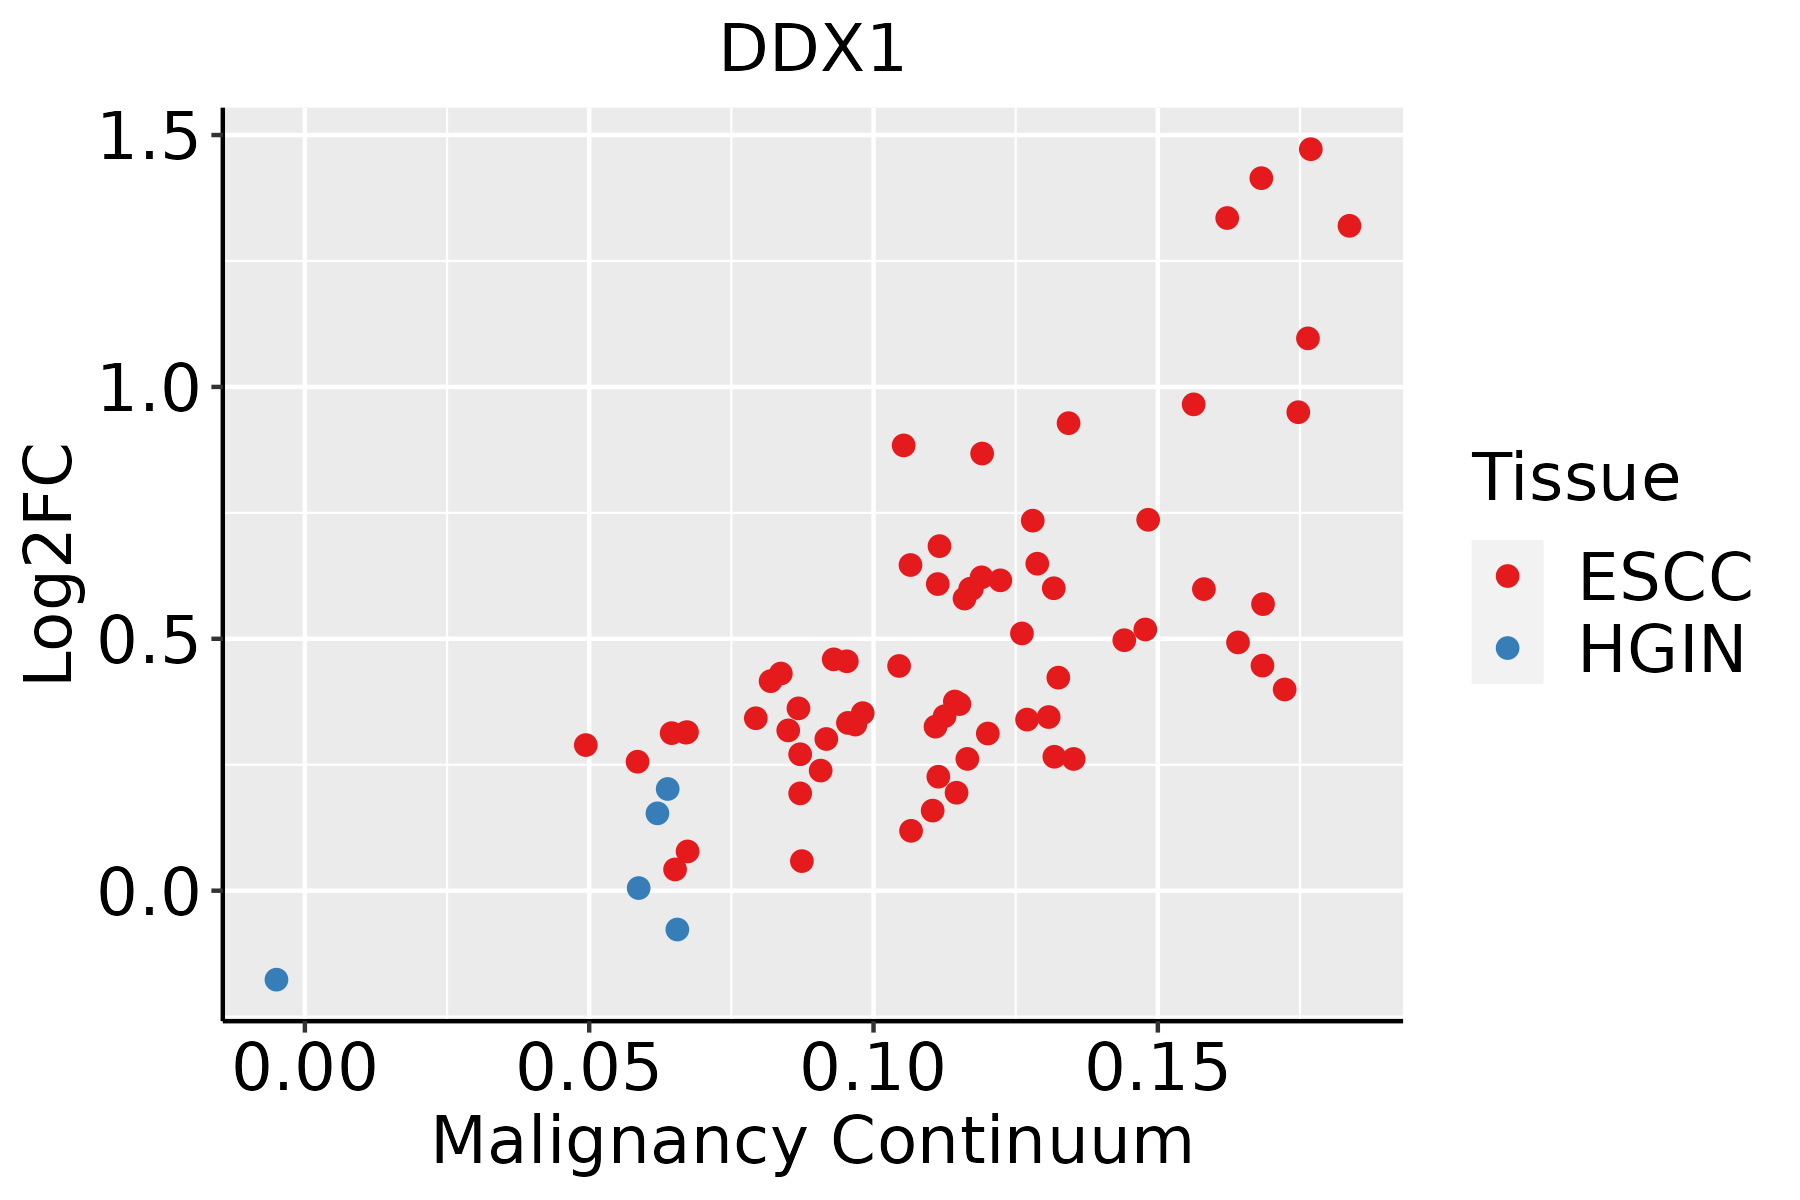 | ESCC: Esophageal squamous cell carcinoma |
| HGIN: High-grade intraepithelial neoplasias | ||
| LGIN: Low-grade intraepithelial neoplasias | ||
| Liver | 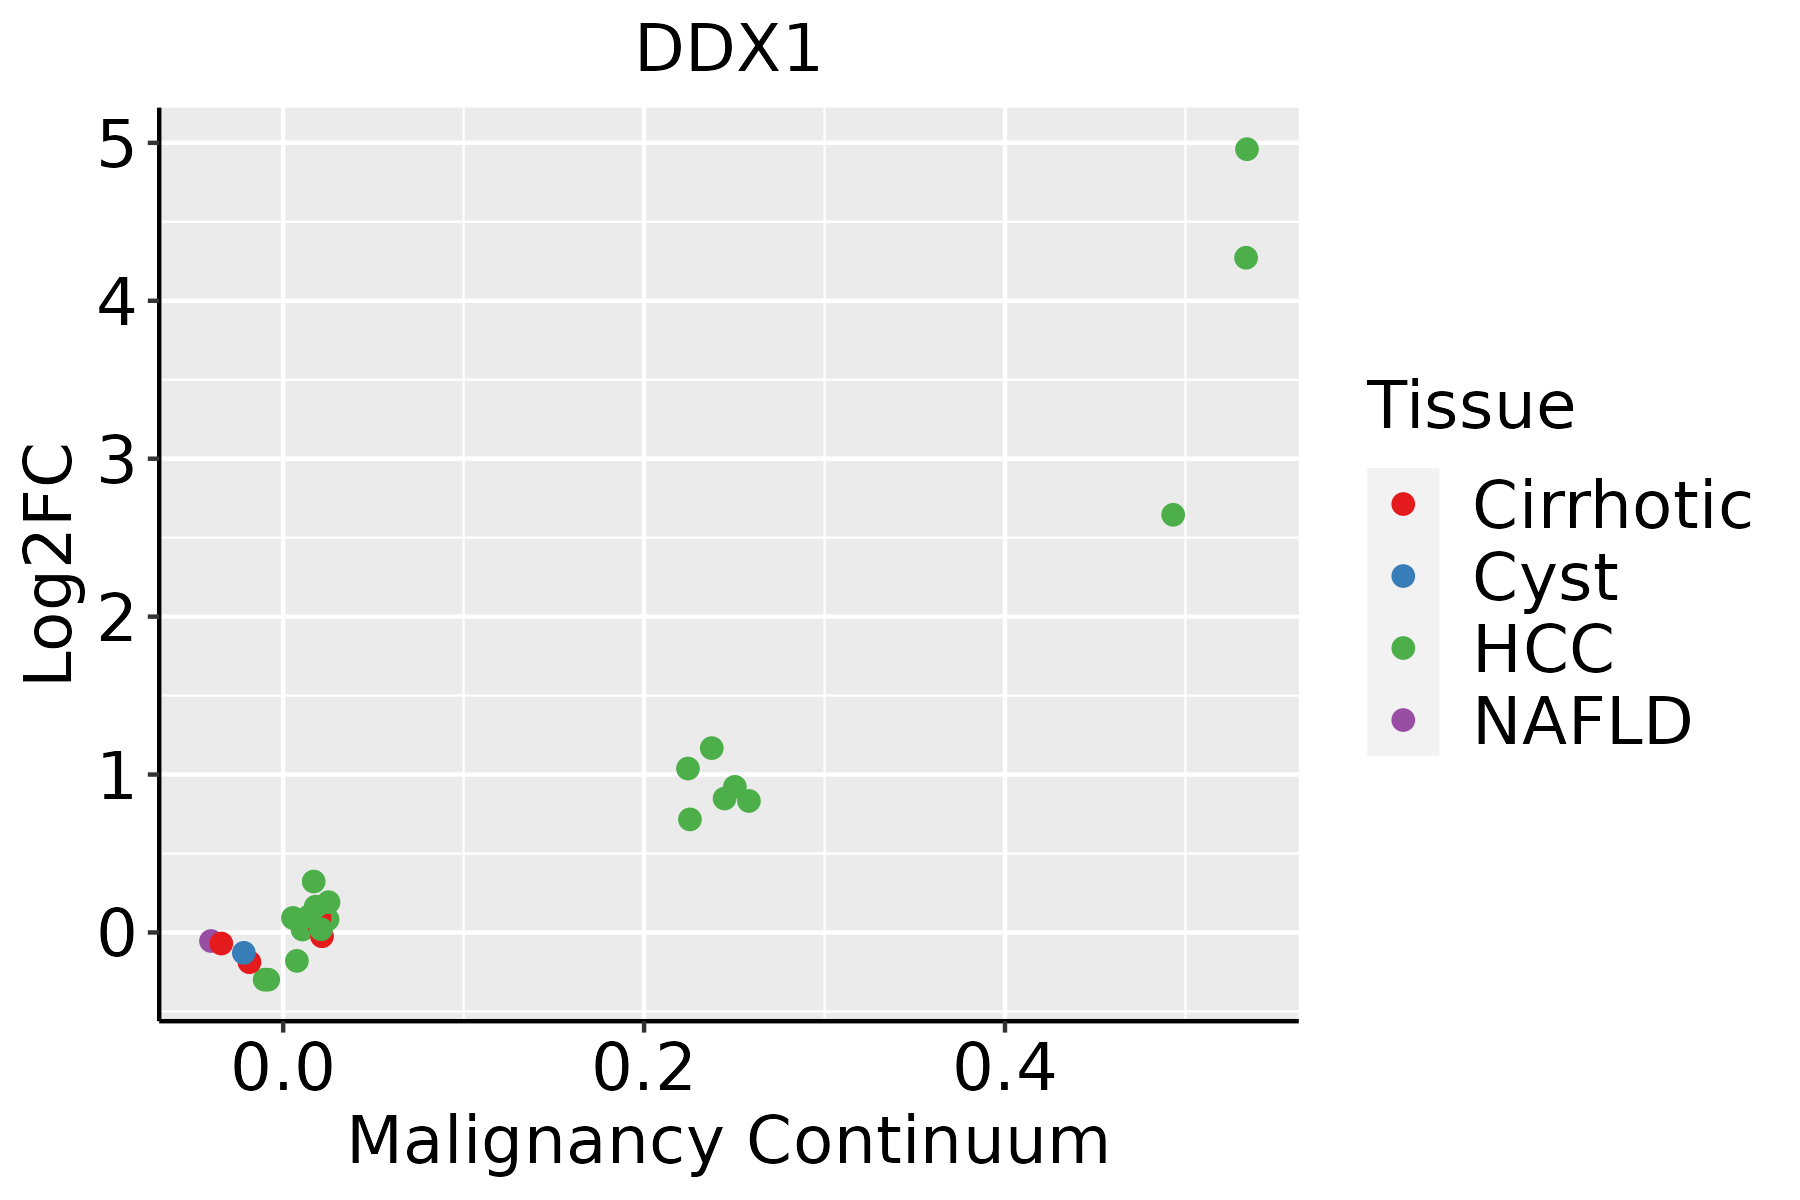 | HCC: Hepatocellular carcinoma |
| NAFLD: Non-alcoholic fatty liver disease | ||
| Oral Cavity |  | EOLP: Erosive Oral lichen planus |
| LP: leukoplakia | ||
| NEOLP: Non-erosive oral lichen planus | ||
| OSCC: Oral squamous cell carcinoma | ||
| Prostate | 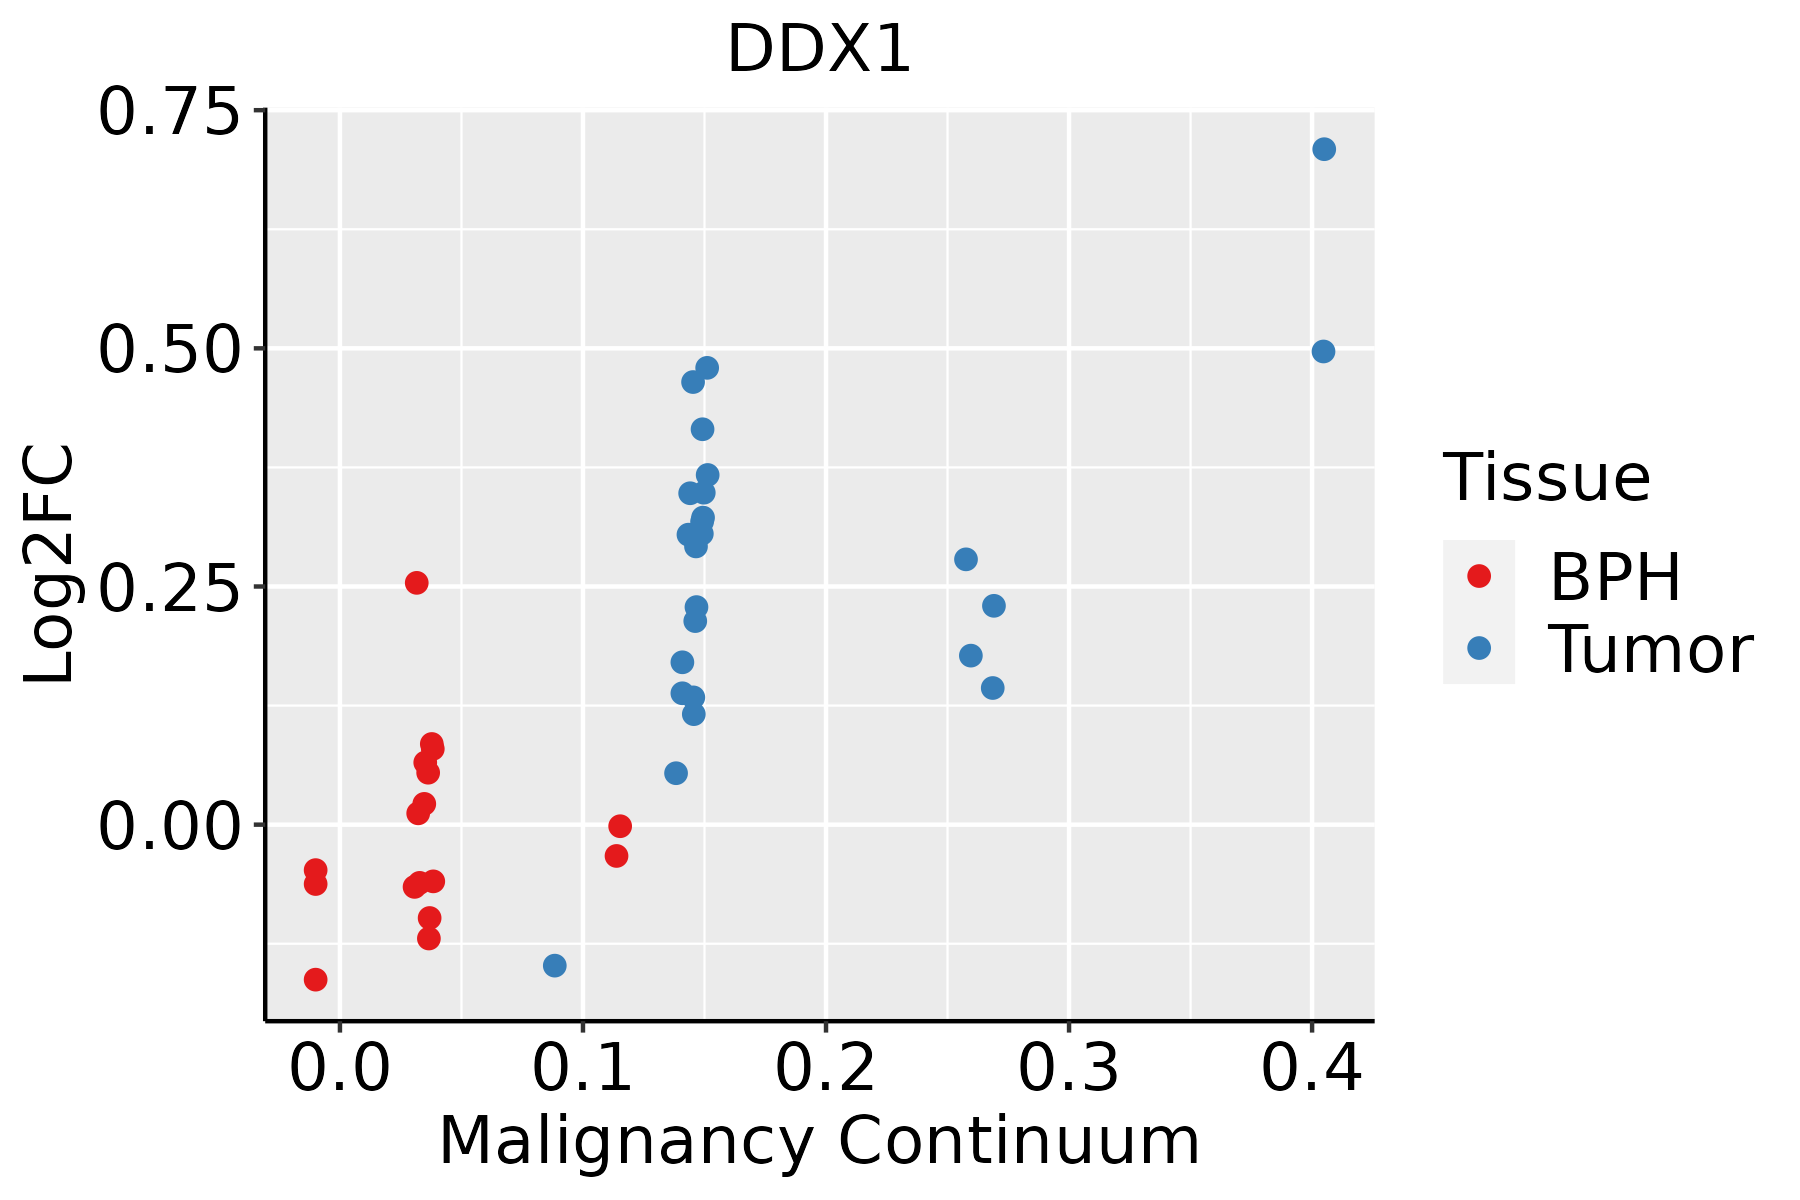 | BPH: Benign Prostatic Hyperplasia |
| Skin | 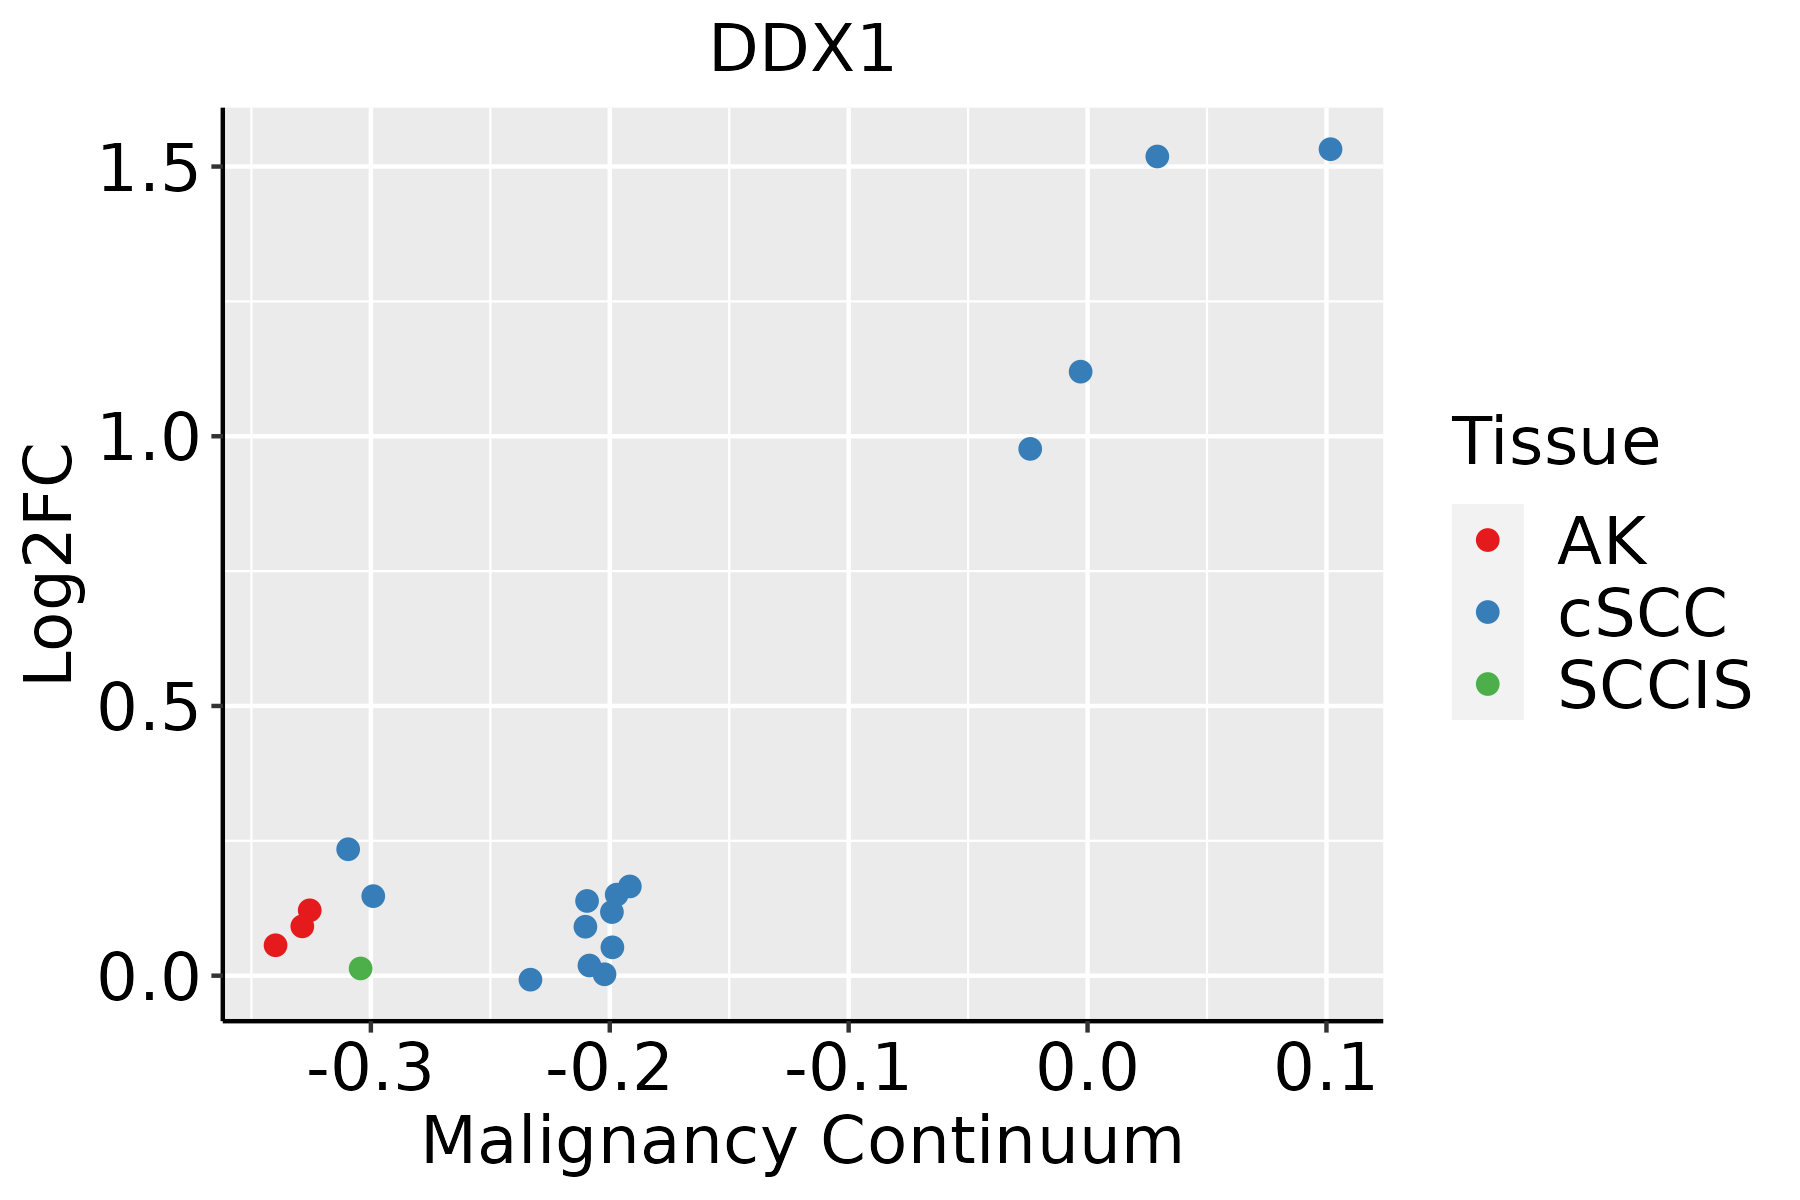 | AK: Actinic keratosis |
| cSCC: Cutaneous squamous cell carcinoma | ||
| SCCIS:squamous cell carcinoma in situ | ||
| Thyroid |  | ATC: Anaplastic thyroid cancer |
| HT: Hashimoto's thyroiditis | ||
| PTC: Papillary thyroid cancer |
| ∗log2FC in expression of this searched gene in stem-like cells from each diseased tissue sample relative to stem-like cells in normal samples in each tissue plotted against the malignancy continuum. Samples are colored based on if they are from different disease stage. |
Top |
Malignant transformation related pathway analysis |
| Find out the enriched GO biological processes and KEGG pathways involved in transition from healthy to precancer to cancer |
| Tissue | Disease Stage | Enriched GO biological Processes |
| Colorectum | AD |  |
| Colorectum | SER |  |
| Colorectum | MSS |  |
| Colorectum | MSI-H |  |
| Colorectum | FAP |  |
| ∗Top 15 enriched GO BP terms are showed in the bar plot of each disease state in each tissue. Each row represents a significant GO biological process which is colored according to the -log10(p.adjust). |
| Page: 1 2 3 4 5 6 7 8 9 |
| GO ID | Tissue | Disease Stage | Description | Gene Ratio | Bg Ratio | pvalue | p.adjust | Count |
| GO:00226139 | Breast | Precancer | ribonucleoprotein complex biogenesis | 79/1080 | 463/18723 | 2.11e-18 | 1.03e-15 | 79 |
| GO:00422549 | Breast | Precancer | ribosome biogenesis | 52/1080 | 299/18723 | 7.35e-13 | 1.51e-10 | 52 |
| GO:00083809 | Breast | Precancer | RNA splicing | 65/1080 | 434/18723 | 1.27e-12 | 2.53e-10 | 65 |
| GO:00434849 | Breast | Precancer | regulation of RNA splicing | 34/1080 | 148/18723 | 2.66e-12 | 4.75e-10 | 34 |
| GO:00003759 | Breast | Precancer | RNA splicing, via transesterification reactions | 52/1080 | 324/18723 | 1.74e-11 | 2.22e-09 | 52 |
| GO:00485459 | Breast | Precancer | response to steroid hormone | 53/1080 | 339/18723 | 3.07e-11 | 3.66e-09 | 53 |
| GO:00003779 | Breast | Precancer | RNA splicing, via transesterification reactions with bulged adenosine as nucleophile | 51/1080 | 320/18723 | 3.55e-11 | 4.04e-09 | 51 |
| GO:00003989 | Breast | Precancer | mRNA splicing, via spliceosome | 51/1080 | 320/18723 | 3.55e-11 | 4.04e-09 | 51 |
| GO:00480249 | Breast | Precancer | regulation of mRNA splicing, via spliceosome | 22/1080 | 101/18723 | 5.29e-08 | 3.18e-06 | 22 |
| GO:00063646 | Breast | Precancer | rRNA processing | 35/1080 | 225/18723 | 7.90e-08 | 4.60e-06 | 35 |
| GO:00160726 | Breast | Precancer | rRNA metabolic process | 36/1080 | 236/18723 | 8.59e-08 | 4.84e-06 | 36 |
| GO:19033118 | Breast | Precancer | regulation of mRNA metabolic process | 38/1080 | 288/18723 | 1.63e-06 | 5.97e-05 | 38 |
| GO:00506848 | Breast | Precancer | regulation of mRNA processing | 23/1080 | 137/18723 | 3.49e-06 | 1.13e-04 | 23 |
| GO:00713838 | Breast | Precancer | cellular response to steroid hormone stimulus | 28/1080 | 204/18723 | 1.78e-05 | 4.26e-04 | 28 |
| GO:00003808 | Breast | Precancer | alternative mRNA splicing, via spliceosome | 15/1080 | 77/18723 | 2.86e-05 | 6.37e-04 | 15 |
| GO:00003818 | Breast | Precancer | regulation of alternative mRNA splicing, via spliceosome | 13/1080 | 60/18723 | 2.98e-05 | 6.58e-04 | 13 |
| GO:00344705 | Breast | Precancer | ncRNA processing | 42/1080 | 395/18723 | 9.91e-05 | 1.83e-03 | 42 |
| GO:00305217 | Breast | Precancer | androgen receptor signaling pathway | 10/1080 | 44/18723 | 1.61e-04 | 2.69e-03 | 10 |
| GO:00305187 | Breast | Precancer | intracellular steroid hormone receptor signaling pathway | 16/1080 | 116/18723 | 1.01e-03 | 1.13e-02 | 16 |
| GO:00346604 | Breast | Precancer | ncRNA metabolic process | 45/1080 | 485/18723 | 1.15e-03 | 1.26e-02 | 45 |
| Page: 1 2 3 4 5 6 7 8 9 10 11 12 13 14 15 16 17 18 19 20 21 22 23 24 25 26 27 28 29 30 31 32 33 34 35 36 37 38 39 40 41 42 43 44 45 46 47 48 49 50 51 52 53 54 55 56 57 58 59 60 61 62 63 64 |
| Pathway ID | Tissue | Disease Stage | Description | Gene Ratio | Bg Ratio | pvalue | p.adjust | qvalue | Count |
| Page: 1 |
Top |
Cell-cell communication analysis |
| Identification of potential cell-cell interactions between two cell types and their ligand-receptor pairs for different disease states |
| Ligand | Receptor | LRpair | Pathway | Tissue | Disease Stage |
| Page: 1 |
Top |
Single-cell gene regulatory network inference analysis |
| Find out the significant the regulons (TFs) and the target genes of each regulon across cell types for different disease states |
| TF | Cell Type | Tissue | Disease Stage | Target Gene | RSS | Regulon Activity |
| ∗The dot plots of a searched regulon are shown for all cell subpopulations in each disease state of each tissue based on the regulon specific score inferred using pySCENIC and by calculating the average expression. |
| Page: 1 |
Top |
Somatic mutation of malignant transformation related genes |
| Annotation of somatic variants for genes involved in malignant transformation |
| Hugo Symbol | Variant Class | Variant Classification | dbSNP RS | HGVSc | HGVSp | HGVSp Short | SWISSPROT | BIOTYPE | SIFT | PolyPhen | Tumor Sample Barcode | Tissue | Histology | Sex | Age | Stage | Therapy Types | Drugs | Outcome |
| DDX1 | SNV | Missense_Mutation | c.2095N>A | p.Gly699Arg | p.G699R | Q92499 | protein_coding | tolerated(0.22) | benign(0.303) | TCGA-BH-A2L8-01 | Breast | breast invasive carcinoma | Female | <65 | I/II | Chemotherapy | cytoxan | CR | |
| DDX1 | SNV | Missense_Mutation | novel | c.1433G>C | p.Gly478Ala | p.G478A | Q92499 | protein_coding | tolerated(0.09) | benign(0.255) | TCGA-E2-A574-01 | Breast | breast invasive carcinoma | Female | <65 | I/II | Chemotherapy | adriamycin | SD |
| DDX1 | SNV | Missense_Mutation | novel | c.449C>T | p.Ser150Phe | p.S150F | Q92499 | protein_coding | deleterious(0) | probably_damaging(0.974) | TCGA-EW-A423-01 | Breast | breast invasive carcinoma | Female | >=65 | I/II | Hormone Therapy | anastrozole | SD |
| DDX1 | SNV | Missense_Mutation | novel | c.351G>T | p.Lys117Asn | p.K117N | Q92499 | protein_coding | tolerated(0.06) | possibly_damaging(0.787) | TCGA-2W-A8YY-01 | Cervix | cervical & endocervical cancer | Female | <65 | I/II | Chemotherapy | cisplatin | CR |
| DDX1 | SNV | Missense_Mutation | c.1925N>A | p.Arg642Lys | p.R642K | Q92499 | protein_coding | tolerated(0.82) | benign(0.003) | TCGA-IR-A3LK-01 | Cervix | cervical & endocervical cancer | Female | >=65 | I/II | Chemotherapy | cisplatin | PD | |
| DDX1 | SNV | Missense_Mutation | c.238N>G | p.Thr80Ala | p.T80A | Q92499 | protein_coding | tolerated(0.59) | benign(0) | TCGA-AA-3811-01 | Colorectum | colon adenocarcinoma | Female | >=65 | III/IV | Unknown | Unknown | PD | |
| DDX1 | SNV | Missense_Mutation | c.387G>A | p.Met129Ile | p.M129I | Q92499 | protein_coding | tolerated(0.4) | benign(0.003) | TCGA-AA-A00N-01 | Colorectum | colon adenocarcinoma | Male | >=65 | I/II | Unknown | Unknown | PD | |
| DDX1 | SNV | Missense_Mutation | c.1757N>G | p.Tyr586Cys | p.Y586C | Q92499 | protein_coding | deleterious(0) | probably_damaging(0.962) | TCGA-AD-6889-01 | Colorectum | colon adenocarcinoma | Male | >=65 | I/II | Chemotherapy | xeloda | PD | |
| DDX1 | SNV | Missense_Mutation | novel | c.1274N>C | p.Phe425Ser | p.F425S | Q92499 | protein_coding | tolerated(0.05) | probably_damaging(0.999) | TCGA-AZ-4315-01 | Colorectum | colon adenocarcinoma | Male | <65 | I/II | Unknown | Unknown | SD |
| DDX1 | SNV | Missense_Mutation | c.1859N>T | p.Ala620Val | p.A620V | Q92499 | protein_coding | deleterious(0.01) | possibly_damaging(0.776) | TCGA-CK-5913-01 | Colorectum | colon adenocarcinoma | Female | <65 | I/II | Unknown | Unknown | SD |
| Page: 1 2 3 4 5 6 7 8 |
Top |
Related drugs of malignant transformation related genes |
| Identification of chemicals and drugs interact with genes involved in malignant transfromation |
| (DGIdb 4.0) |
| Entrez ID | Symbol | Category | Interaction Types | Drug Claim Name | Drug Name | PMIDs |
| Page: 1 |

Copyright 2023-Present -The University of Texas Health Science Center at Houston |