
|
|||||
|
 | |
| |
| |
| |
| |
| |
|
Gene: DDT |
Gene summary for DDT |
| Gene information | Species | Human | Gene symbol | DDT | Gene ID | 1652 |
| Gene name | D-dopachrome tautomerase | |
| Gene Alias | D-DT | |
| Cytomap | 22q11.23 | |
| Gene Type | protein-coding | GO ID | GO:0000165 | UniProtAcc | P30046 |
Top |
Malignant transformation analysis |
| Identification of the aberrant gene expression in precancerous and cancerous lesions by comparing the gene expression of stem-like cells in diseased tissues with normal stem cells |
| Entrez ID | Symbol | Replicates | Species | Organ | Tissue | Adj P-value | Log2FC | Malignancy |
| 1652 | DDT | GSM4909281 | Human | Breast | IDC | 5.53e-51 | 7.91e-01 | 0.21 |
| 1652 | DDT | GSM4909282 | Human | Breast | IDC | 1.34e-07 | 4.15e-01 | -0.0288 |
| 1652 | DDT | GSM4909285 | Human | Breast | IDC | 1.35e-14 | 4.97e-01 | 0.21 |
| 1652 | DDT | GSM4909286 | Human | Breast | IDC | 6.55e-04 | -1.59e-01 | 0.1081 |
| 1652 | DDT | GSM4909288 | Human | Breast | IDC | 1.46e-02 | 1.71e-01 | 0.0988 |
| 1652 | DDT | GSM4909291 | Human | Breast | IDC | 1.89e-04 | 3.43e-01 | 0.1753 |
| 1652 | DDT | GSM4909294 | Human | Breast | IDC | 1.55e-05 | 1.30e-01 | 0.2022 |
| 1652 | DDT | GSM4909296 | Human | Breast | IDC | 1.67e-23 | 3.16e-01 | 0.1524 |
| 1652 | DDT | GSM4909297 | Human | Breast | IDC | 2.97e-16 | -1.55e-01 | 0.1517 |
| 1652 | DDT | GSM4909298 | Human | Breast | IDC | 3.75e-04 | 2.97e-01 | 0.1551 |
| 1652 | DDT | GSM4909304 | Human | Breast | IDC | 1.52e-03 | 3.07e-01 | 0.1636 |
| 1652 | DDT | GSM4909311 | Human | Breast | IDC | 1.33e-39 | -2.35e-01 | 0.1534 |
| 1652 | DDT | GSM4909312 | Human | Breast | IDC | 4.68e-14 | -2.26e-01 | 0.1552 |
| 1652 | DDT | GSM4909315 | Human | Breast | IDC | 2.30e-09 | 4.08e-01 | 0.21 |
| 1652 | DDT | GSM4909316 | Human | Breast | IDC | 1.45e-13 | 4.46e-01 | 0.21 |
| 1652 | DDT | GSM4909317 | Human | Breast | IDC | 2.35e-11 | 4.34e-01 | 0.1355 |
| 1652 | DDT | GSM4909318 | Human | Breast | IDC | 2.68e-16 | 7.04e-01 | 0.2031 |
| 1652 | DDT | GSM4909319 | Human | Breast | IDC | 2.99e-42 | -3.69e-01 | 0.1563 |
| 1652 | DDT | GSM4909320 | Human | Breast | IDC | 1.32e-07 | 8.72e-03 | 0.1575 |
| 1652 | DDT | GSM4909321 | Human | Breast | IDC | 2.15e-15 | -2.35e-02 | 0.1559 |
| Page: 1 2 3 4 5 6 7 8 9 10 11 12 13 |
| Tissue | Expression Dynamics | Abbreviation |
| Breast | 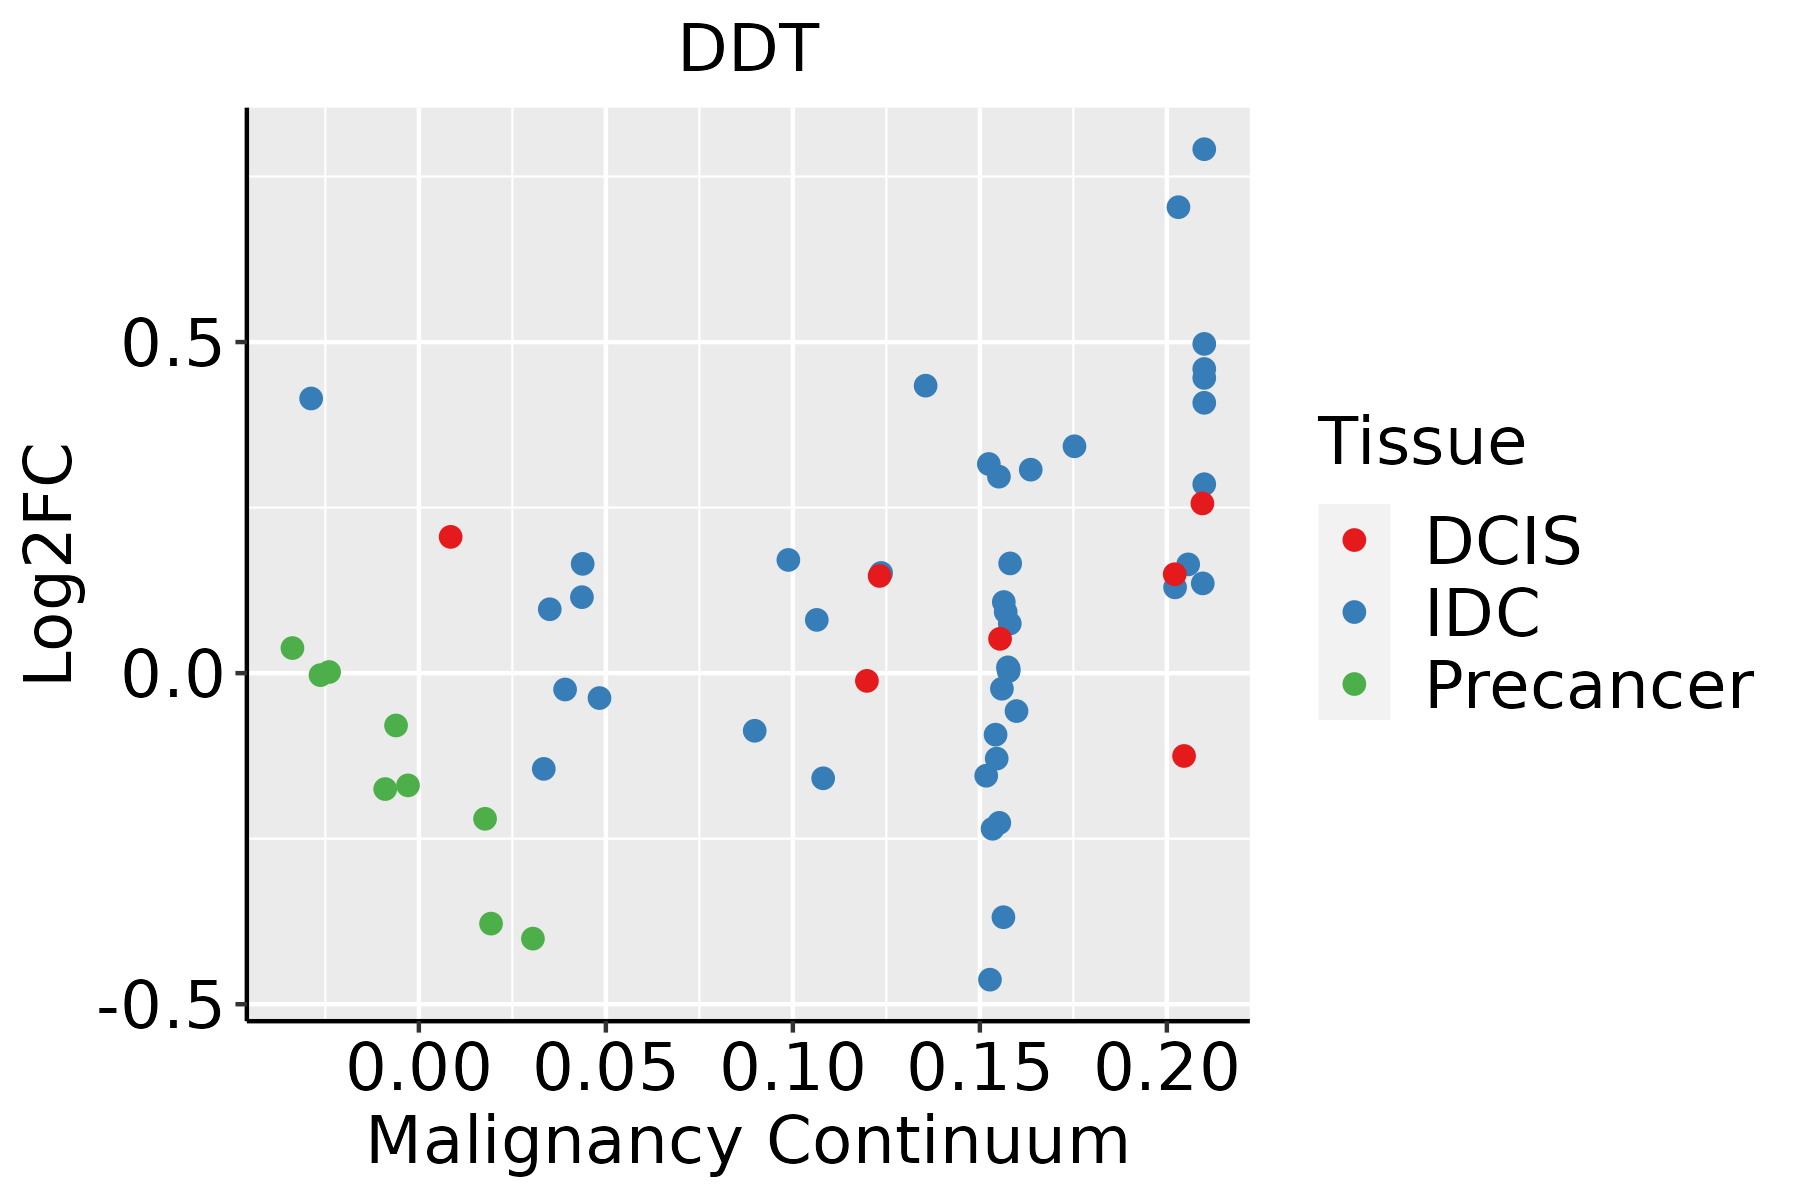 | IDC: Invasive ductal carcinoma |
| DCIS: Ductal carcinoma in situ | ||
| Precancer(BRCA1-mut): Precancerous lesion from BRCA1 mutation carriers | ||
| Cervix | 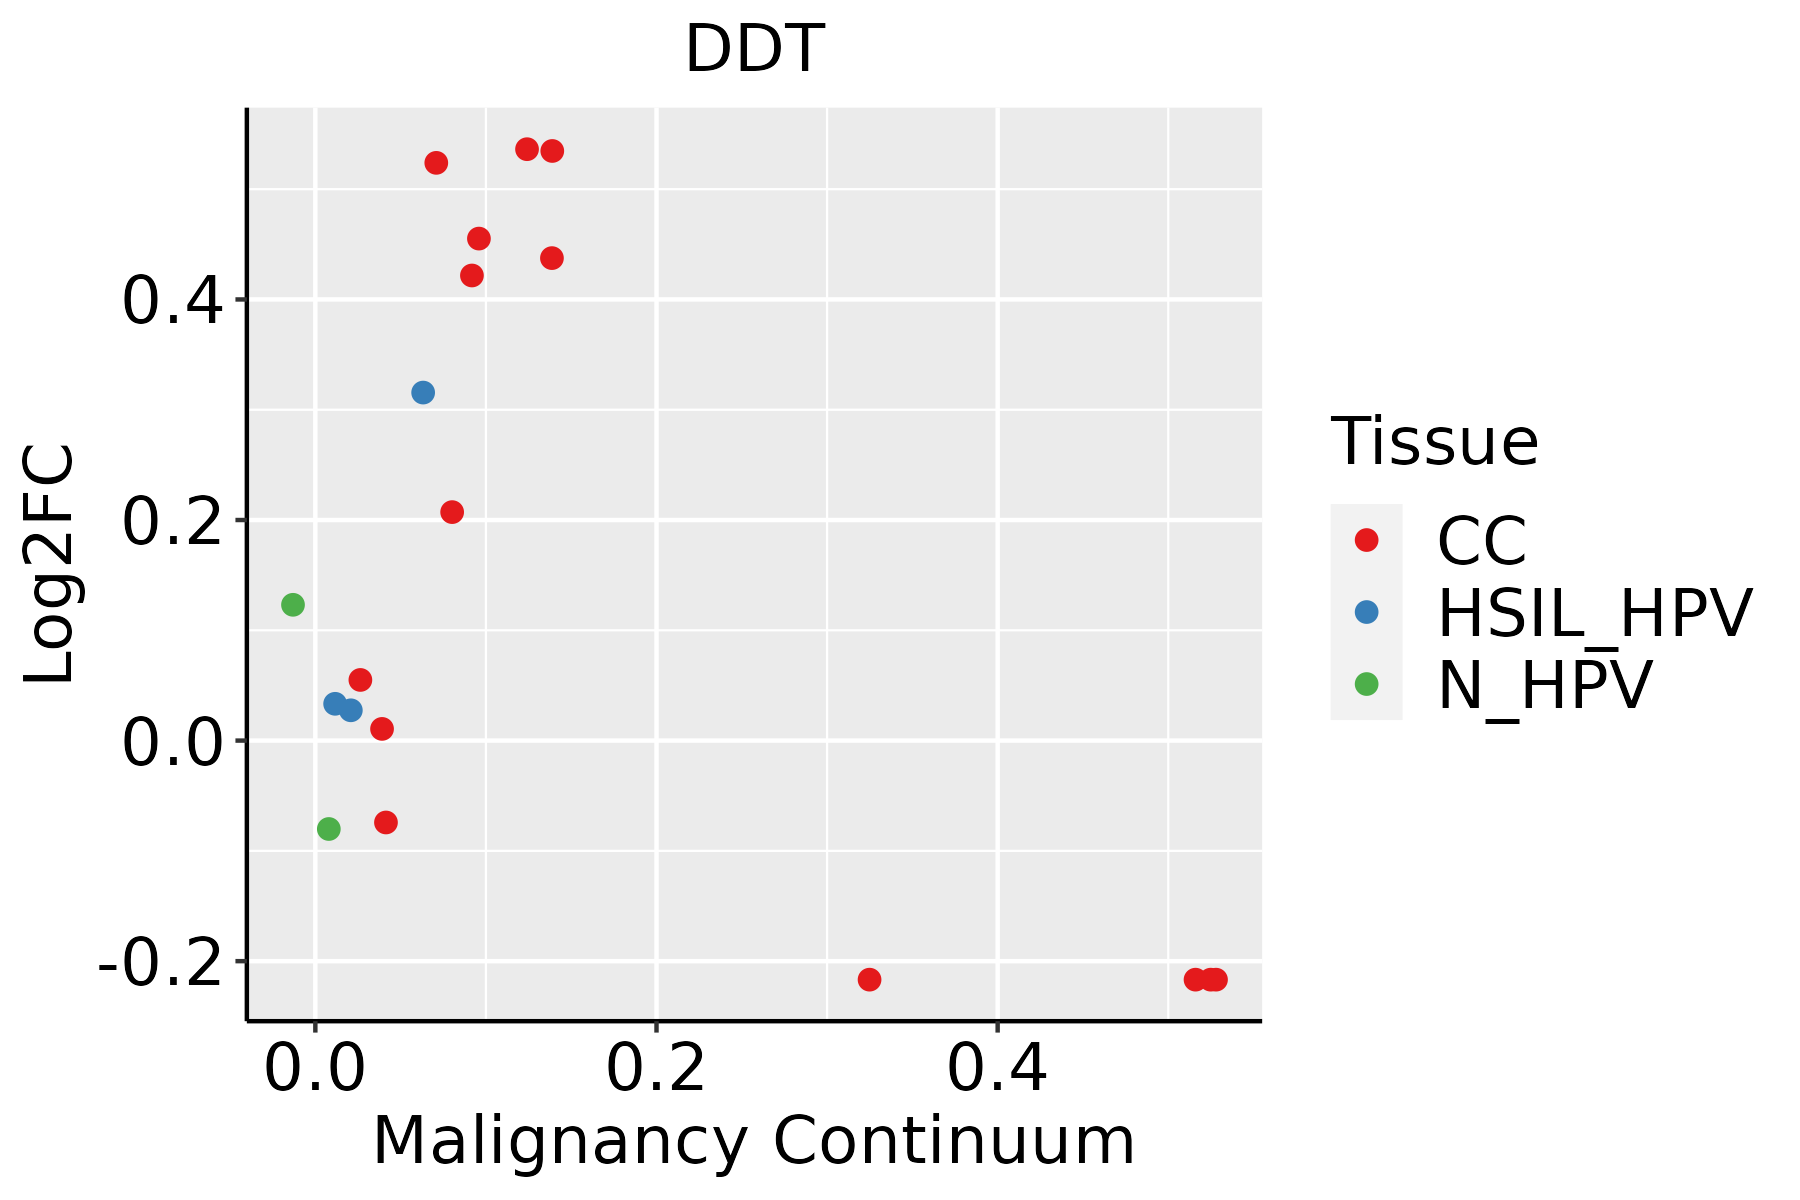 | CC: Cervix cancer |
| HSIL_HPV: HPV-infected high-grade squamous intraepithelial lesions | ||
| N_HPV: HPV-infected normal cervix | ||
| Endometrium | 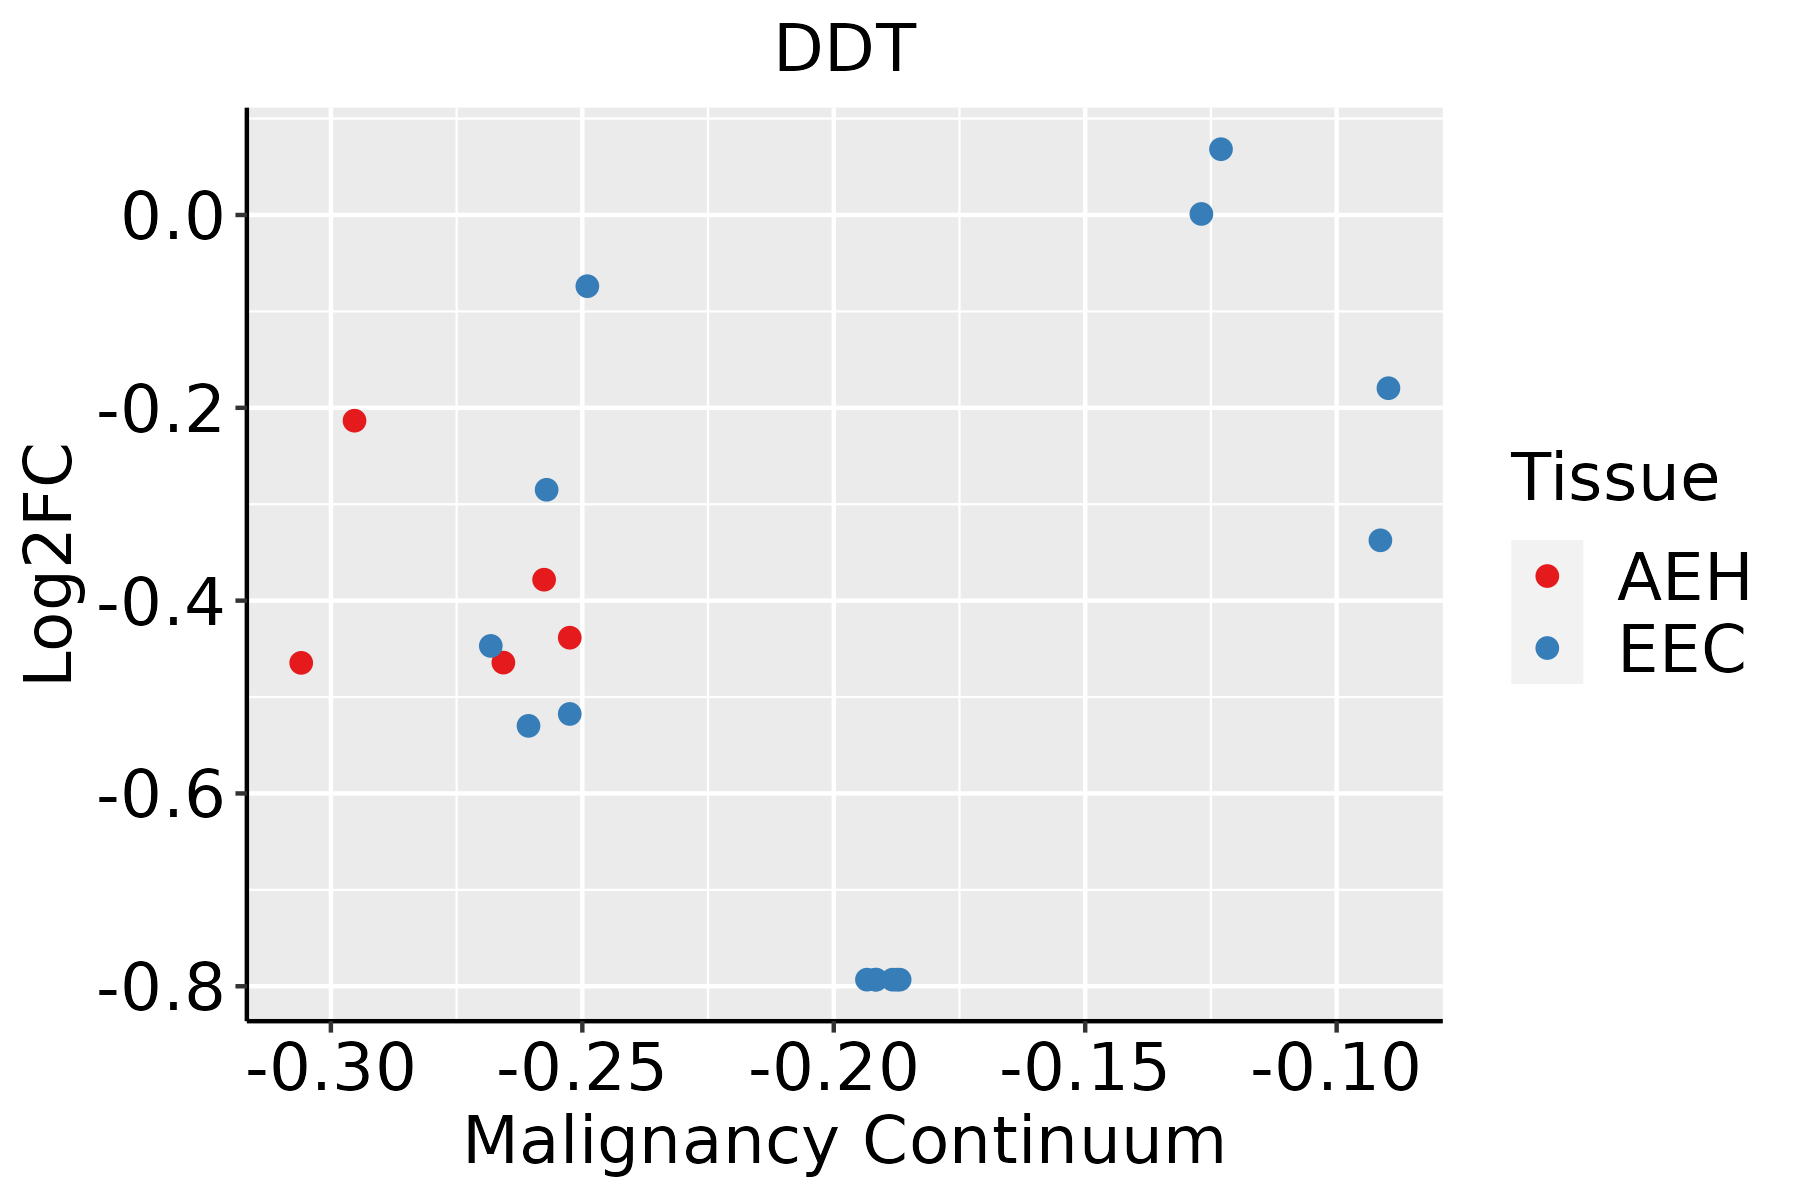 | AEH: Atypical endometrial hyperplasia |
| EEC: Endometrioid Cancer | ||
| Esophagus |  | ESCC: Esophageal squamous cell carcinoma |
| HGIN: High-grade intraepithelial neoplasias | ||
| LGIN: Low-grade intraepithelial neoplasias | ||
| GC |  | CAG: Chronic atrophic gastritis |
| CAG with IM: Chronic atrophic gastritis with intestinal metaplasia | ||
| CSG: Chronic superficial gastritis | ||
| GC: Gastric cancer | ||
| SIM: Severe intestinal metaplasia | ||
| WIM: Wild intestinal metaplasia | ||
| Liver | 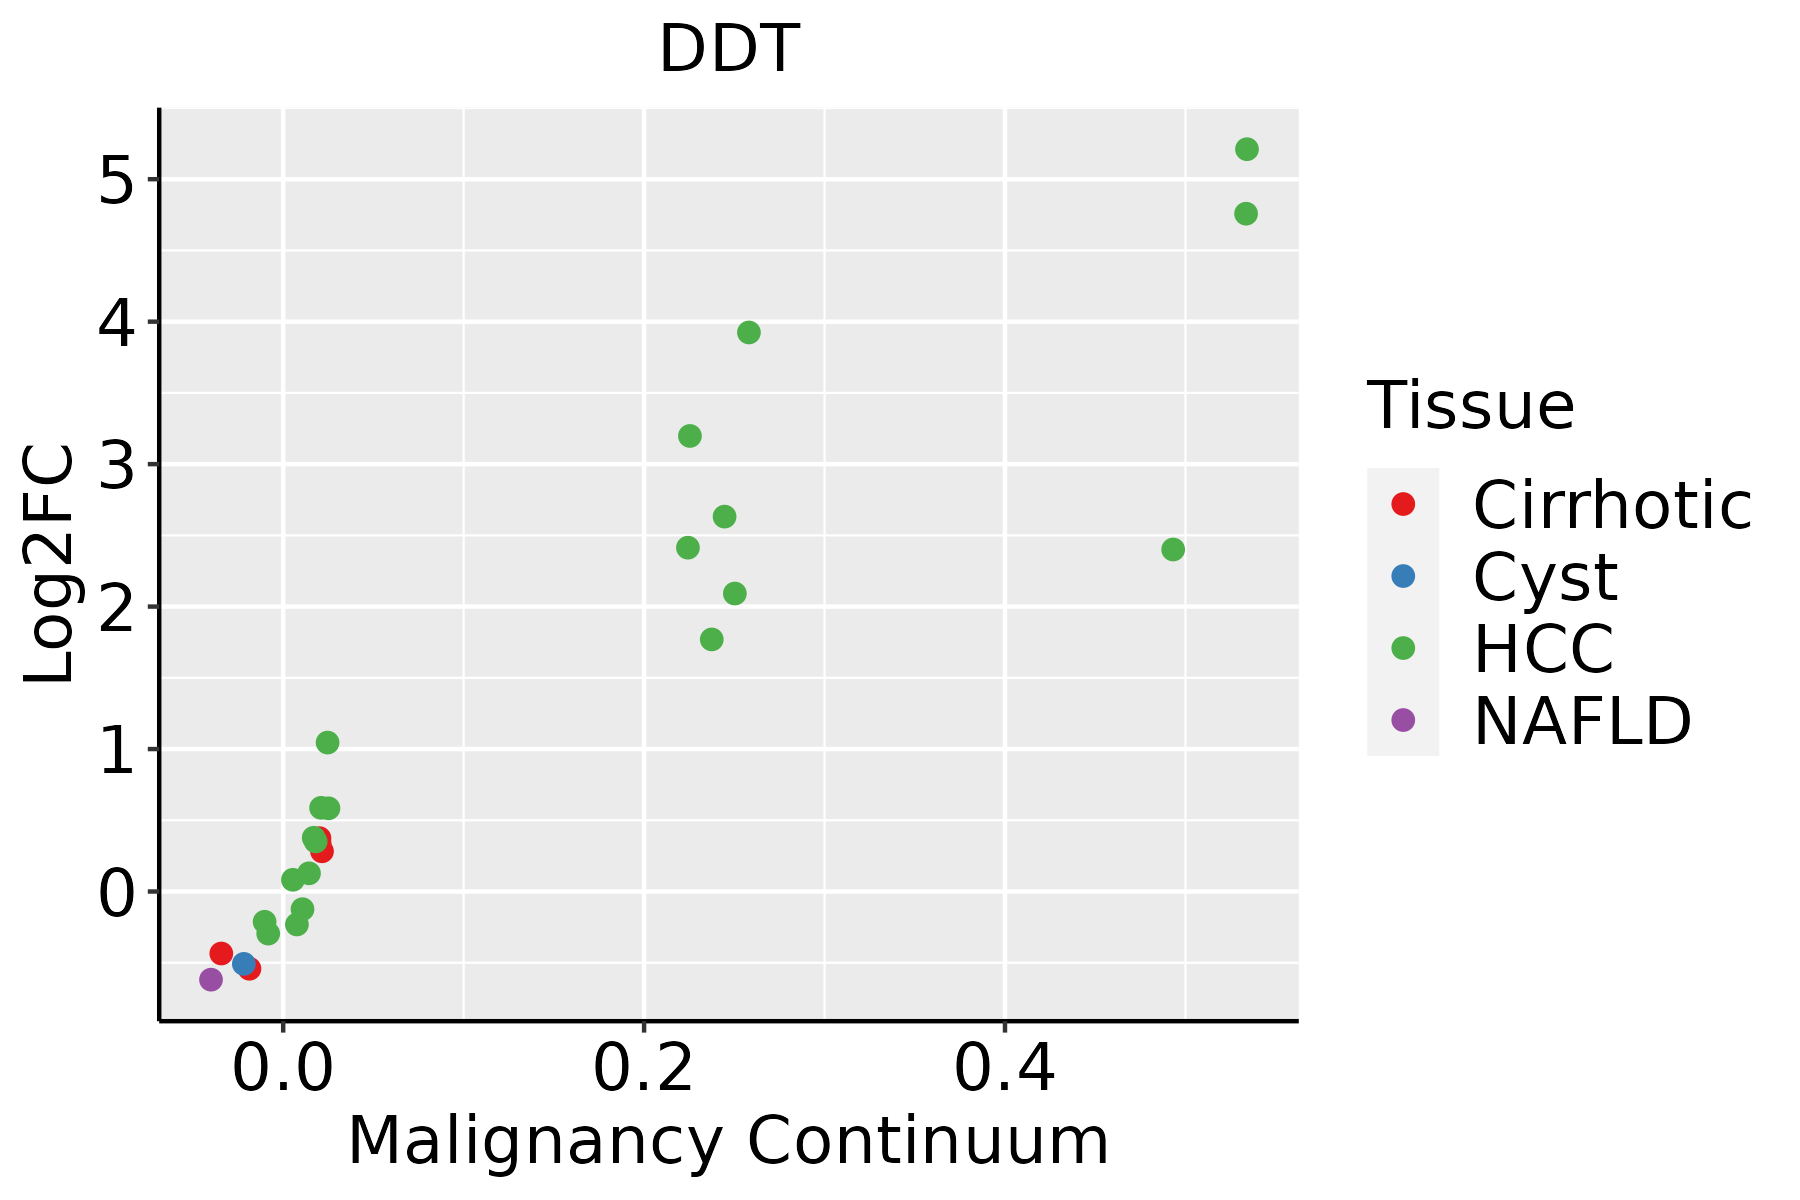 | HCC: Hepatocellular carcinoma |
| NAFLD: Non-alcoholic fatty liver disease | ||
| Oral Cavity |  | EOLP: Erosive Oral lichen planus |
| LP: leukoplakia | ||
| NEOLP: Non-erosive oral lichen planus | ||
| OSCC: Oral squamous cell carcinoma | ||
| Prostate | 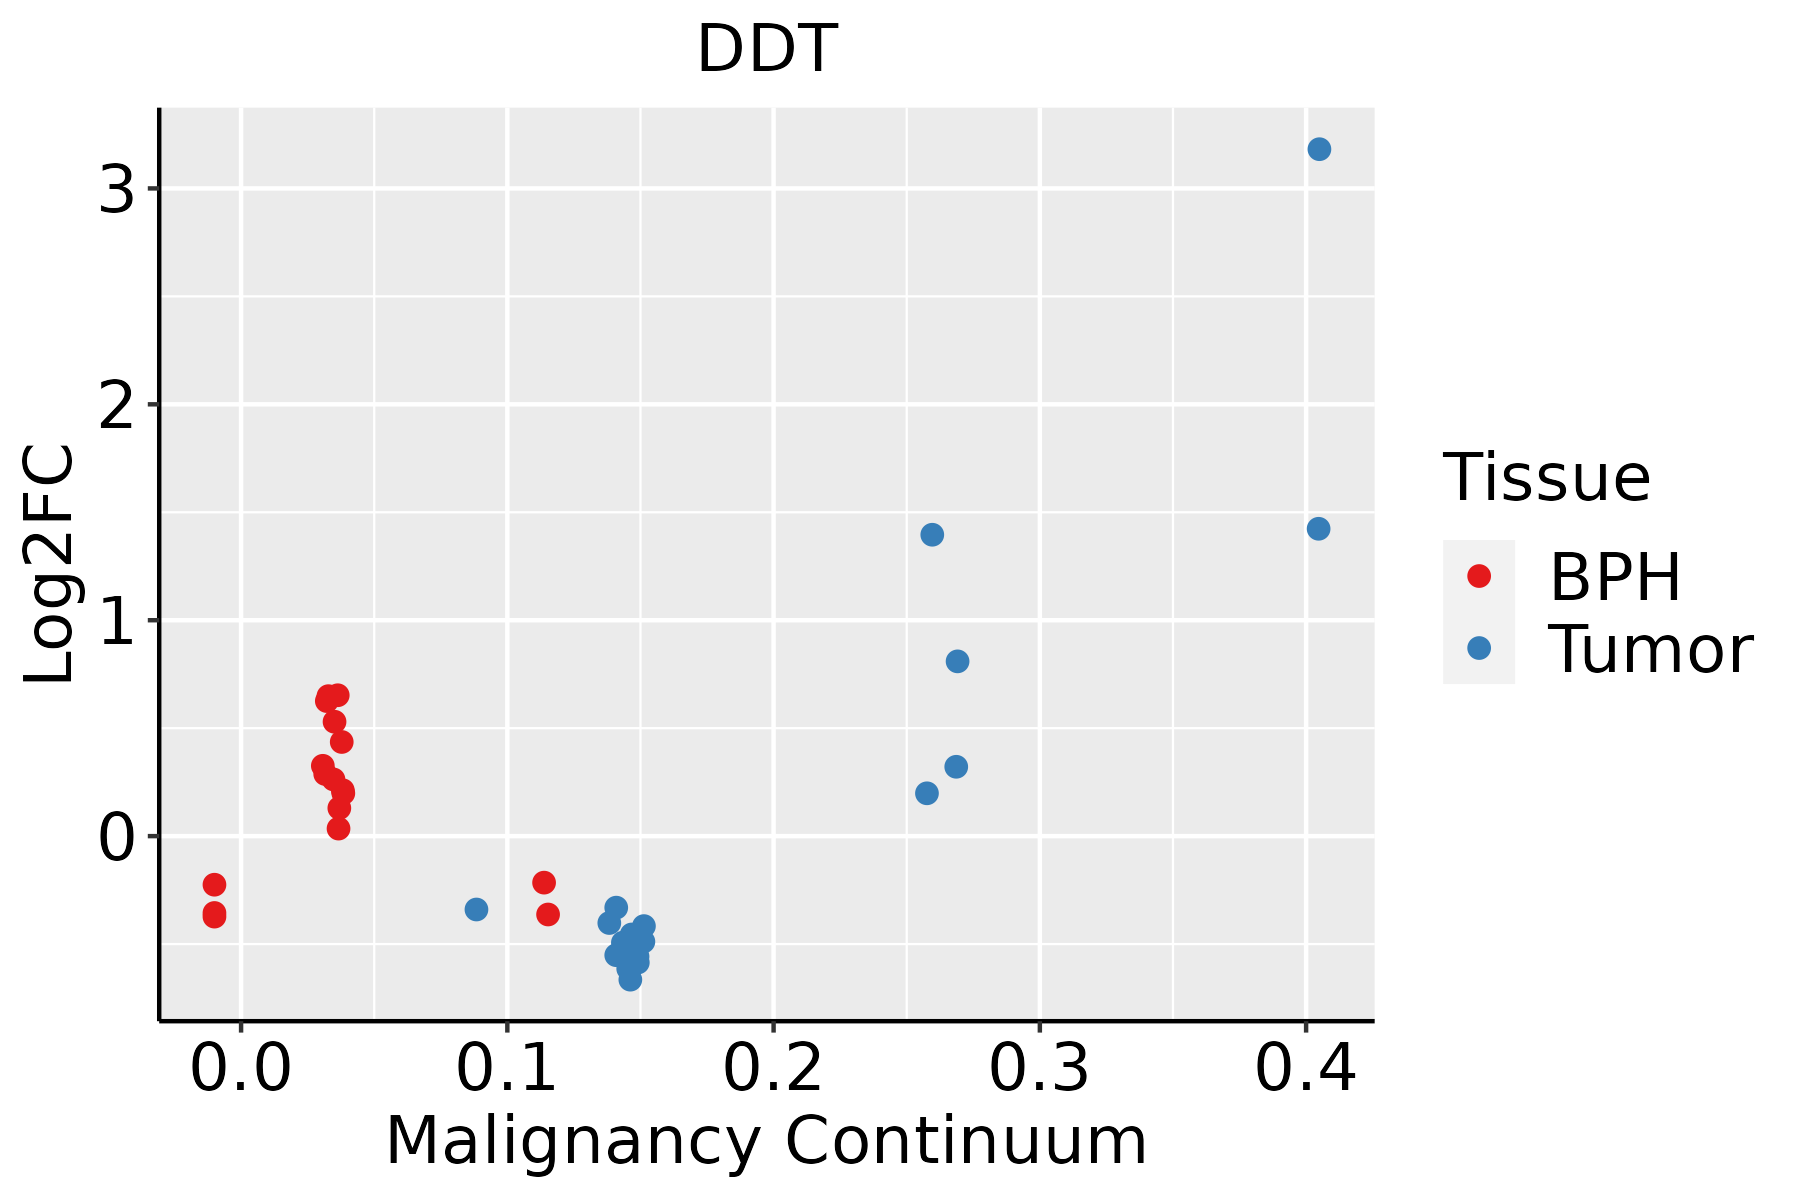 | BPH: Benign Prostatic Hyperplasia |
| Skin | 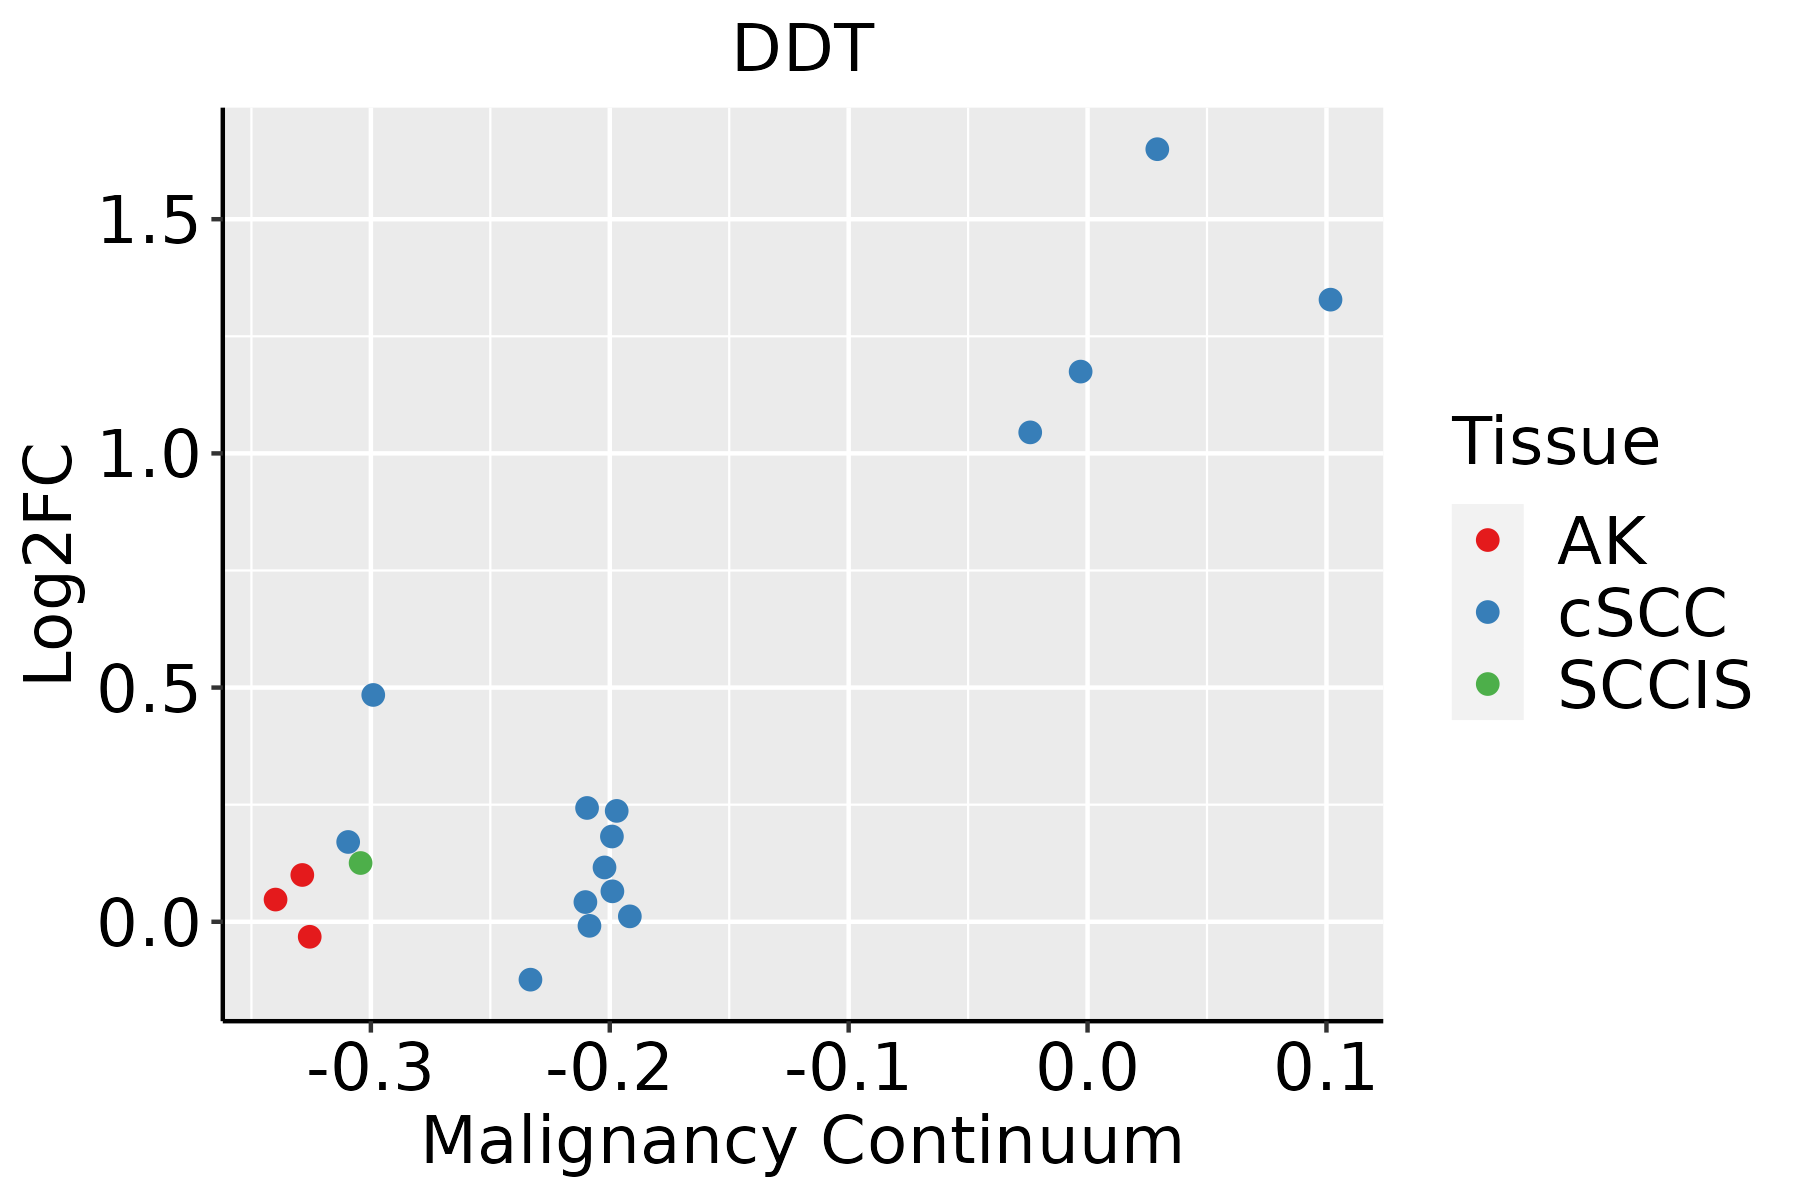 | AK: Actinic keratosis |
| cSCC: Cutaneous squamous cell carcinoma | ||
| SCCIS:squamous cell carcinoma in situ | ||
| Thyroid |  | ATC: Anaplastic thyroid cancer |
| HT: Hashimoto's thyroiditis | ||
| PTC: Papillary thyroid cancer |
| ∗log2FC in expression of this searched gene in stem-like cells from each diseased tissue sample relative to stem-like cells in normal samples in each tissue plotted against the malignancy continuum. Samples are colored based on if they are from different disease stage. |
Top |
Malignant transformation related pathway analysis |
| Find out the enriched GO biological processes and KEGG pathways involved in transition from healthy to precancer to cancer |
| Tissue | Disease Stage | Enriched GO biological Processes |
| Colorectum | AD |  |
| Colorectum | SER |  |
| Colorectum | MSS |  |
| Colorectum | MSI-H |  |
| Colorectum | FAP |  |
| ∗Top 15 enriched GO BP terms are showed in the bar plot of each disease state in each tissue. Each row represents a significant GO biological process which is colored according to the -log10(p.adjust). |
| Page: 1 2 3 4 5 6 7 8 9 |
| GO ID | Tissue | Disease Stage | Description | Gene Ratio | Bg Ratio | pvalue | p.adjust | Count |
| GO:00975297 | Breast | Precancer | myeloid leukocyte migration | 34/1080 | 220/18723 | 1.42e-07 | 7.82e-06 | 34 |
| GO:00509006 | Breast | Precancer | leukocyte migration | 47/1080 | 369/18723 | 2.82e-07 | 1.39e-05 | 47 |
| GO:00305956 | Breast | Precancer | leukocyte chemotaxis | 34/1080 | 230/18723 | 4.16e-07 | 1.89e-05 | 34 |
| GO:00603266 | Breast | Precancer | cell chemotaxis | 41/1080 | 310/18723 | 5.99e-07 | 2.55e-05 | 41 |
| GO:00018196 | Breast | Precancer | positive regulation of cytokine production | 52/1080 | 467/18723 | 4.18e-06 | 1.29e-04 | 52 |
| GO:00507293 | Breast | Precancer | positive regulation of inflammatory response | 23/1080 | 142/18723 | 6.51e-06 | 1.81e-04 | 23 |
| GO:0050727 | Breast | Precancer | regulation of inflammatory response | 44/1080 | 386/18723 | 1.26e-05 | 3.22e-04 | 44 |
| GO:00321034 | Breast | Precancer | positive regulation of response to external stimulus | 46/1080 | 427/18723 | 3.41e-05 | 7.40e-04 | 46 |
| GO:00313493 | Breast | Precancer | positive regulation of defense response | 33/1080 | 278/18723 | 6.79e-05 | 1.36e-03 | 33 |
| GO:00026856 | Breast | Precancer | regulation of leukocyte migration | 27/1080 | 210/18723 | 7.93e-05 | 1.54e-03 | 27 |
| GO:00482463 | Breast | Precancer | macrophage chemotaxis | 9/1080 | 38/18723 | 2.44e-04 | 3.66e-03 | 9 |
| GO:19055173 | Breast | Precancer | macrophage migration | 11/1080 | 55/18723 | 2.57e-04 | 3.83e-03 | 11 |
| GO:00026887 | Breast | Precancer | regulation of leukocyte chemotaxis | 17/1080 | 122/18723 | 6.34e-04 | 7.86e-03 | 17 |
| GO:00026836 | Breast | Precancer | negative regulation of immune system process | 41/1080 | 434/18723 | 1.33e-03 | 1.40e-02 | 41 |
| GO:00326406 | Breast | Precancer | tumor necrosis factor production | 20/1080 | 181/18723 | 4.01e-03 | 3.17e-02 | 20 |
| GO:00326806 | Breast | Precancer | regulation of tumor necrosis factor production | 20/1080 | 181/18723 | 4.01e-03 | 3.17e-02 | 20 |
| GO:00509201 | Breast | Precancer | regulation of chemotaxis | 23/1080 | 223/18723 | 5.05e-03 | 3.80e-02 | 23 |
| GO:00717066 | Breast | Precancer | tumor necrosis factor superfamily cytokine production | 20/1080 | 186/18723 | 5.43e-03 | 4.01e-02 | 20 |
| GO:19035556 | Breast | Precancer | regulation of tumor necrosis factor superfamily cytokine production | 20/1080 | 186/18723 | 5.43e-03 | 4.01e-02 | 20 |
| GO:00327605 | Breast | Precancer | positive regulation of tumor necrosis factor production | 13/1080 | 103/18723 | 6.26e-03 | 4.40e-02 | 13 |
| Page: 1 2 3 4 5 6 7 8 9 10 11 12 13 14 15 16 |
| Pathway ID | Tissue | Disease Stage | Description | Gene Ratio | Bg Ratio | pvalue | p.adjust | qvalue | Count |
| Page: 1 |
Top |
Cell-cell communication analysis |
| Identification of potential cell-cell interactions between two cell types and their ligand-receptor pairs for different disease states |
| Ligand | Receptor | LRpair | Pathway | Tissue | Disease Stage |
| Page: 1 |
Top |
Single-cell gene regulatory network inference analysis |
| Find out the significant the regulons (TFs) and the target genes of each regulon across cell types for different disease states |
| TF | Cell Type | Tissue | Disease Stage | Target Gene | RSS | Regulon Activity |
| ∗The dot plots of a searched regulon are shown for all cell subpopulations in each disease state of each tissue based on the regulon specific score inferred using pySCENIC and by calculating the average expression. |
| Page: 1 |
Top |
Somatic mutation of malignant transformation related genes |
| Annotation of somatic variants for genes involved in malignant transformation |
| Hugo Symbol | Variant Class | Variant Classification | dbSNP RS | HGVSc | HGVSp | HGVSp Short | SWISSPROT | BIOTYPE | SIFT | PolyPhen | Tumor Sample Barcode | Tissue | Histology | Sex | Age | Stage | Therapy Types | Drugs | Outcome |
| DDT | SNV | Missense_Mutation | rs537065055 | c.296N>A | p.Arg99His | p.R99H | P30046 | protein_coding | tolerated(0.2) | benign(0.003) | TCGA-AX-A0J1-01 | Endometrium | uterine corpus endometrioid carcinoma | Female | >=65 | I/II | Unknown | Unknown | SD |
| DDT | deletion | Frame_Shift_Del | novel | c.302delN | p.Phe101SerfsTer11 | p.F101Sfs*11 | P30046 | protein_coding | TCGA-HU-A4GT-01 | Stomach | stomach adenocarcinoma | Female | >=65 | I/II | Chemotherapy | copolang | SD |
| Page: 1 |
Top |
Related drugs of malignant transformation related genes |
| Identification of chemicals and drugs interact with genes involved in malignant transfromation |
| (DGIdb 4.0) |
| Entrez ID | Symbol | Category | Interaction Types | Drug Claim Name | Drug Name | PMIDs |
| Page: 1 |

Copyright 2023-Present -The University of Texas Health Science Center at Houston |